


While public markets have largely become a source of beta, dispersion among managers in the private markets remains wide.
Public Markets Are a Source of Beta
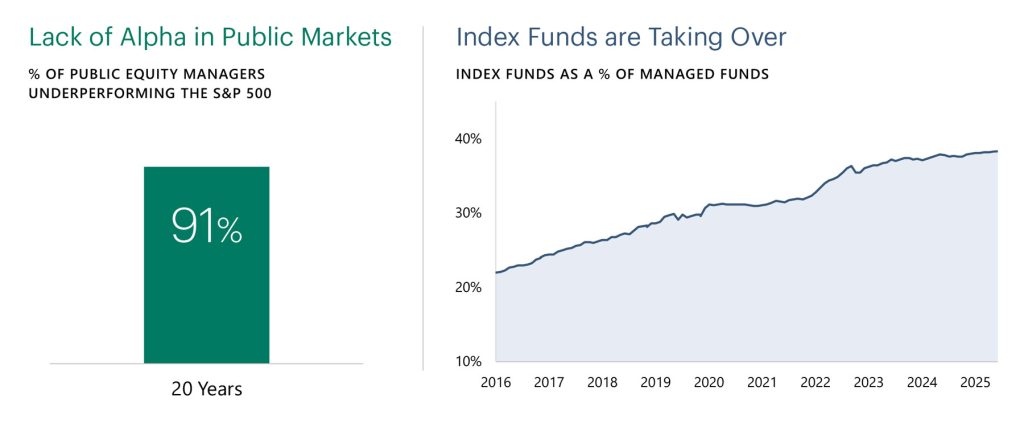
Public markets have increasingly come to function as sources of beta rather than arenas where managers can consistently add value through active management. Over long horizons, most active equity managers have failed to outperform broad market benchmarks, with 91% of public equity managers underperforming the S&P 500 over the past 20 years.
At the same time, the share of assets managed passively has surged as investors embrace low-cost, index-tracking strategies. Passive funds now represent almost 40% of all managed funds, reflecting a dramatic shift of capital toward strategies that deliver market beta rather than trying (and often failing) to beat it.
Private Market Alpha Exists (But Is Not Evenly Captured)
As we recently discussed, incorporating private markets into a traditional 60/40 portfolio of public stocks and bonds has historically enhanced returns while reducing overall risk. That said, performance dispersion in private markets is meaningfully wider than in public markets. As the chart below illustrates, private markets have delivered higher median returns than their public counterparts, but with significantly greater variability across managers. In private equity, the return gap between top- and bottom-decile managers is almost 30%, compared with just 2% in public equities. A similar pattern holds in credit, where private debt shows a 13% spread versus roughly 1% in public fixed income. This dispersion has implications beyond headline returns. Distributions — an increasingly important focus for private market investors in today’s environment — also vary materially by manager. PitchBook data shows that portfolio companies acquired at higher entry multiples have taken substantially longer to exit than those purchased at lower valuations, a dynamic that has become even more pronounced in recent vintages.
Historically Higher Returns, Wider Outcomes
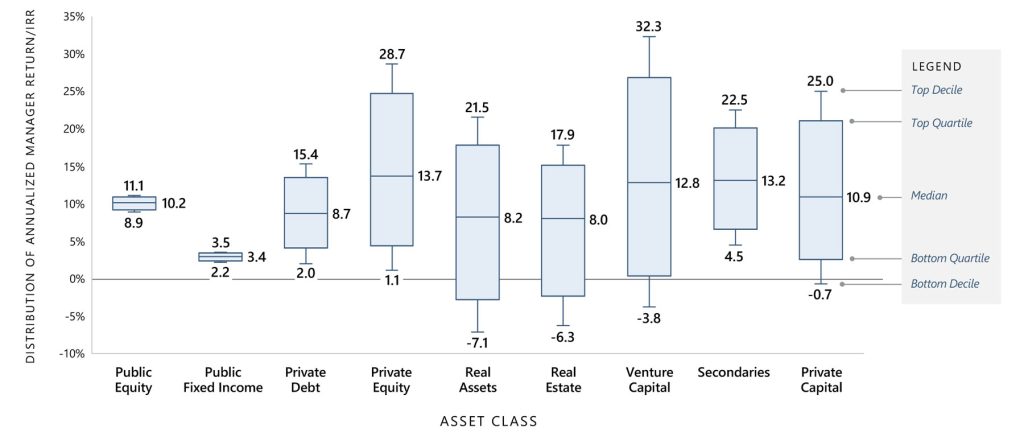
For illustrative purposes only. Subject to change at any time without notice. Past performance is not indicative of nor a guarantee of future results. Public equity data is from Morningstar US large blend and public fixed income data is from Morningstar US fund intermediate core bond 20-year return dispersion data through December 2025. All other asset classes are sourced from the PitchBook database of funds across vintage years 2005–2019 as of March 2025 (20-year IRR). The primary metric is IRR; private debt includes CLOs, direct lending, special situations, distressed, mezzanine, bridge financing, RE debt, infrastructure debt, venture debt; private equity includes buyout, growth/expansion, diversified private equity, turnaround; real assets include real estate and infrastructure, real estate includes core, core plus, value added, opportunistic and distressed; venture capital includes angel fund, early stage, later stage; secondaries include all asset classes; private capital includes private equity, VC, real estate, infrastructure, private debt, secondaries.
The information herein is provided for educational purposes only and should not be construed as financial or investment advice, nor should any information in this document be relied on when making an investment decision. Opinions and views expressed reflect the current opinions and views of the authors and Apollo Analysts as of the date hereof and are subject to change. Please see the end of this document for important disclosure information.
Important Disclosure Information
This presentation is for educational purposes only and should not be treated as research. This presentation may not be distributed, transmitted or otherwise communicated to others, in whole or in part, without the express written consent of Apollo Global Management, Inc. (together with its subsidiaries, “Apollo”).
The views and opinions expressed in this presentation are the views and opinions of the author(s) of the White Paper. They do not necessarily reflect the views and opinions of Apollo and are subject to change at any time without notice. Further, Apollo and its affiliates may have positions (long or short) or engage in securities transactions that are not consistent with the information and views expressed in this presentation. There can be no assurance that an investment strategy will be successful. Historic market trends are not reliable indicators of actual future market behavior or future performance of any particular investment which may differ materially, and should not be relied upon as such. Target allocations contained herein are subject to change. There is no assurance that the target allocations will be achieved, and actual allocations may be significantly different than that shown here. This presentation does not constitute an offer of any service or product of Apollo. It is not an invitation by or on behalf of Apollo to any person to buy or sell any security or to adopt any investment strategy, and shall not form the basis of, nor may it accompany nor form part of, any right or contract to buy or sell any security or to adopt any investment strategy. Nothing herein should be taken as investment advice or a recommendation to enter into any transaction.
Hyperlinks to third-party websites in this presentation are provided for reader convenience only. There can be no assurance that any trends discussed herein will continue. Unless otherwise noted, information included herein is presented as of the dates indicated. This presentation is not complete and the information contained herein may change at any time without notice. Apollo does not have any responsibility to update the presentation to account for such changes. Apollo has not made any representation or warranty, expressed or implied, with respect to fairness, correctness, accuracy, reasonableness, or completeness of any of the information contained herein, and expressly disclaims any responsibility or liability therefore. The information contained herein is not intended to provide, and should not be relied upon for, accounting, legal or tax advice or investment recommendations. Investors should make an independent investigation of the information contained herein, including consulting their tax, legal, accounting or other advisors about such information. Apollo does not act for you and is not responsible for providing you with the protections afforded to its clients.
Certain information contained herein may be “forward-looking” in nature. Due to various risks and uncertainties, actual events or results may differ materially from those reflected or contemplated in such forward-looking information. As such, undue reliance should not be placed on such information. Forward-looking statements may be identified by the use of terminology including, but not limited to, “may”, “will”, “should”, “expect”, “anticipate”, “target”, “project”, “estimate”, “intend”, “continue” or “believe” or the negatives thereof or other variations thereon or comparable terminology.
The Standard & Poor’s 500 (“S&P 500”) Index is a market-capitalization-weighted index of the 500 largest U.S. publicly traded companies by market value.
Additional information may be available upon request.