


The Daily Spark is moving to Apollo.com— read the latest from Torsten Slok here.
Want it delivered daily to your inbox?
-
Measures of M&A activity are approaching the lowest levels in decades, driven by the double whammy of high uncertainty for business planning and interest rates staying higher for longer.
The weak M&A environment will continue.
Why? Because unsustainable fiscal policy is putting upward pressure on long-end rates, while inflation is putting upward pressure on front-end rates, driven by tariffs, reduced immigration, and housing affordability boosting rental inflation.
The bottom line is that fixed income will continue to pay higher all-in yields to asset owners of credit.
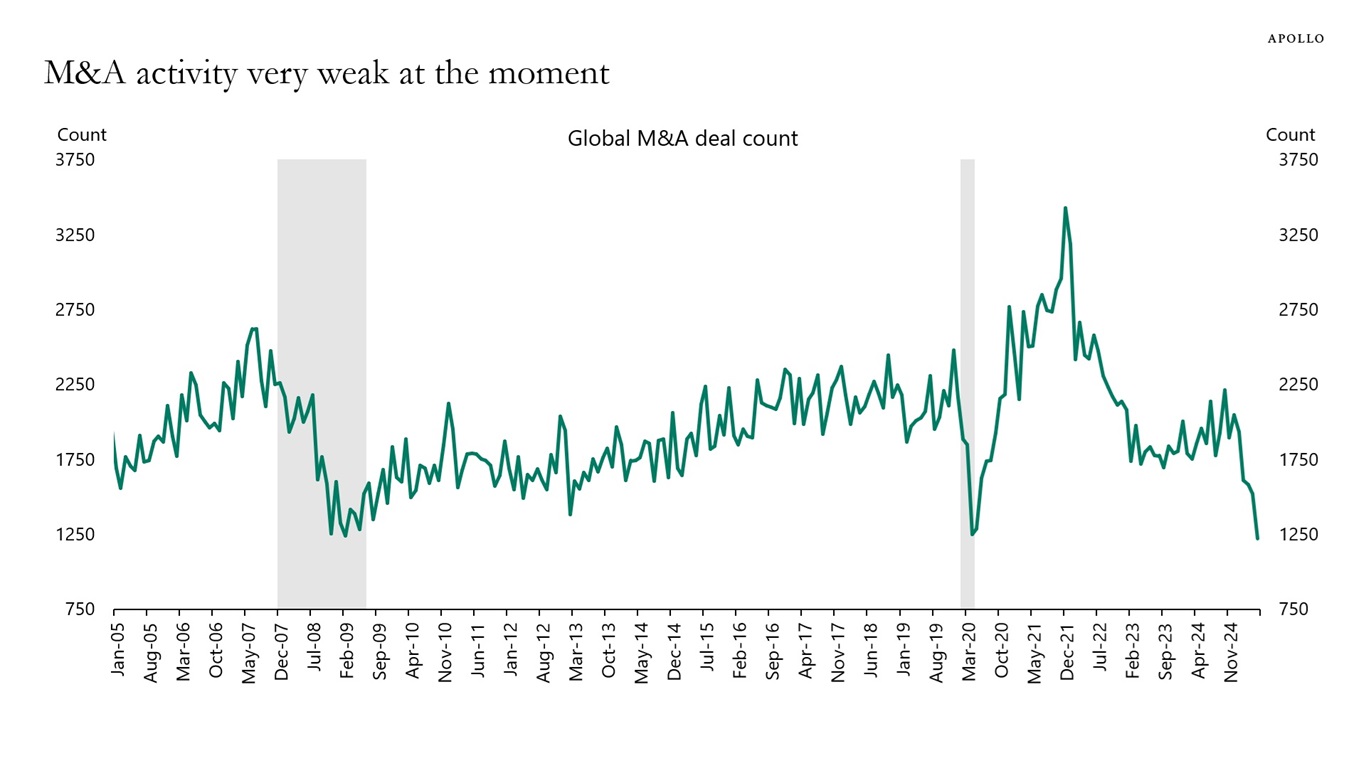
Note: Data uses completed M&A deals from MA<GO> screen on Bloomberg. Sources: Bloomberg, Apollo Chief Economist See important disclaimers at the bottom of the page.
-
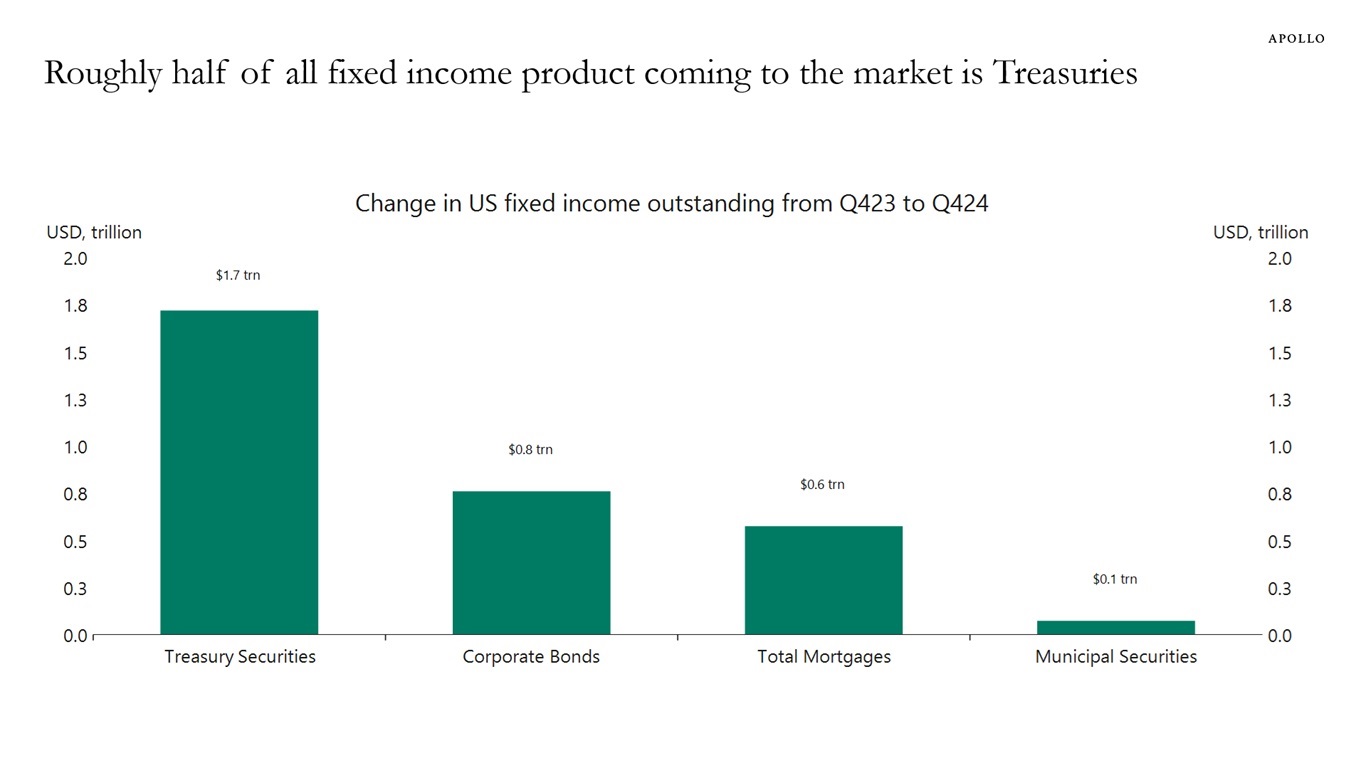
Over the past 12 months, roughly half of all fixed income product coming to the market has been Treasuries, see chart below.
This is not healthy. Half of credit issued in the economy should not be going to the government.
The consequence is that investors need to allocate more and more dollars to finance the government rather than financing growth in the economy through loans to firms and consumers.
The bottom line is that if the level of government debt were significantly lower, more dollars would be available for consumers to buy new cars and new houses, and for companies to build new factories.
Sources: Federal Reserve, Macrobond, Apollo Chief Economist See important disclaimers at the bottom of the page.
-
Over the past 10 years, 98% of active managers in Treasury fixed income funds have underperformed their benchmark. For active managers in public investment grade credit, the share is 82%, and for active managers in public high yield, the share is 79%. In fact, the data below from S&P shows that over the past decade, active managers in public fixed income have underperformed their benchmarks across all strategies, see chart below.

Note: Data as of December 31, 2024, based on absolute return. Sources: S&P SPIVA scorecard, Apollo Chief Economist See important disclaimers at the bottom of the page.
-
Surveys show that the top three risks for CEOs are geopolitical instability, trade and tariffs, and legal and regulatory uncertainty, see chart below.
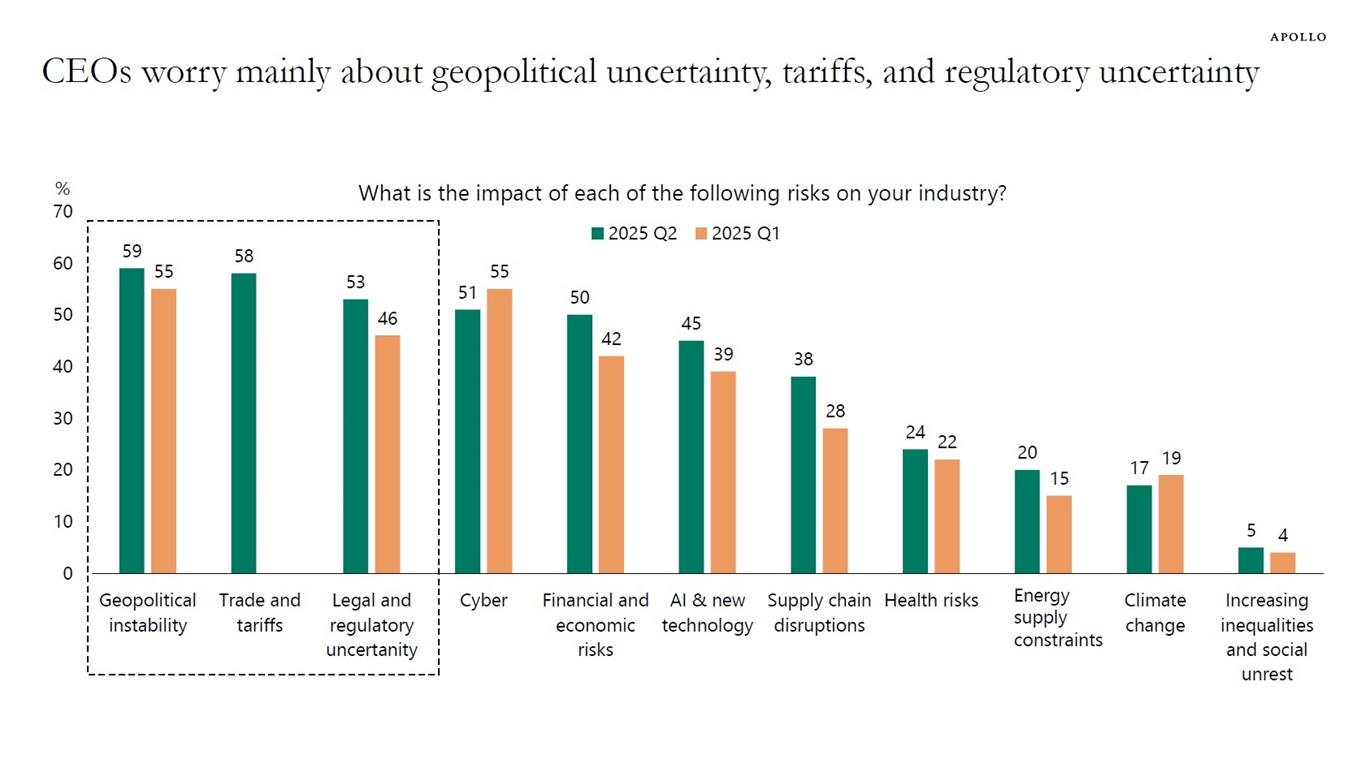
Data is based on “CEO Confidence Declined Significantly in Q2 2025.” Sources: The Conference Board Measure of CEO Confidence in collaboration with The Business Council, Apollo Chief Economist See important disclaimers at the bottom of the page.
-
With mortgage rates close to 7% and home prices at all-time highs, the share of first-time home buyers as a share of all houses sold has declined from 50% in 2010 to only 24% today, see the first chart below.
With fewer new households able to enter the housing market, affordability is putting upward pressure on rents, which is a problem for the Fed, see the second chart.
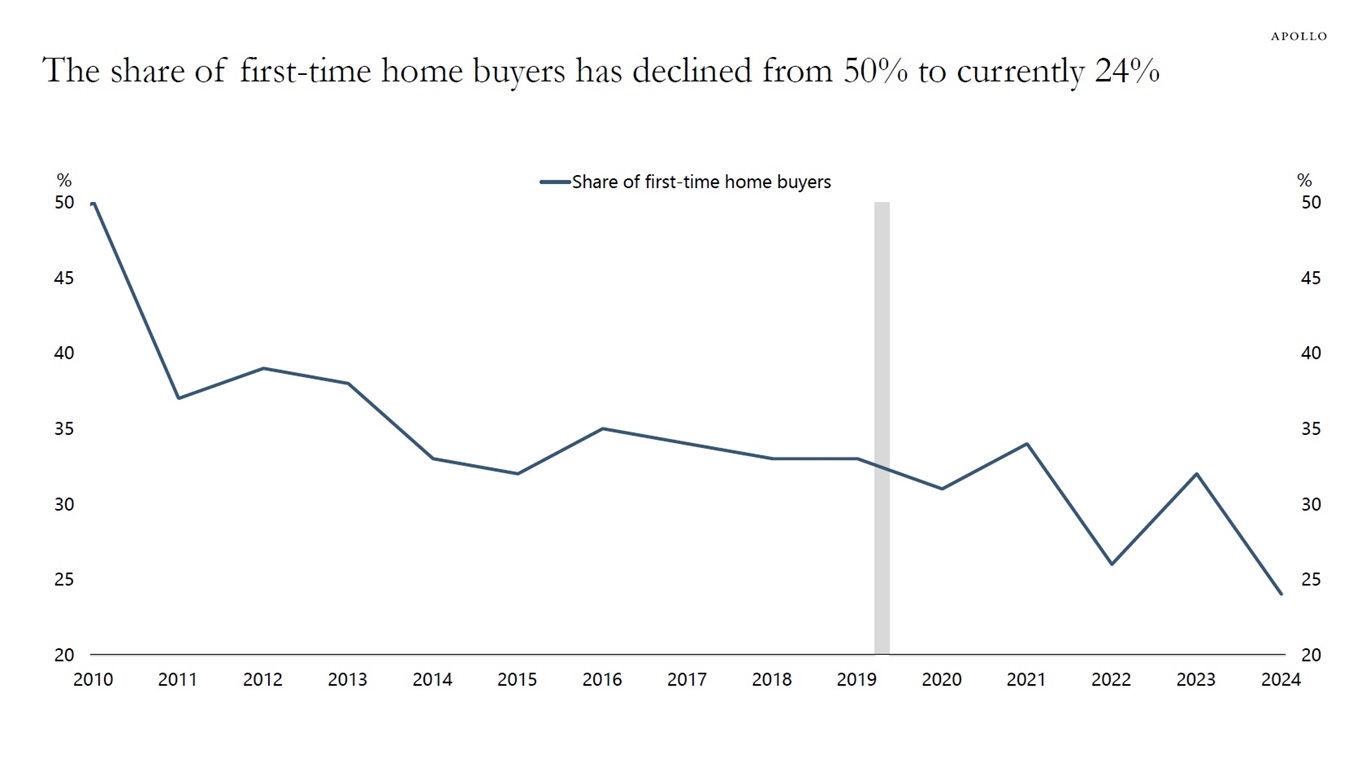
Sources: National Association of Realtors, Apollo Chief Economist 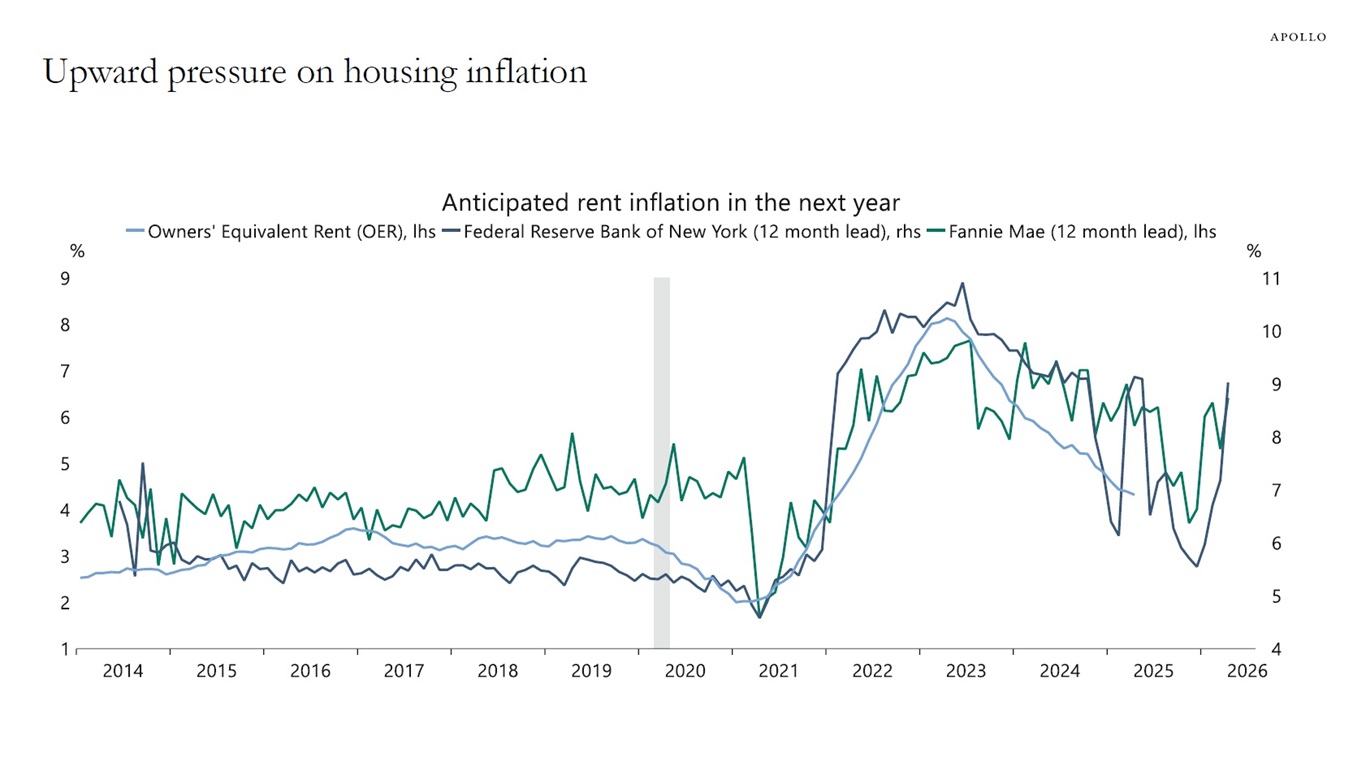
Sources: Federal National Mortgage Association (Fannie Mae), Federal Reserve Bank of New York, US Bureau of Labor Statistics (BLS), Macrobond, Apollo Chief Economist See important disclaimers at the bottom of the page.
-
Foreign arrivals at the top 10 busiest US airports continue to decline, see chart below.
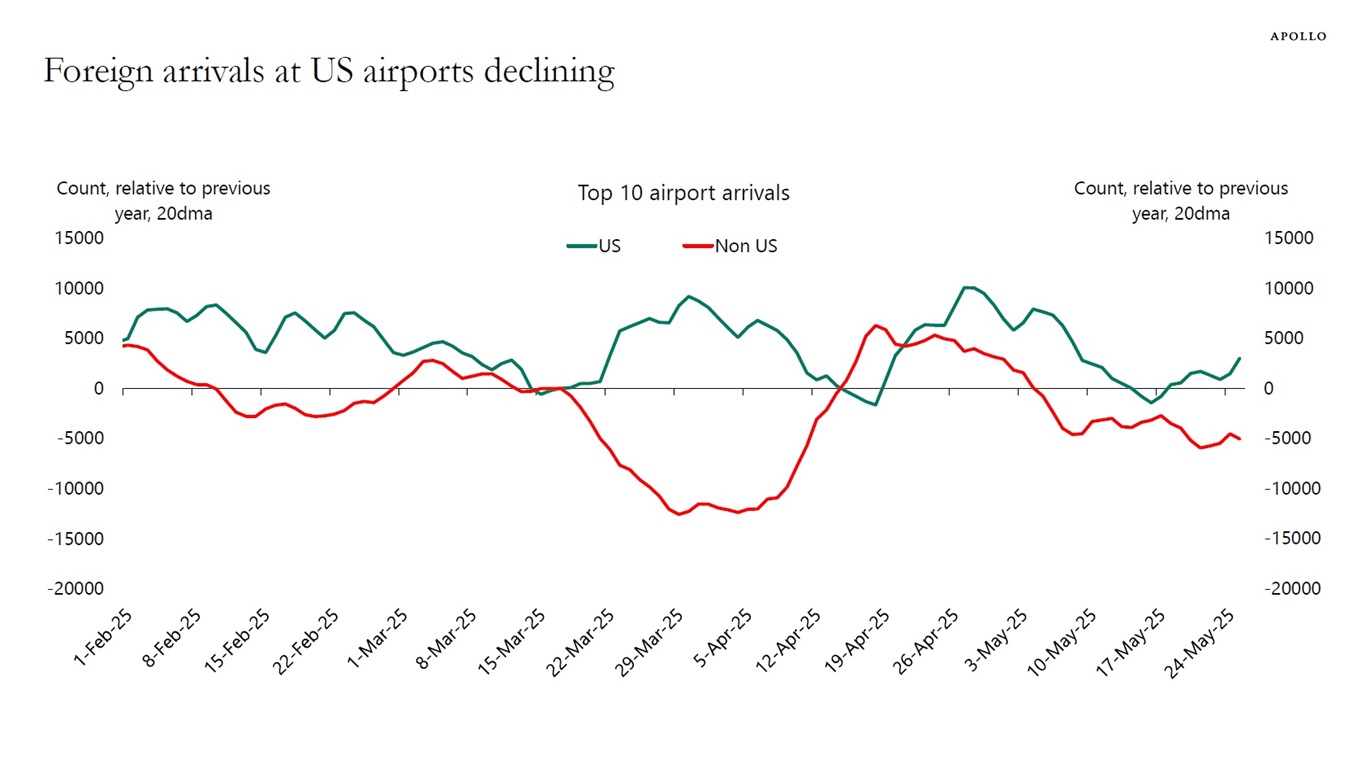
Note: Airports included are ATL, LAX, DFW, MIA, ORD, DEN, IAD, SFO, MCO, and JFK. Sources: CBP, Apollo Chief Economist See important disclaimers at the bottom of the page.
-
The consensus is forecasting a sharp slowdown in nonfarm payrolls over the coming quarters, see chart below.
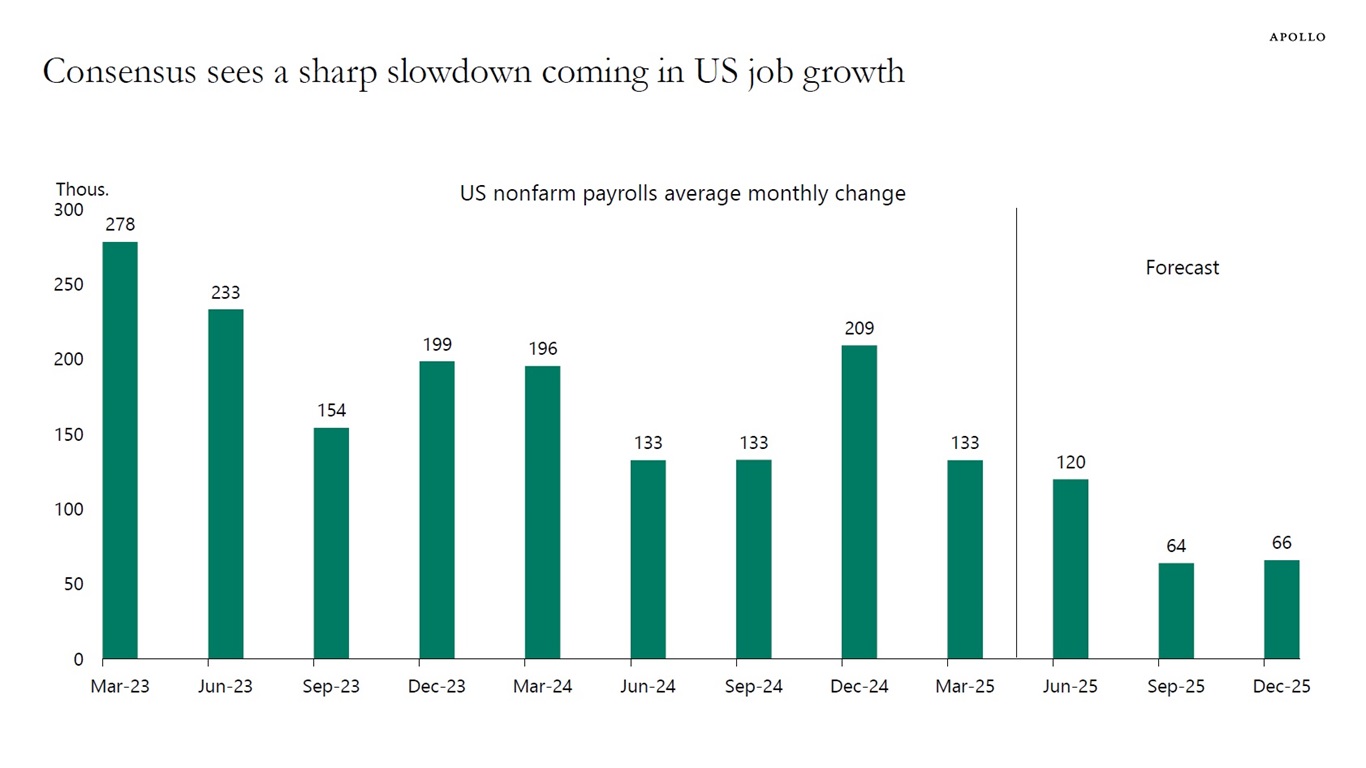
Sources: Bloomberg, Apollo Chief Economist See important disclaimers at the bottom of the page.
-
The consensus expects inflation to rise in the US and fall in the eurozone, see chart below. Combined with the worsening US fiscal situation, this highly unusual divergence will continue to put upward pressure on US rates across the curve and downward pressure on rates in Europe.
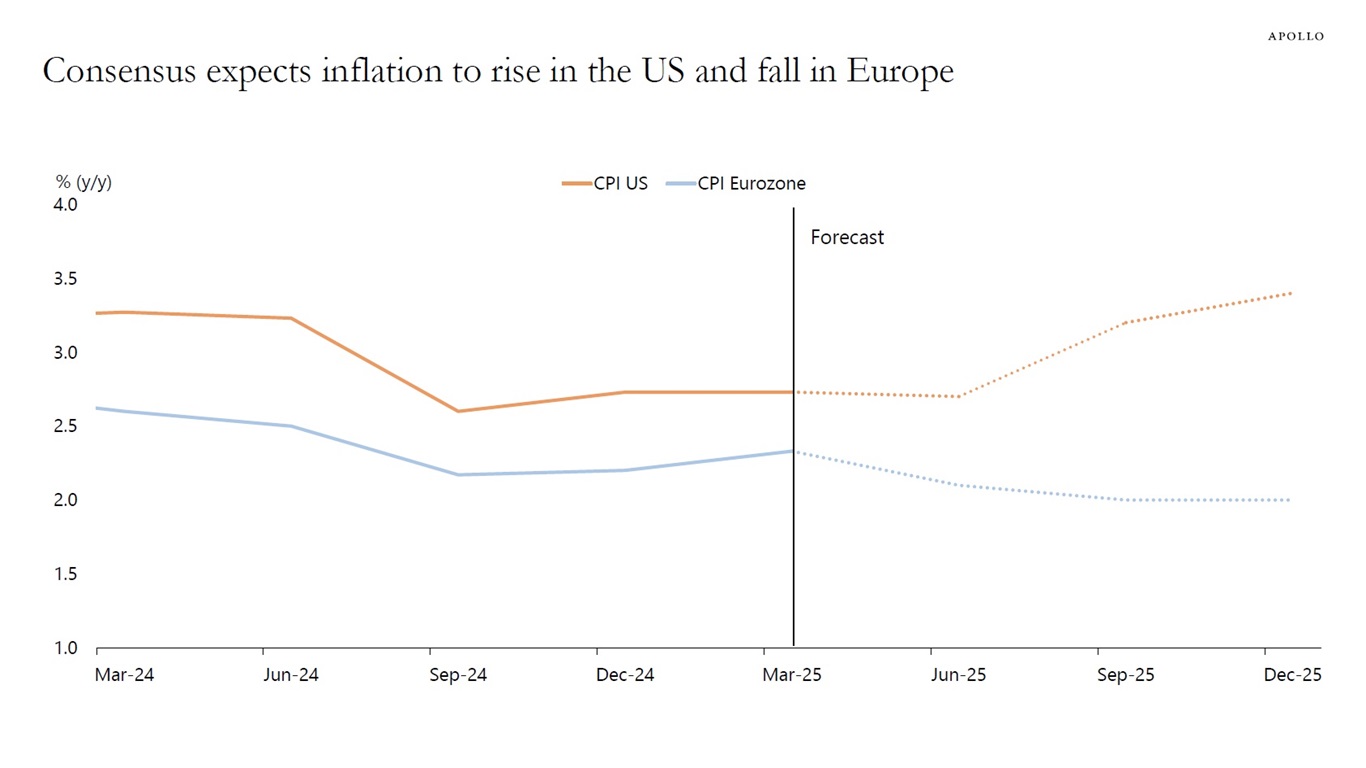
Sources: Bloomberg, Apollo Chief Economist See important disclaimers at the bottom of the page.
-
Home prices are falling in London, see chart below.

Sources: UK Land Registry, Macrobond, Apollo Chief Economist See important disclaimers at the bottom of the page.
-
Seventy-three percent of bonds in the world trade at a yield of less than 5%, see chart below. There is only beta in public credit markets, and with the total amount of public credit outstanding at $12 trillion and only $15 billion in dealer inventory, there is little liquidity in public credit markets, see charts below. Our latest credit market outlook is available here.
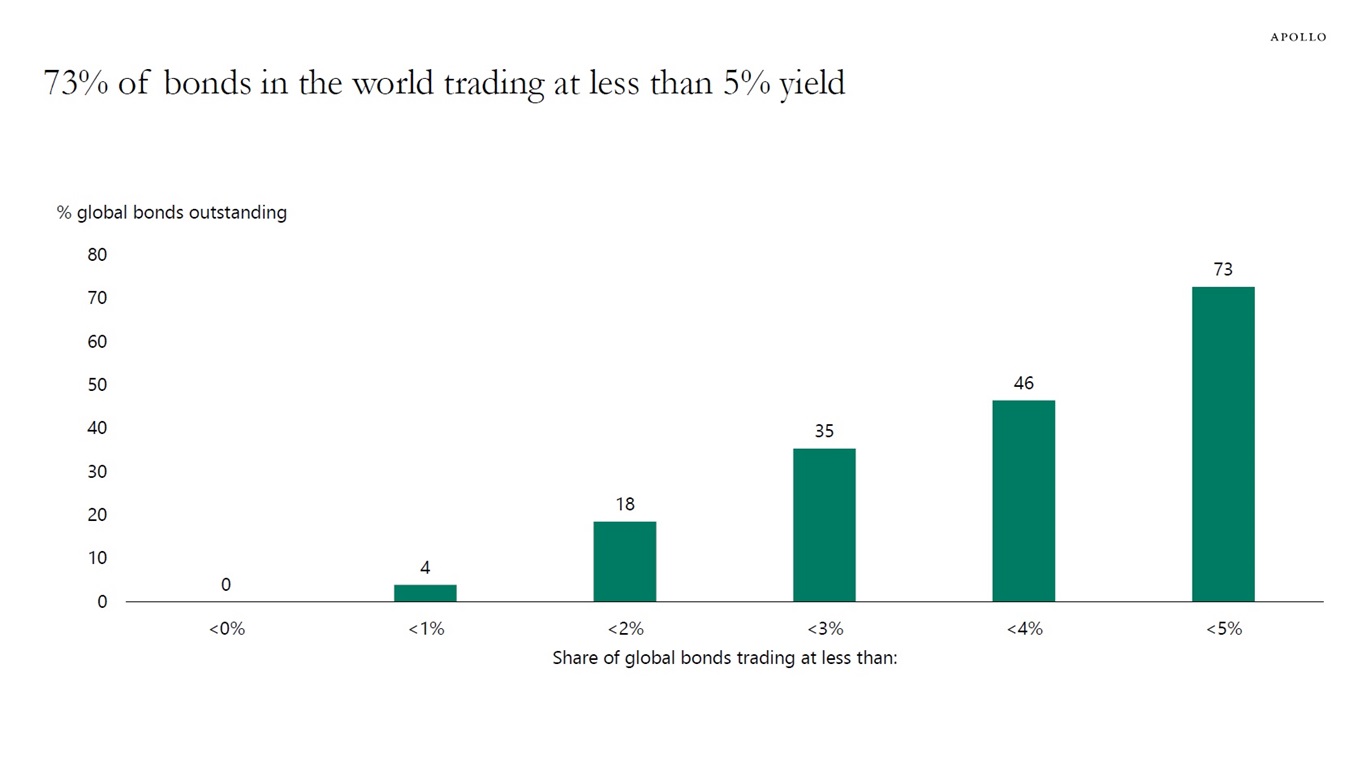
Note: Data as of May 28, 2025. Sources: Bloomberg, Apollo Chief Economist 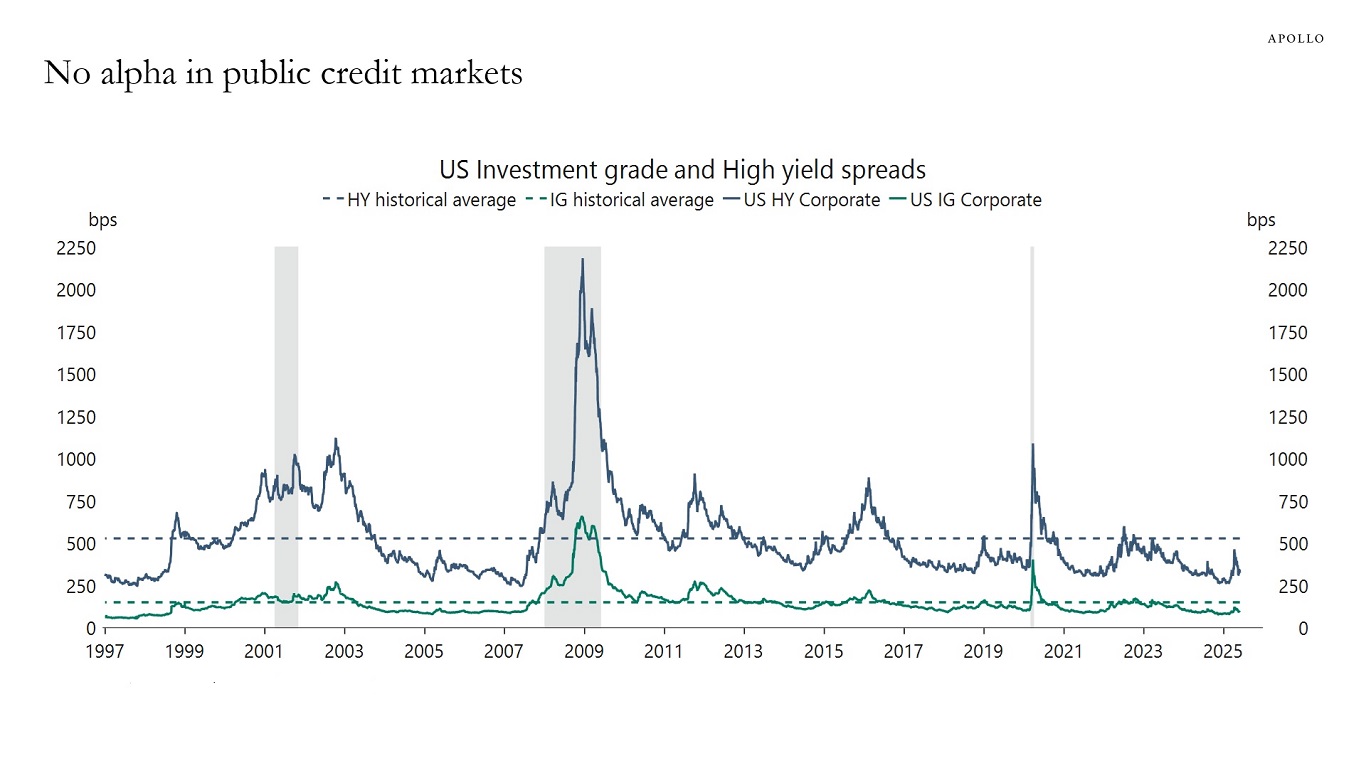
Sources: ICE BofAML, Macrobond, Apollo Chief Economist 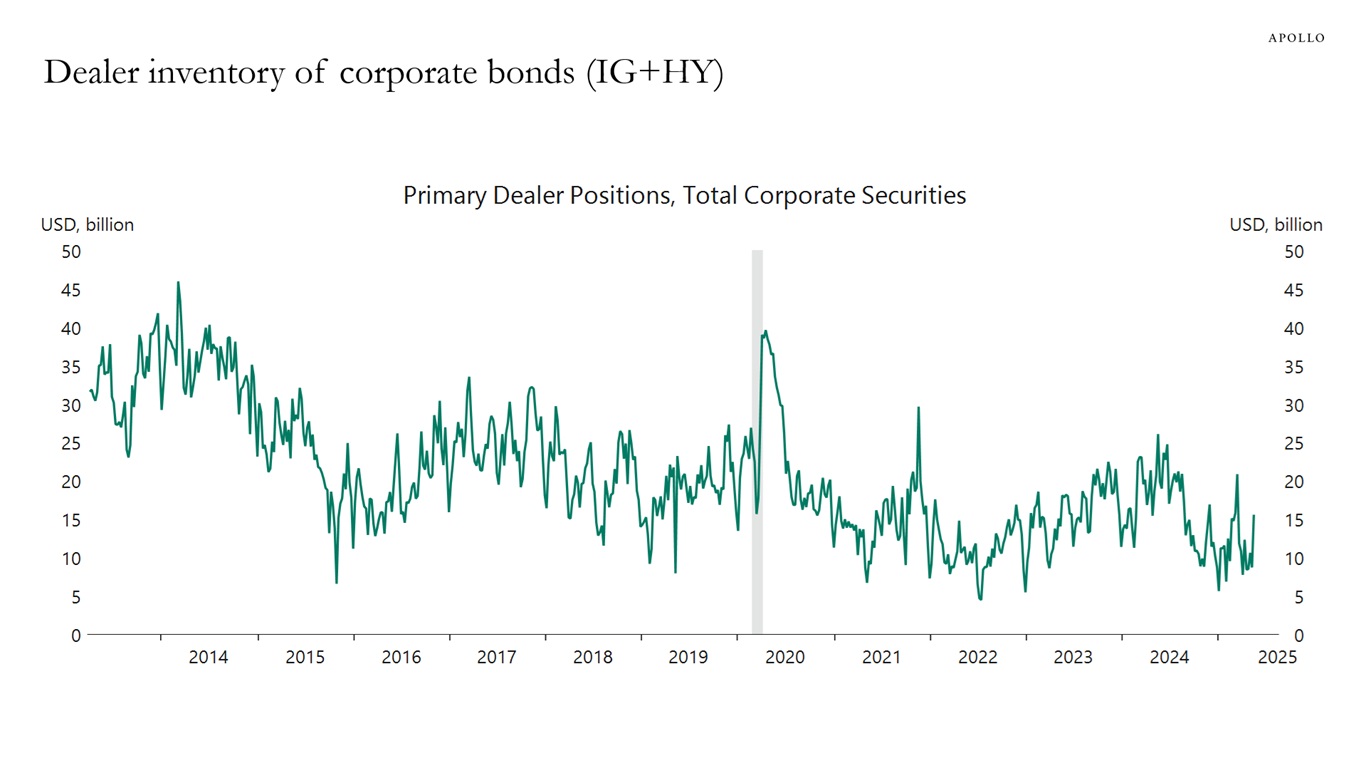
Sources: Federal Reserve Bank of New York, Macrobond, Apollo Chief Economist 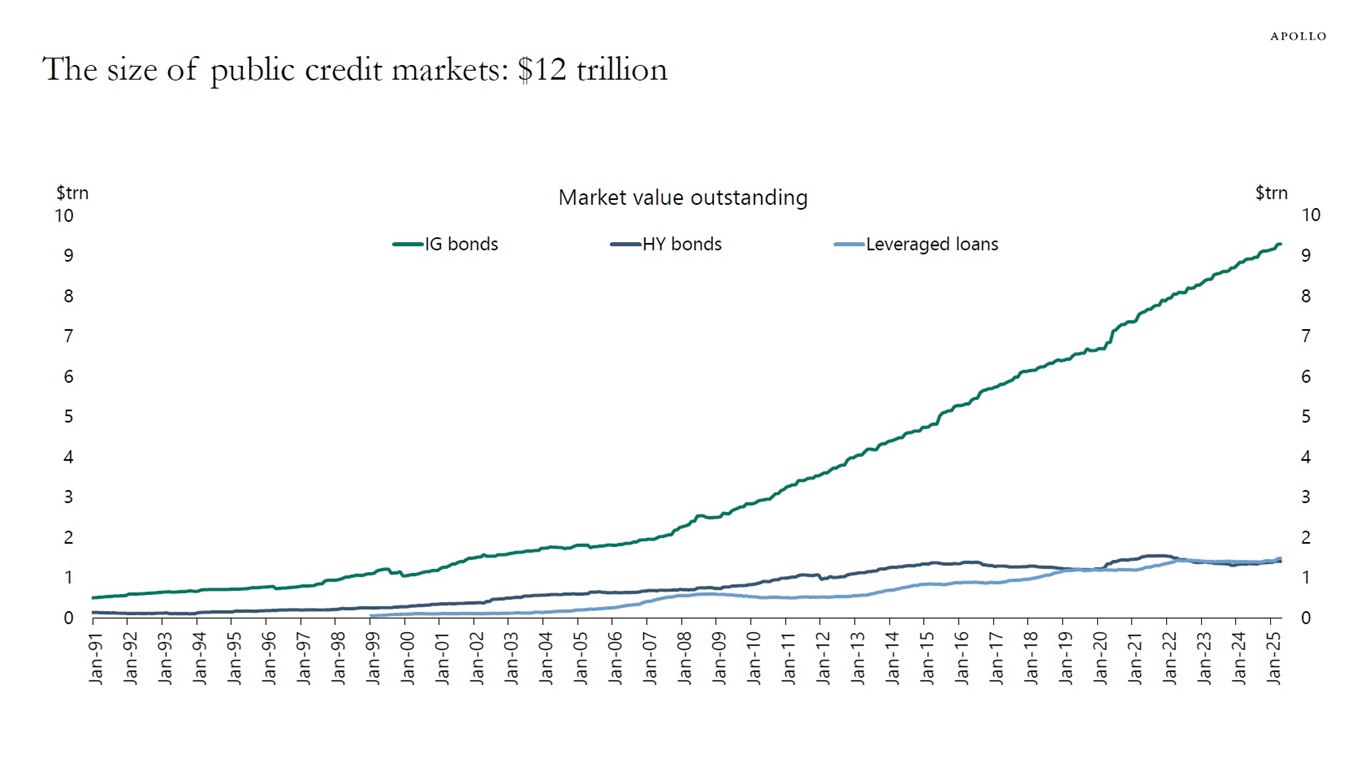
Note: Ticker used for HY is H0A0 Index and for IG it is C0A0 Index and for Loans it is SPBDALB Index. Sources: ICE BofA, Bloomberg, PitchBook LCD, Apollo Chief Economist See important disclaimers at the bottom of the page.

This presentation may not be distributed, transmitted or otherwise communicated to others in whole or in part without the express consent of Apollo Global Management, Inc. (together with its subsidiaries, “Apollo”).
Apollo makes no representation or warranty, expressed or implied, with respect to the accuracy, reasonableness, or completeness of any of the statements made during this presentation, including, but not limited to, statements obtained from third parties. Opinions, estimates and projections constitute the current judgment of the speaker as of the date indicated. They do not necessarily reflect the views and opinions of Apollo and are subject to change at any time without notice. Apollo does not have any responsibility to update this presentation to account for such changes. There can be no assurance that any trends discussed during this presentation will continue.
Statements made throughout this presentation are not intended to provide, and should not be relied upon for, accounting, legal or tax advice and do not constitute an investment recommendation or investment advice. Investors should make an independent investigation of the information discussed during this presentation, including consulting their tax, legal, accounting or other advisors about such information. Apollo does not act for you and is not responsible for providing you with the protections afforded to its clients. This presentation does not constitute an offer to sell, or the solicitation of an offer to buy, any security, product or service, including interest in any investment product or fund or account managed or advised by Apollo.
Certain statements made throughout this presentation may be “forward-looking” in nature. Due to various risks and uncertainties, actual events or results may differ materially from those reflected or contemplated in such forward-looking information. As such, undue reliance should not be placed on such statements. Forward-looking statements may be identified by the use of terminology including, but not limited to, “may”, “will”, “should”, “expect”, “anticipate”, “target”, “project”, “estimate”, “intend”, “continue” or “believe” or the negatives thereof or other variations thereon or comparable terminology.