


The Daily Spark is moving to Apollo.com— read the latest from Torsten Slok here.
Want it delivered daily to your inbox?
-
Below are some questions I have been getting from clients recently. All risk managers should be asking themselves these questions.
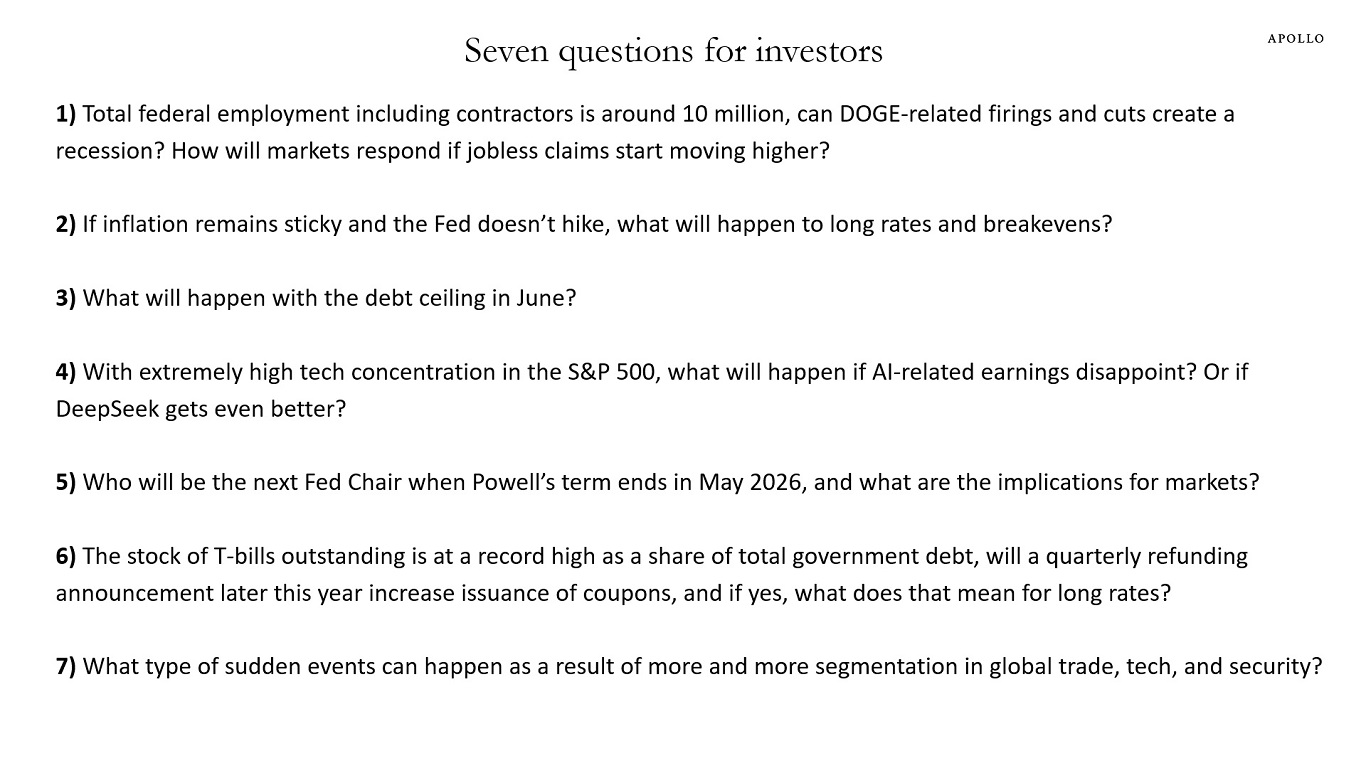
Source: Apollo Chief Economist See important disclaimers at the bottom of the page.
-
We are watching the weekly data for the number of people who file for unemployment benefits in Washington DC, Maryland, and Virginia, and any impact federal government layoffs may have on nationwide jobless claims, see chart below. This data comes out every Thursday at 8:30 a.m. ET.
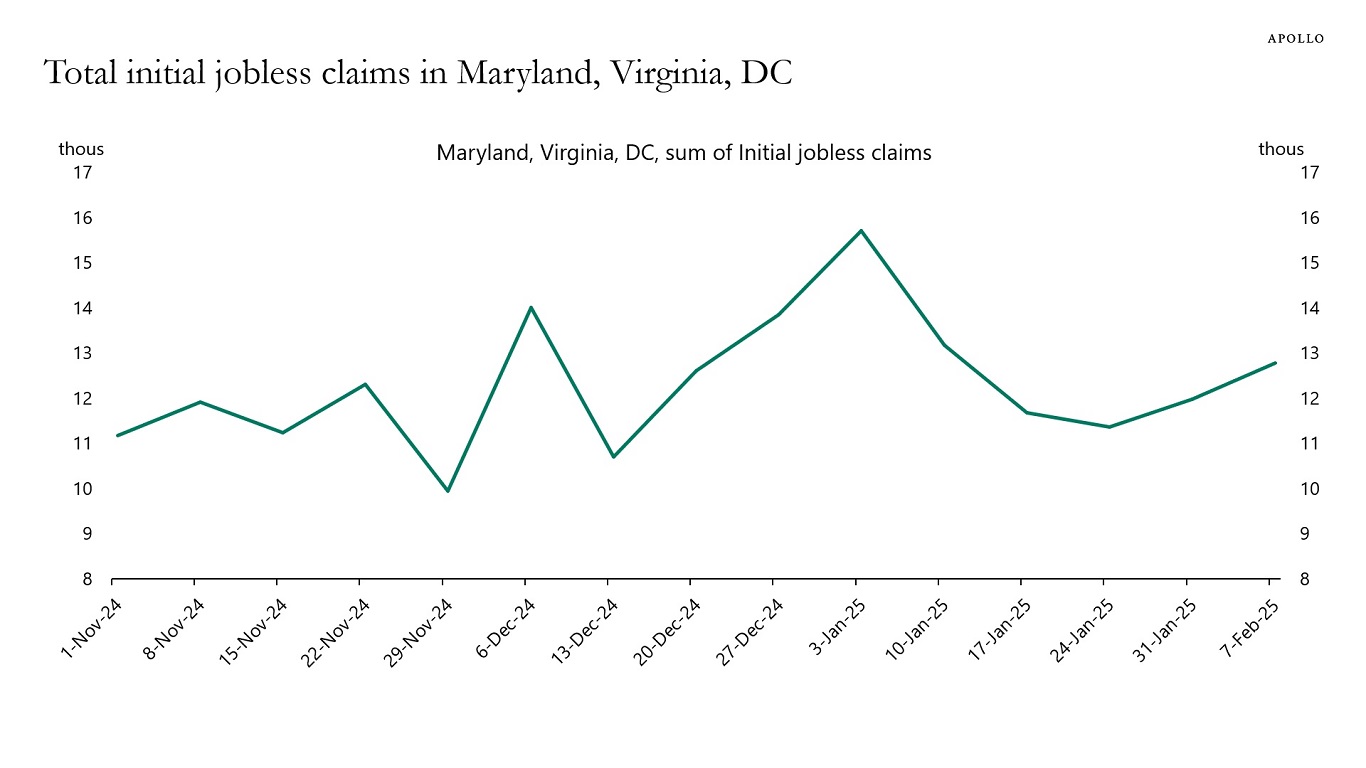
Source: US Department of Labor, Bloomberg, Apollo Chief Economist See important disclaimers at the bottom of the page.
-
The outlook for Spain continues to improve, and the outlook for Germany continues to deteriorate, see charts below.
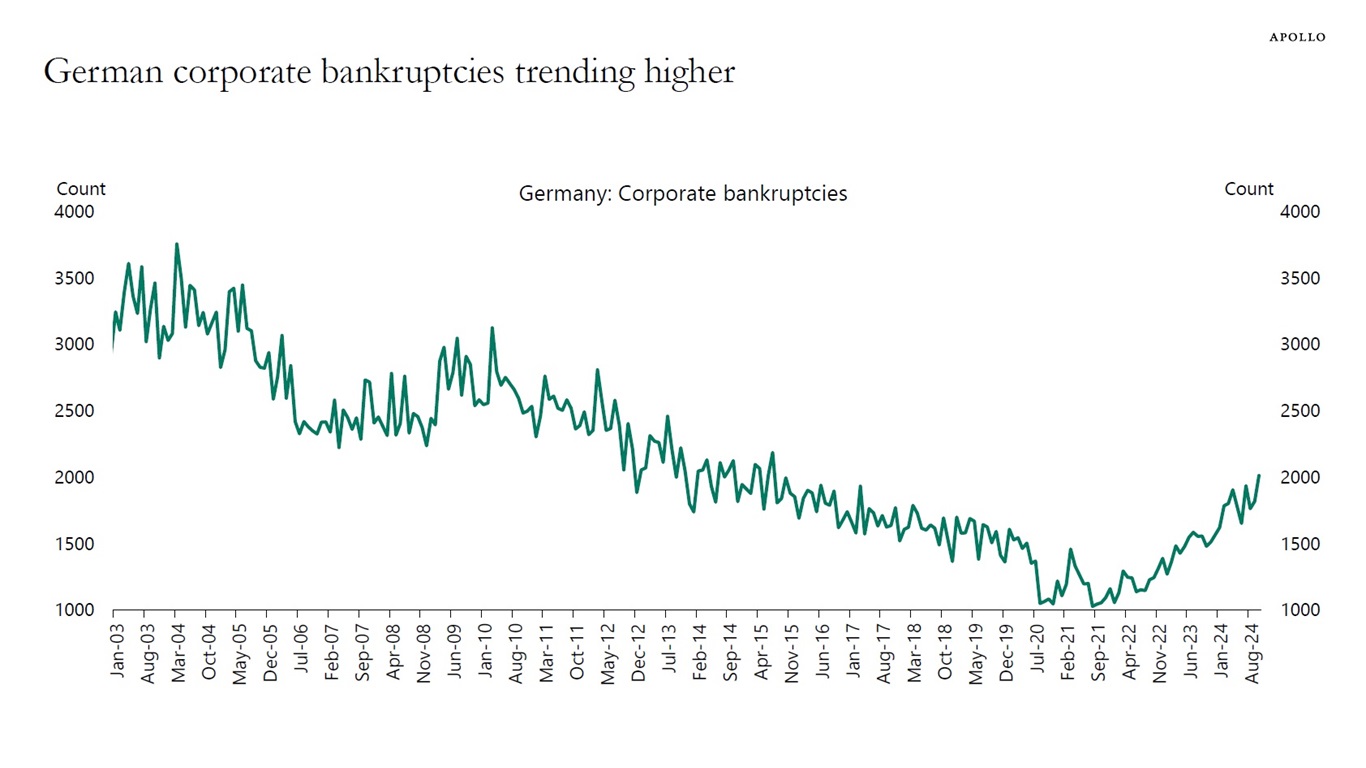
Source: German Federal Statistical Office, Bloomberg, Apollo Chief Economist 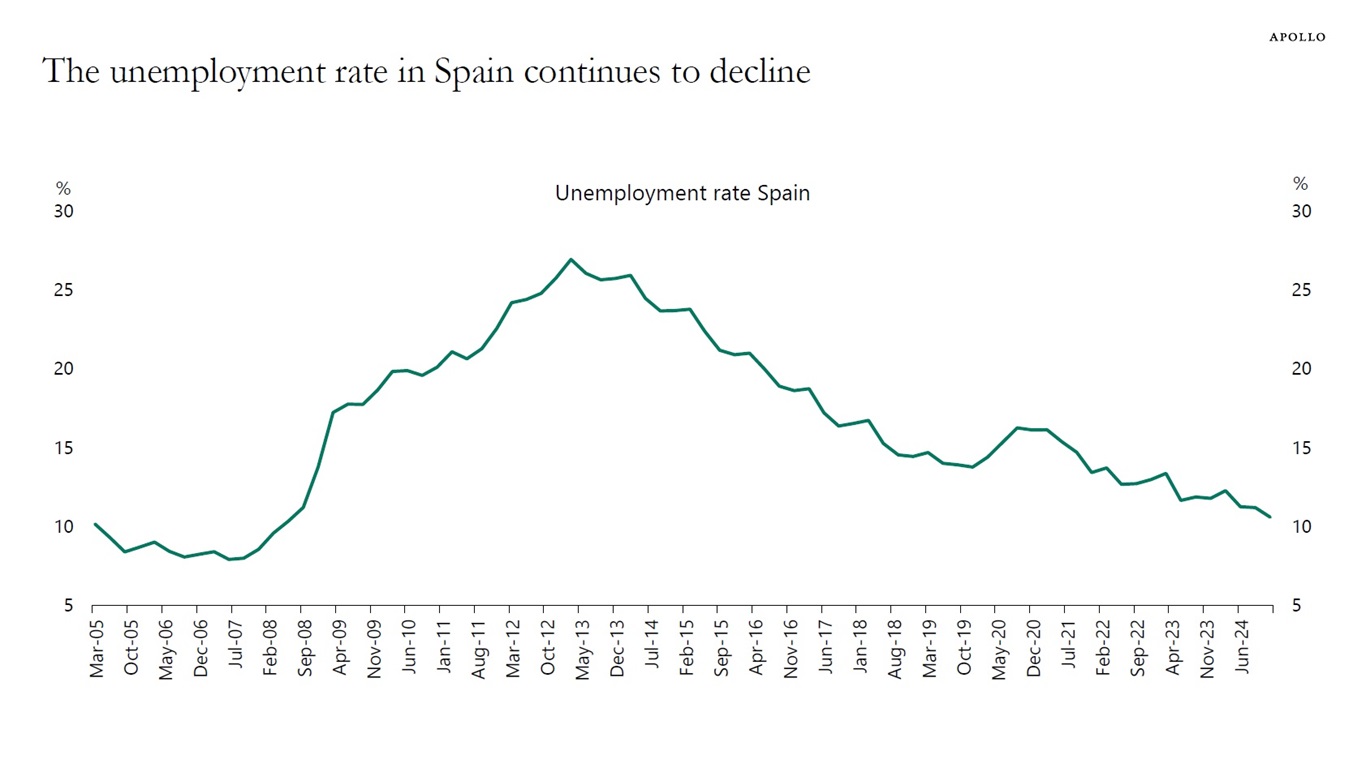
Source: INE, Apollo Chief Economist See important disclaimers at the bottom of the page.
-
The average age of passenger cars on the roads in the US continues to rise, see chart below.
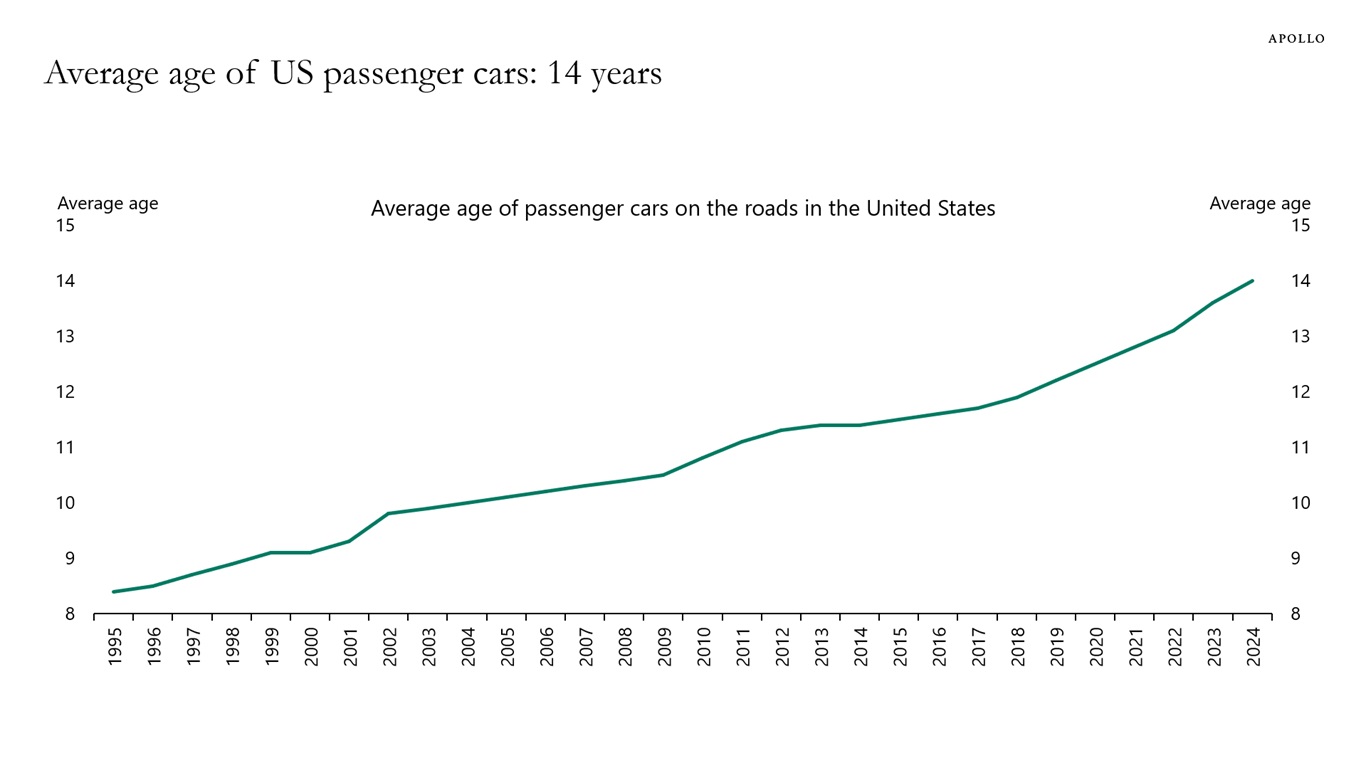
Source: Bloomberg, Apollo Chief Economist See important disclaimers at the bottom of the page.
-
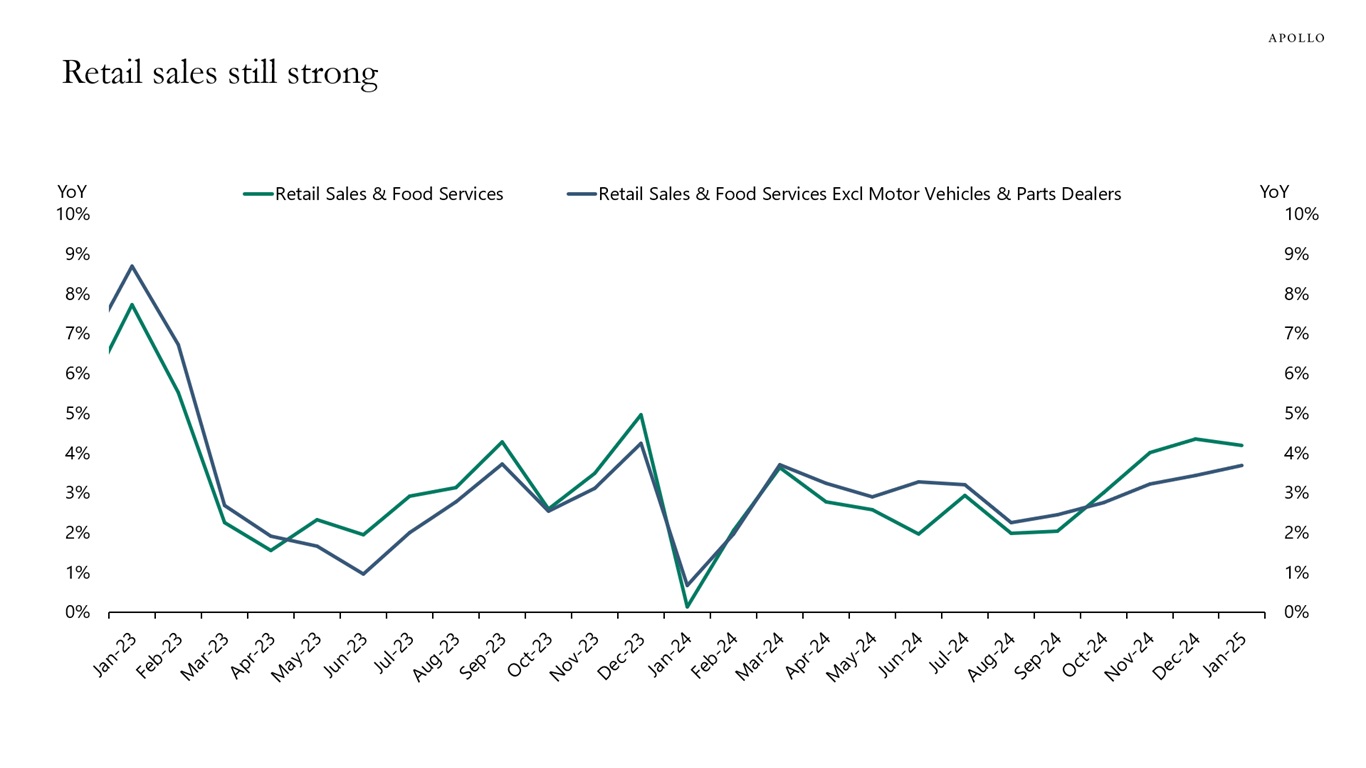
The data this week shows that the economy remains strong.
Consumers are in good shape, and year-over-year retail sales show steady growth, see the first chart below. Capex spending plans are improving, see the second chart, and the Atlanta Fed GDP estimate for first quarter GDP and the Dallas Fed weekly estimate for GDP are at 2.3% and 2.5%, respectively, see the third and fourth chart.
We are carefully monitoring trade war uncertainty, but so far, there are no signs that it is having a negative impact on the incoming data, see the fifth chart.
Source: Census Bureau, Haver Analytics, Apollo Chief Economist 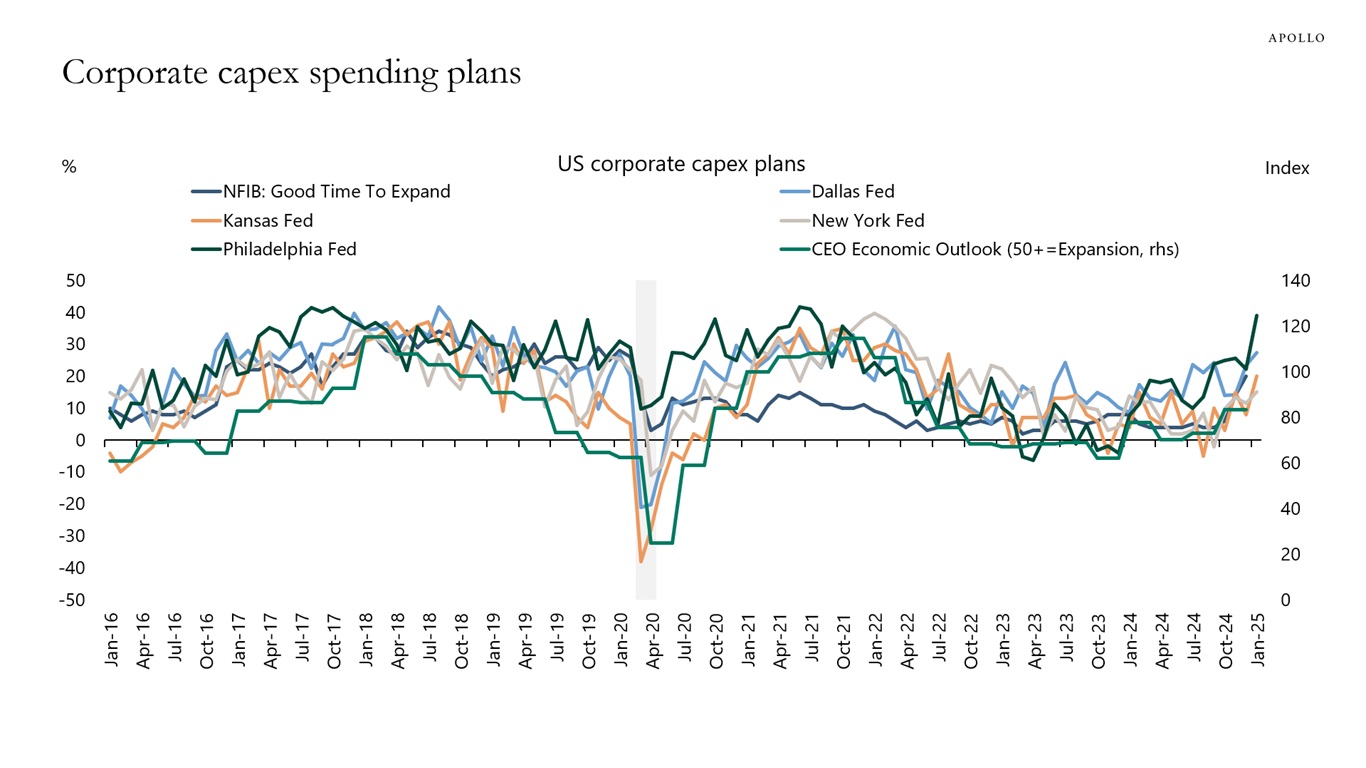
Source: Business Roundtable; NFIB; Federal Reserve Bank of Philadelphia, Dallas, New York, Kansas, and Richmond; Apollo Chief Economist 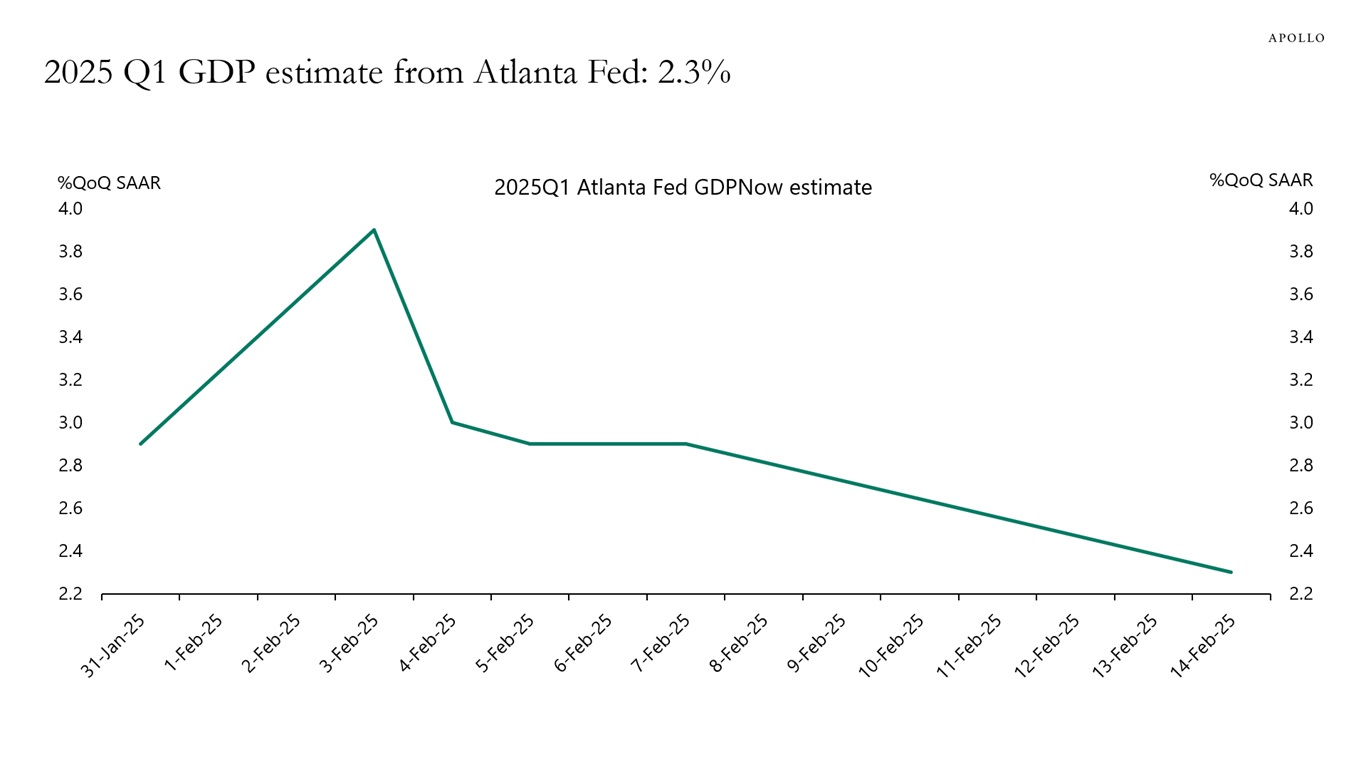
Source: Federal Reserve Bank of Atlanta, Haver Analytics, Apollo Chief Economist 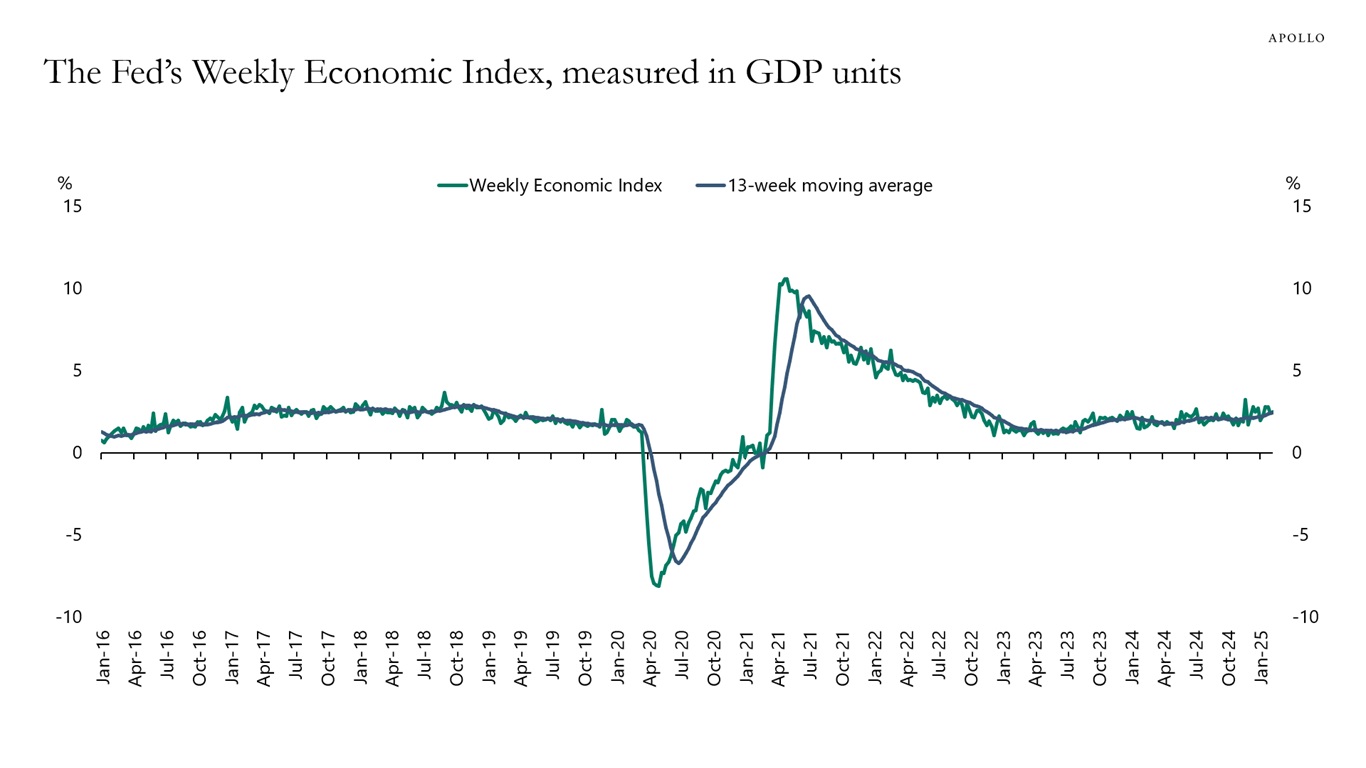
Source: Federal Reserve Bank of Dallas, Bureau of Economic Analysis, Apollo Chief Economist 
Source: PolicyUncertainty.com, Haver Analytics, Apollo Chief Economist See important disclaimers at the bottom of the page.
-
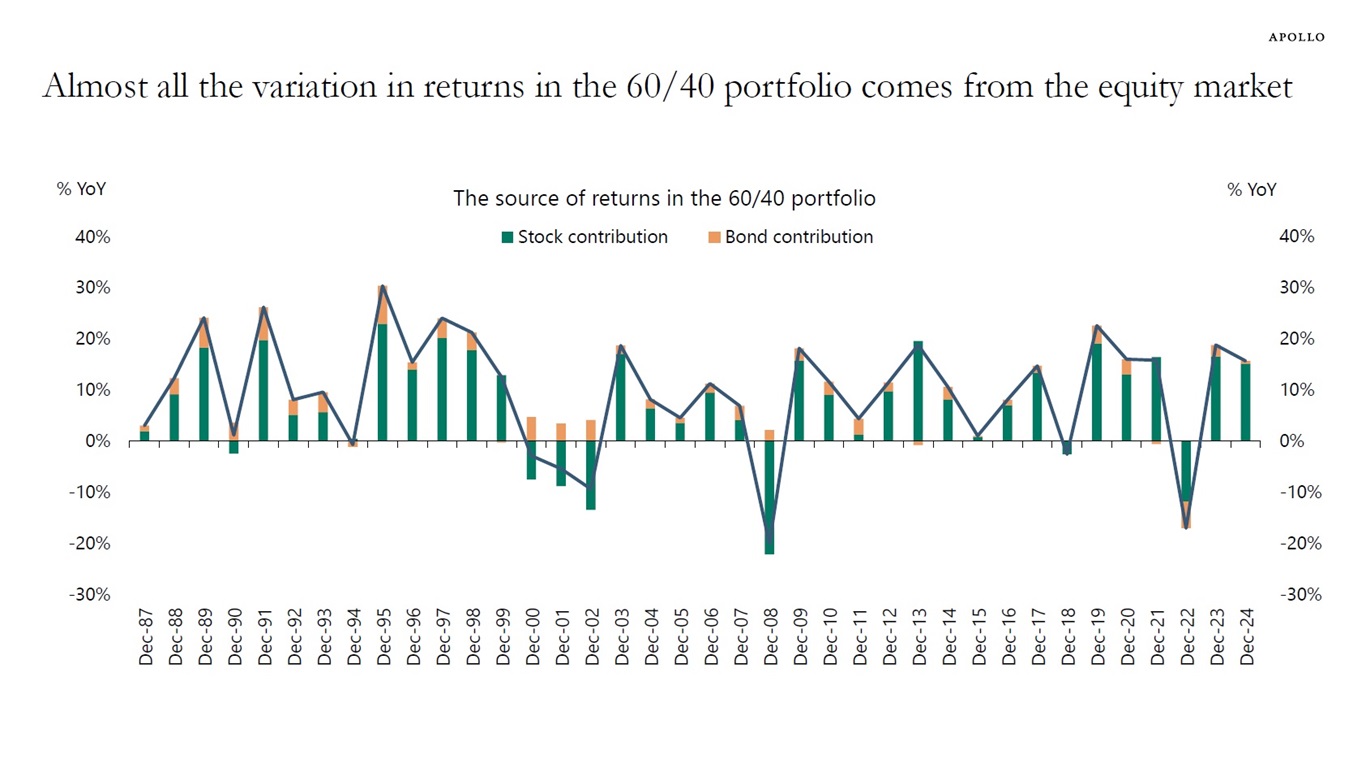
Almost all returns in the 60/40 portfolio come from the stock market, see chart below. When the stock market goes down, there are years when Treasuries are not the correct hedge against downside risks in the S&P 500, including in 2022.
Asset allocation has evolved significantly since the 60/40 portfolio was invented in the 1950s, and investors are now asking more nuanced questions about fixed income replacement and equity replacement, with a focus on less concentration in the S&P 500, lower volatility in returns, and less need for daily liquidity, see also here.
Source: Bloomberg, Apollo Chief Economist See important disclaimers at the bottom of the page.
-
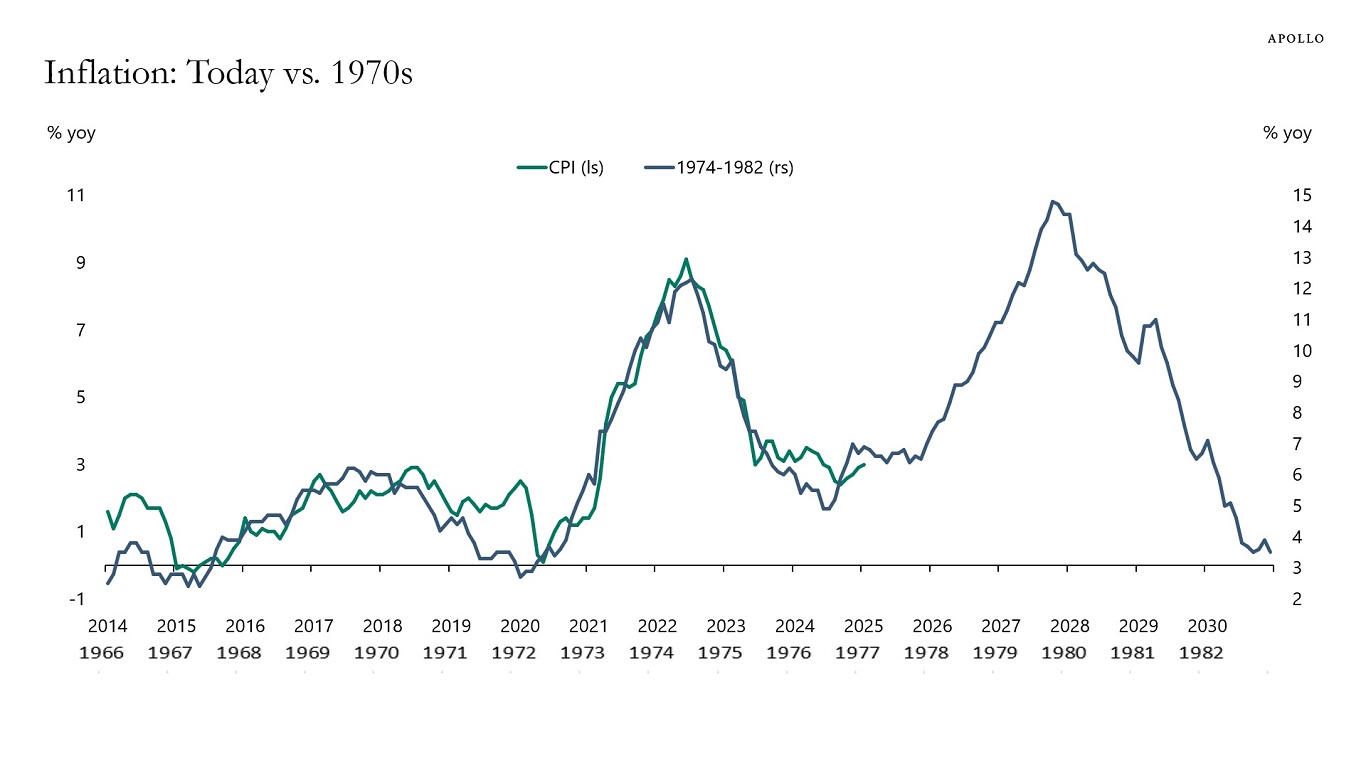
Inflation is moving higher, inflation expectations are moving higher, and breakevens are moving higher, see charts below. If the Fed cuts interest rates too early, it increases the likelihood that we will see a repeat of the 1970s. The Fed has no other options than to keep interest rates higher for longer.
Source: Bloomberg, BLS, Apollo Chief Economist 
Source: BLS, Haver Analytics, Apollo Chief Economist 
Source: BLS, Haver Analytics, Apollo Chief Economist See important disclaimers at the bottom of the page.
-
The share of equity trading volume on the exchanges is now smaller than the share of equity trading volume in dark pools, negotiated trades, and internalized trades, see chart below.
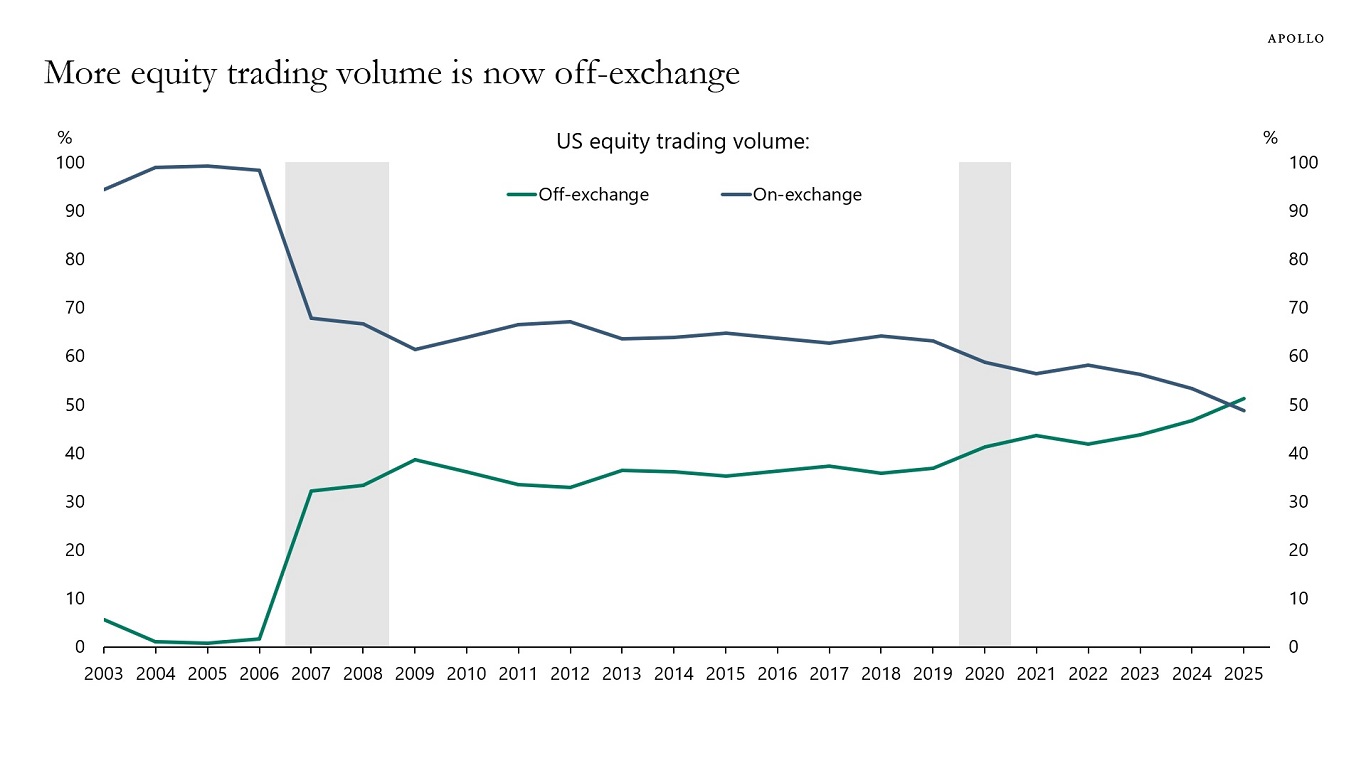
Note: Off-exchange trading activity is Trade Reporting Facility (TRF) trading volume. All trades executed otherwise than on an exchange is reported under TRF. Examples include dark pools, negotiated trades, and internalized trades. Source: Bloomberg, FINRA, Apollo Chief Economist See important disclaimers at the bottom of the page.
-
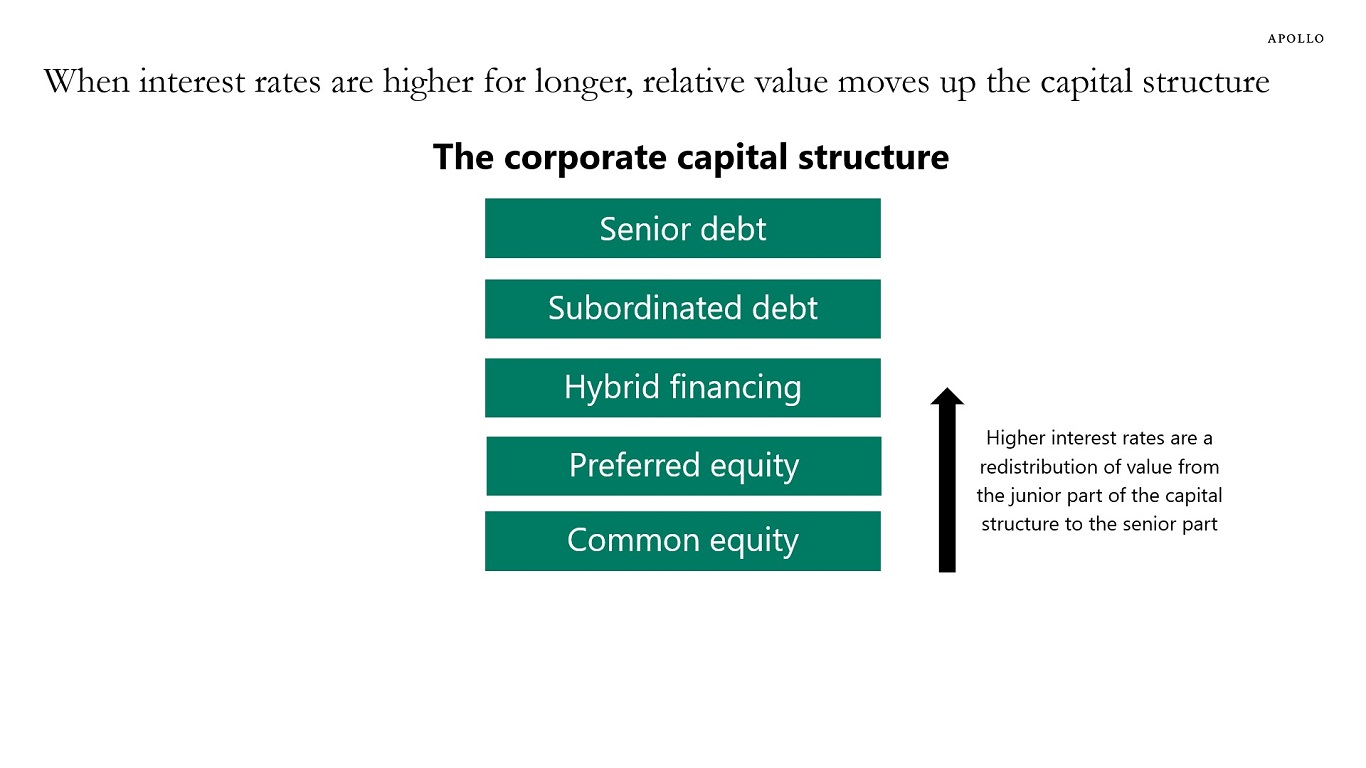
The transmission mechanism of monetary policy works through higher costs of capital that lowers demand for capex and hiring but also raises return requirements for equity to pay the debtholders in the company.
Higher interest rates are a redistribution of value from the junior parts of the capital structure to the senior parts, see chart below. Someone has to pay the higher level of interest rates in corporate capital structures, and it is not the Fed, it is the equity holder.
In short, companies with no earnings, no cash flow, and no revenue will continue to struggle simply because they cannot pay the higher debt servicing costs. In other words, when interest rates are higher for longer, companies with earnings tend to outperform because companies with earnings are able to pay higher debt servicing costs. The purpose with higher interest rates is to slow growth, which makes value more attractive than growth.
In fact, this is the entire idea from the Fed with raising interest rates—to discourage too much risk taking, such as investments in companies and capital structures with no earnings, no revenue, and no cash flow. Examples of unattractive sectors are growth, software, and venture capital.
Source: Bloomberg, Apollo Chief Economist See important disclaimers at the bottom of the page.
-
The share of US imports from China has been declining since 2016 and currently stands at 13%, see chart below.
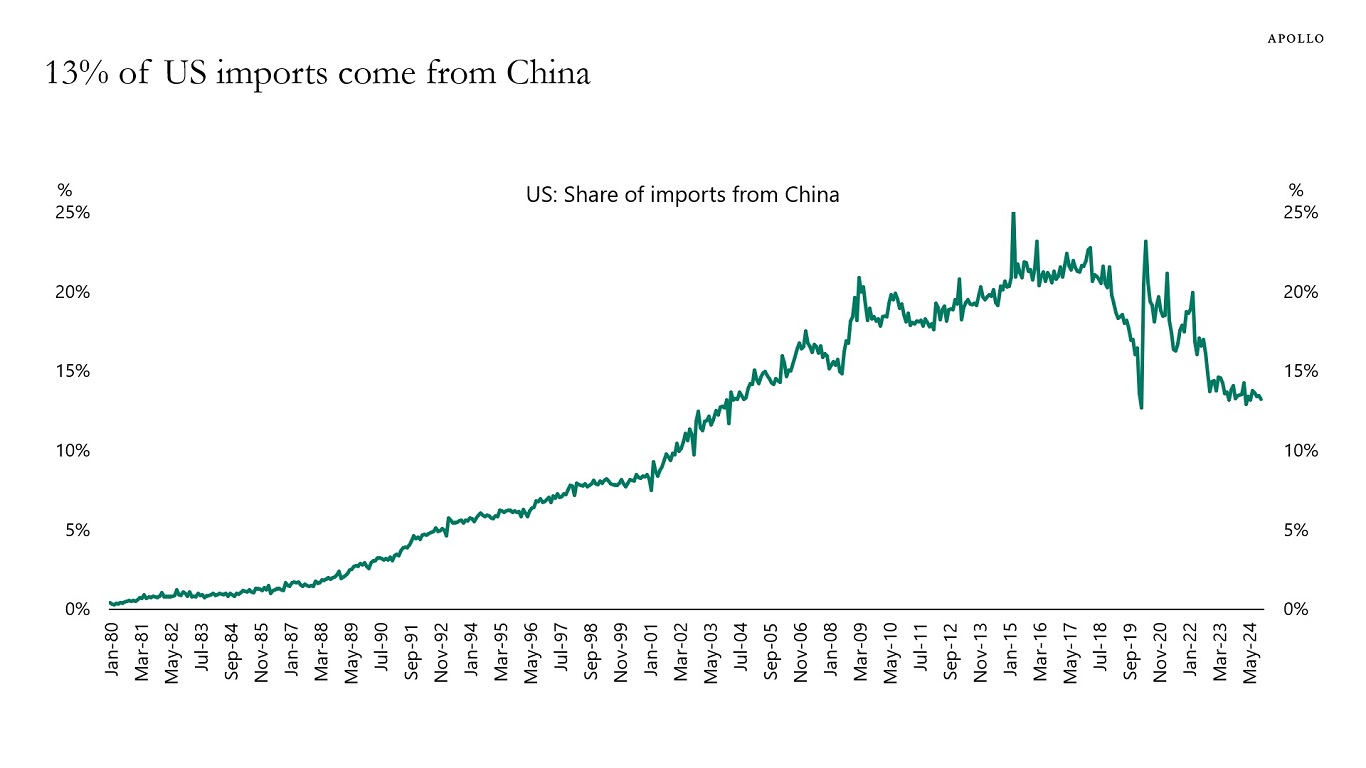
Source: Census Bureau, Haver Analytics, Apollo Chief Economist See important disclaimers at the bottom of the page.

This presentation may not be distributed, transmitted or otherwise communicated to others in whole or in part without the express consent of Apollo Global Management, Inc. (together with its subsidiaries, “Apollo”).
Apollo makes no representation or warranty, expressed or implied, with respect to the accuracy, reasonableness, or completeness of any of the statements made during this presentation, including, but not limited to, statements obtained from third parties. Opinions, estimates and projections constitute the current judgment of the speaker as of the date indicated. They do not necessarily reflect the views and opinions of Apollo and are subject to change at any time without notice. Apollo does not have any responsibility to update this presentation to account for such changes. There can be no assurance that any trends discussed during this presentation will continue.
Statements made throughout this presentation are not intended to provide, and should not be relied upon for, accounting, legal or tax advice and do not constitute an investment recommendation or investment advice. Investors should make an independent investigation of the information discussed during this presentation, including consulting their tax, legal, accounting or other advisors about such information. Apollo does not act for you and is not responsible for providing you with the protections afforded to its clients. This presentation does not constitute an offer to sell, or the solicitation of an offer to buy, any security, product or service, including interest in any investment product or fund or account managed or advised by Apollo.
Certain statements made throughout this presentation may be “forward-looking” in nature. Due to various risks and uncertainties, actual events or results may differ materially from those reflected or contemplated in such forward-looking information. As such, undue reliance should not be placed on such statements. Forward-looking statements may be identified by the use of terminology including, but not limited to, “may”, “will”, “should”, “expect”, “anticipate”, “target”, “project”, “estimate”, “intend”, “continue” or “believe” or the negatives thereof or other variations thereon or comparable terminology.