


Want it delivered daily to your inbox?
-
The consensus is now expecting a recession in Germany in 2023, see chart below.
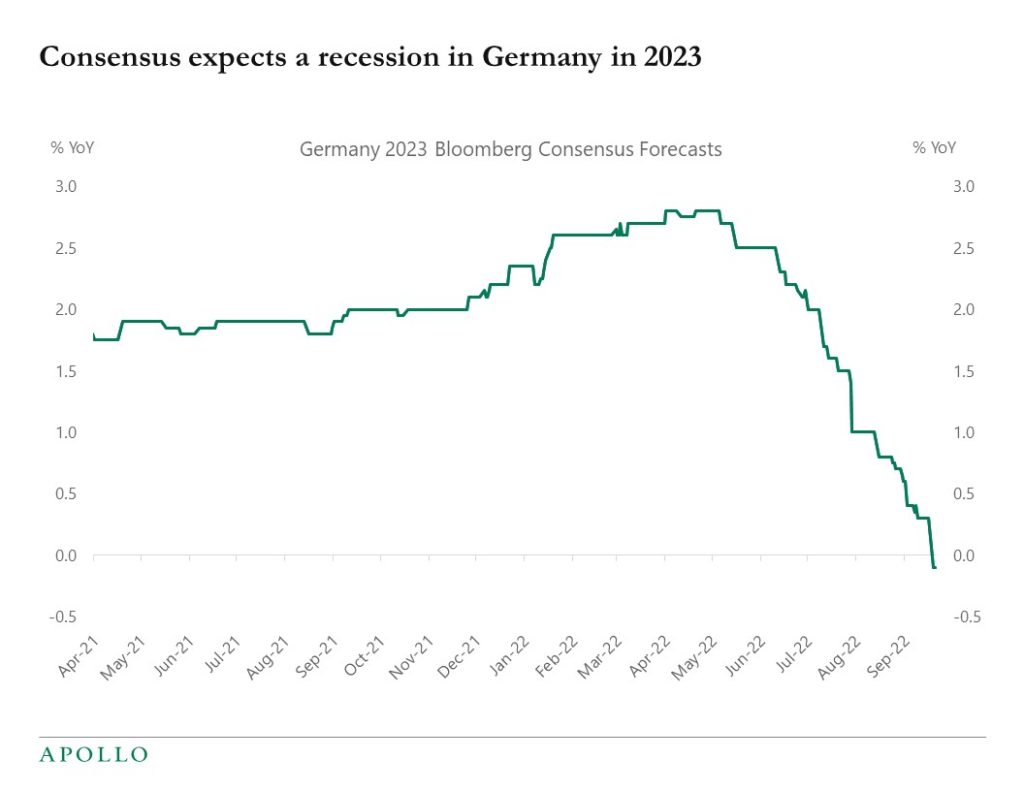
Source: Bloomberg, Apollo Chief Economist See important disclaimers at the bottom of the page.
-
Although services make up 80% of GDP, fluctuations in the goods sector are still important. Inventory levels are normalizing as a result of the supply chain improving and the goods sector of the economy slowing down, see chart below. Inventories for wholesalers are back to pre-pandemic levels, but inventories for retailers are still substantially below 2019 levels.
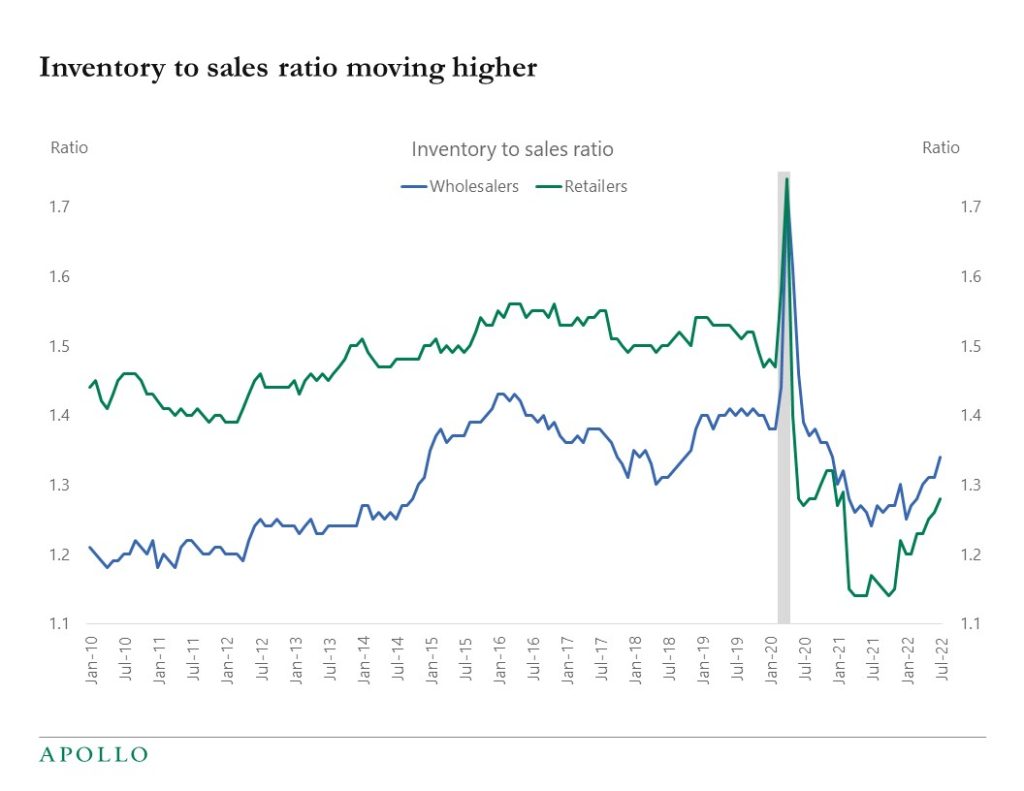
Source: Census Bureau, Haver, Apollo Chief Economist See important disclaimers at the bottom of the page.
-
Survey-based and market-based measures of inflation expectations are starting to decline, and the market believes that the Fed will get inflation down to the FOMC’s 2% target, see charts below.
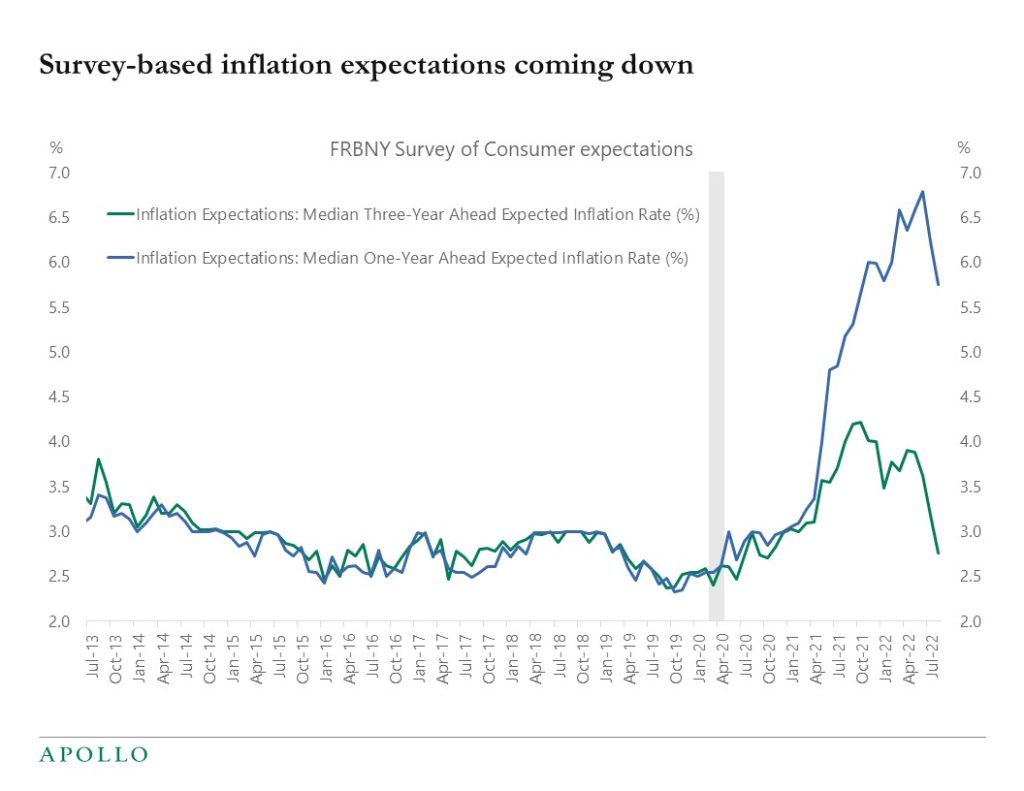
Source: FRBNY, Haver, Apollo Chief Economist 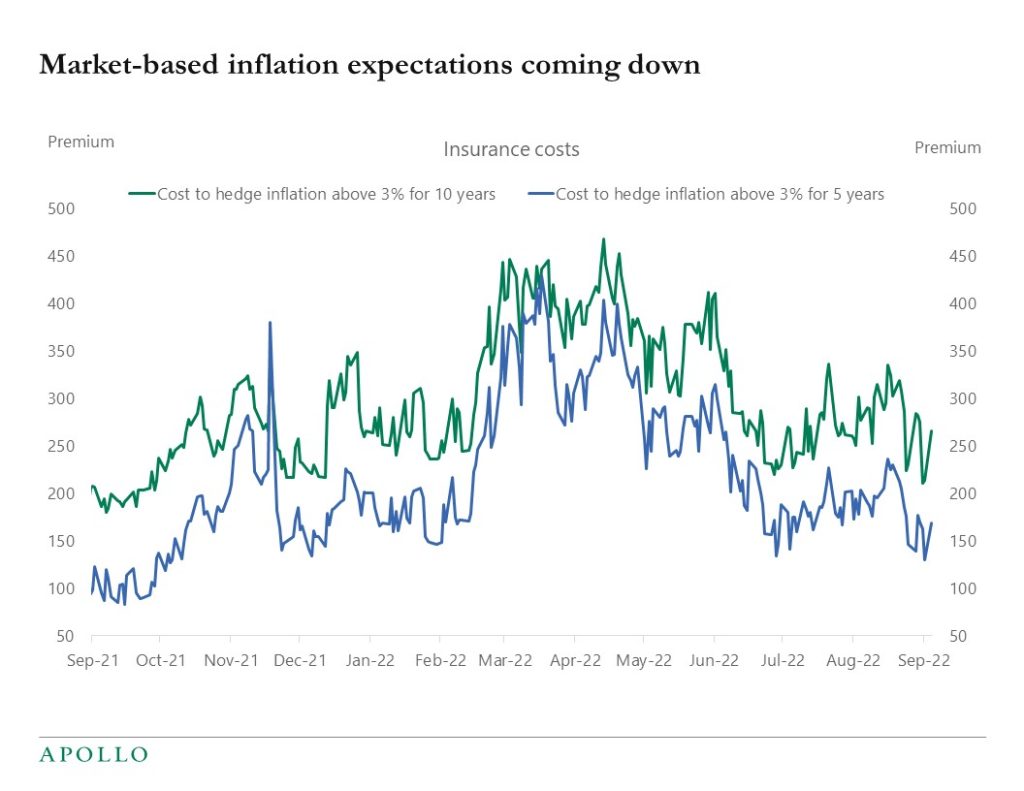
Source: Bloomberg, Apollo Chief Economist See important disclaimers at the bottom of the page.
-
With rates rising and the dollar going up, foreign private investors are buying US Treasuries at a record pace, see chart below.
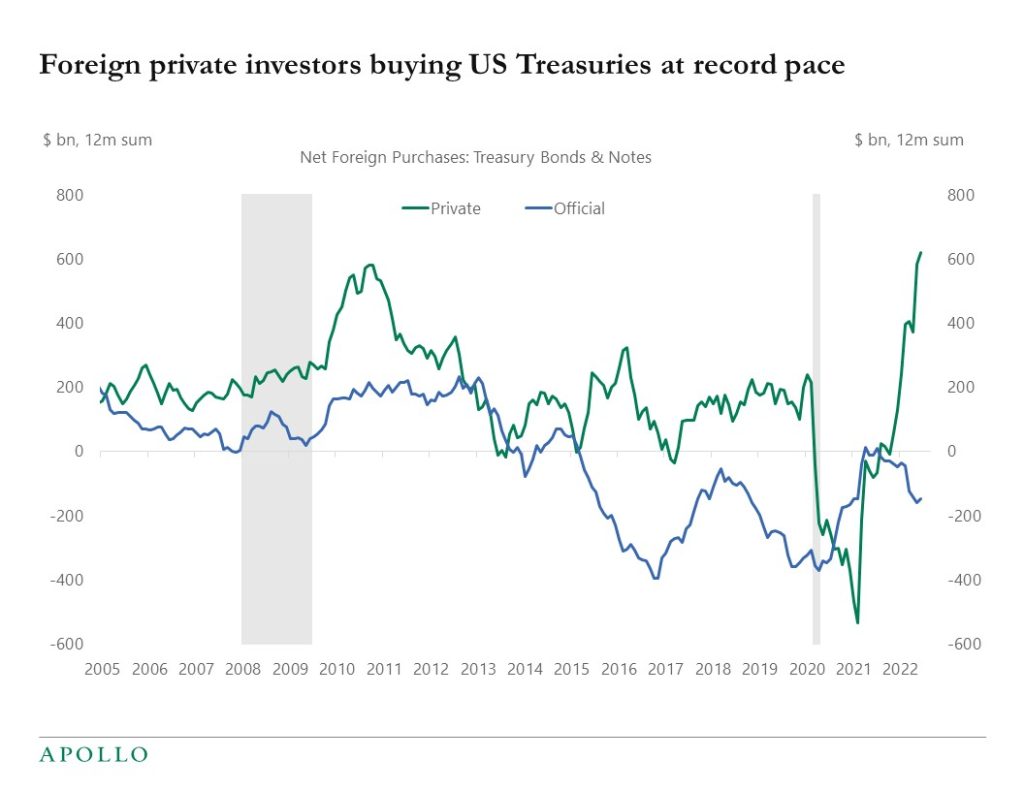
Source: Bloomberg, Apollo Chief Economist See important disclaimers at the bottom of the page.
-
The consensus now sees a 50% probability of a recession in the US and 60% chance of a recession in Europe and the UK, see chart below. Investors should be positioned accordingly.
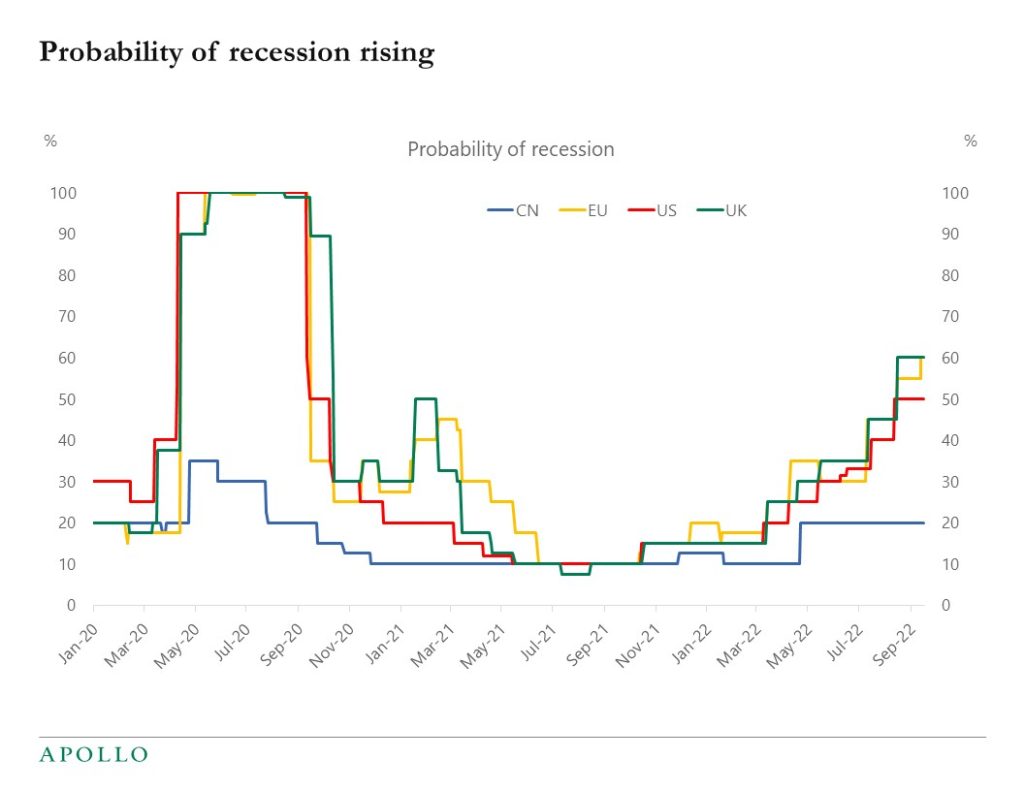
Source: Bloomberg, Apollo Chief Economist See important disclaimers at the bottom of the page.
-
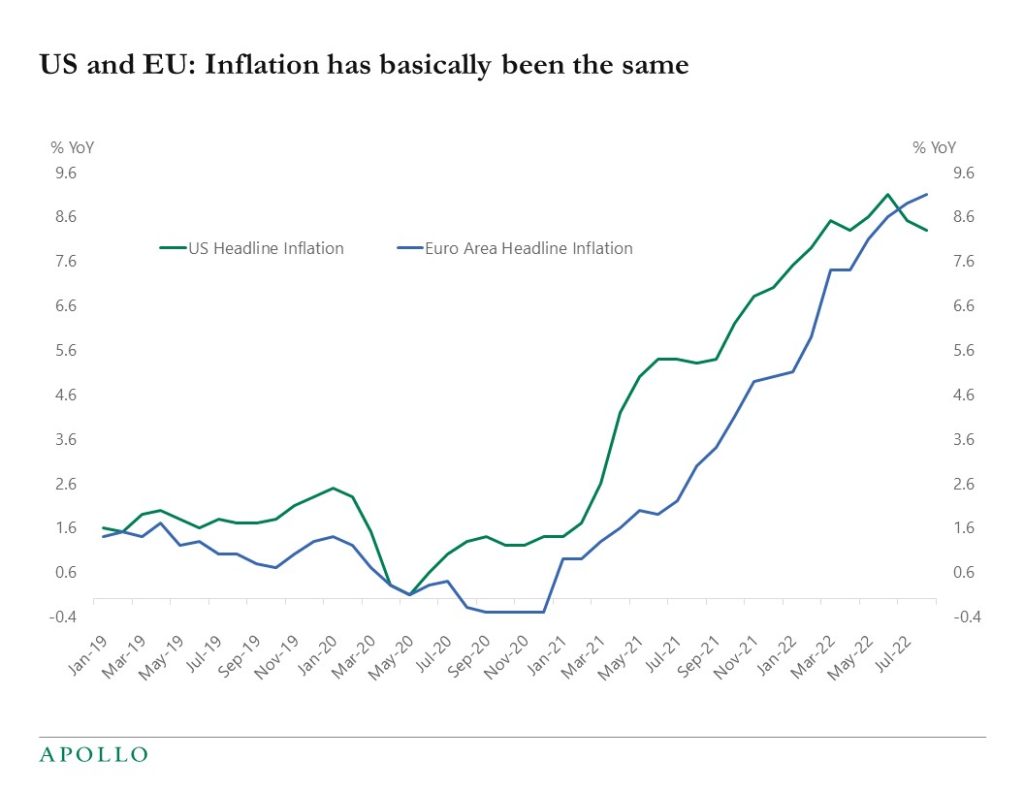
US and European inflation for the past two years has been almost identical despite the fiscal response to covid being double the size in the US relative to Europe, see charts below.
With a much more aggressive fiscal response in the US, both headline and core inflation should have been much higher in the US today than in Europe.
The identical path of inflation in the US and Europe strongly suggests that inflation is not driven by demand but instead by supply problems associated with covid. Some of these supply problems for goods will get resolved quickly as supply chain problems ease. But other supply problems in the labor market will take some longer time.
The implication for markets is that the Fed and the ECB may not need to do much demand destruction to get inflation down.
This topic is also debated in several Fed working papers at the moment, see here and here.
Source: Bloomberg, Apollo Chief Economist 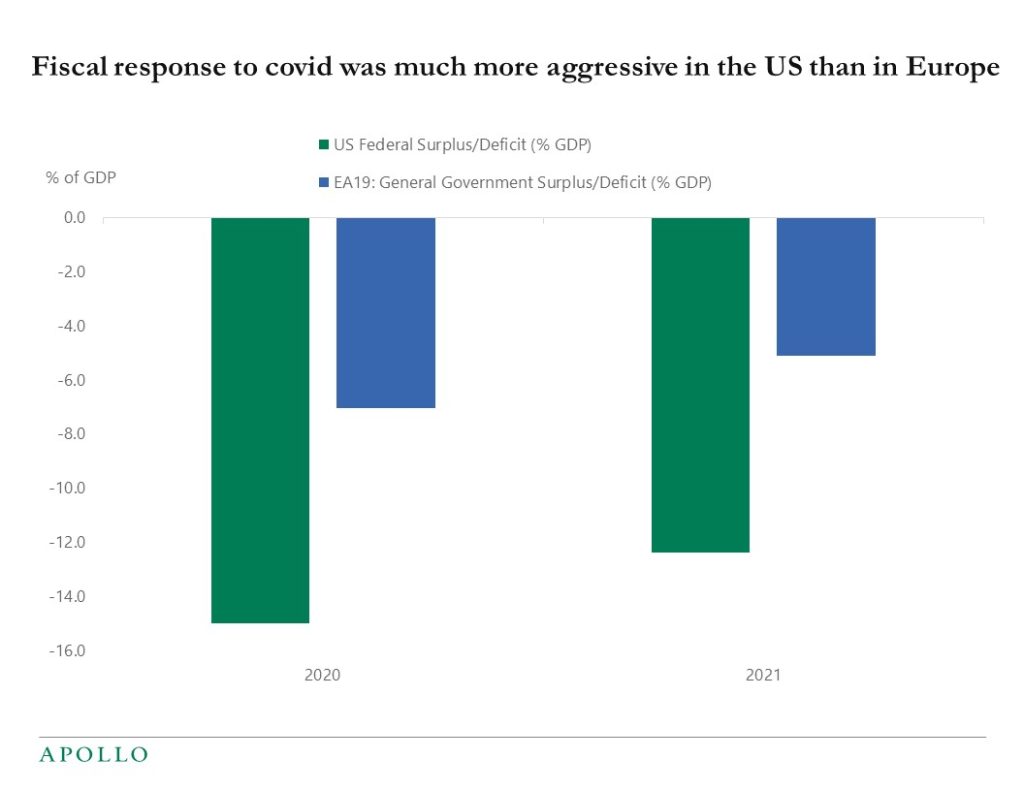
Source: OMB, ECB, Haver Analytics, Apollo Chief Economist See important disclaimers at the bottom of the page.
-
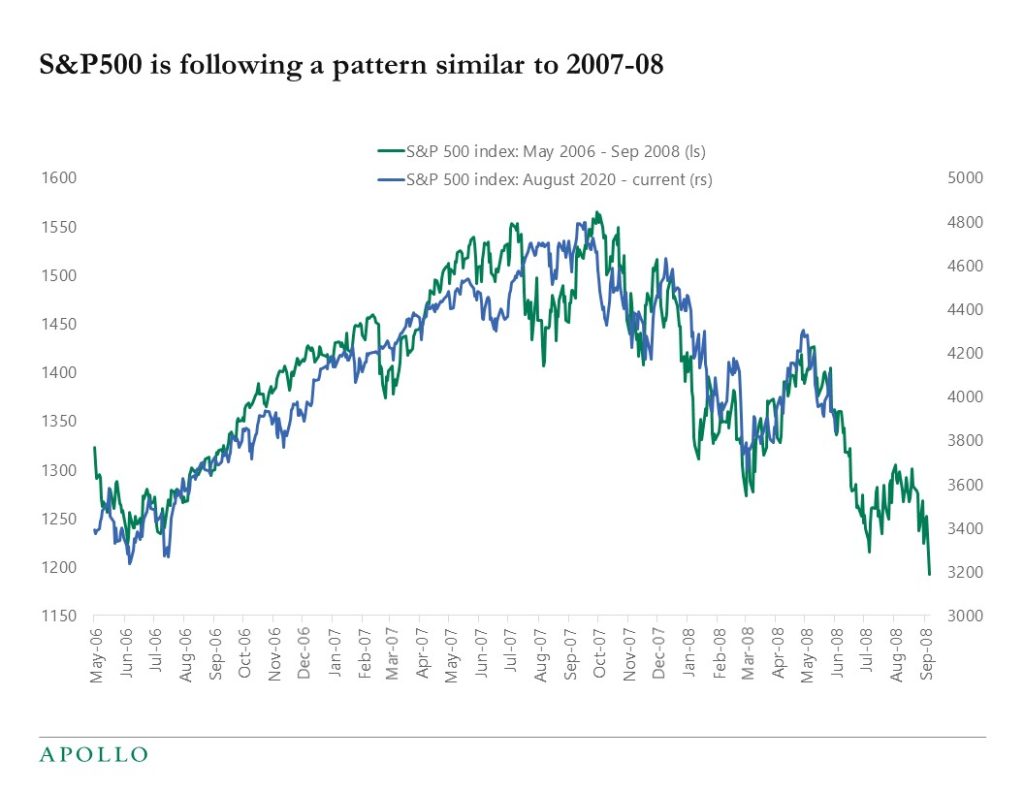
There is a striking similarity between how the S&P500 has traded during this period of high inflation and the pattern we saw during the financial crisis in 2007-2008, see chart below. Maybe one conclusion is that when investors are faced with extreme levels of uncertainty, the behavioral response in financial markets over time is relatively similar. Markets think the problems are over and want to go higher but as more data comes in, then realize that the shock is still here and the downside risks are still substantial. Our latest Slowdown Watch is available here.
Source: Bloomberg, Apollo Chief Economist See important disclaimers at the bottom of the page.
-
The share of renters is higher in Germany and France than in the US, and the share of households with a mortgage is higher in the US than in most other OECD countries, see chart below.
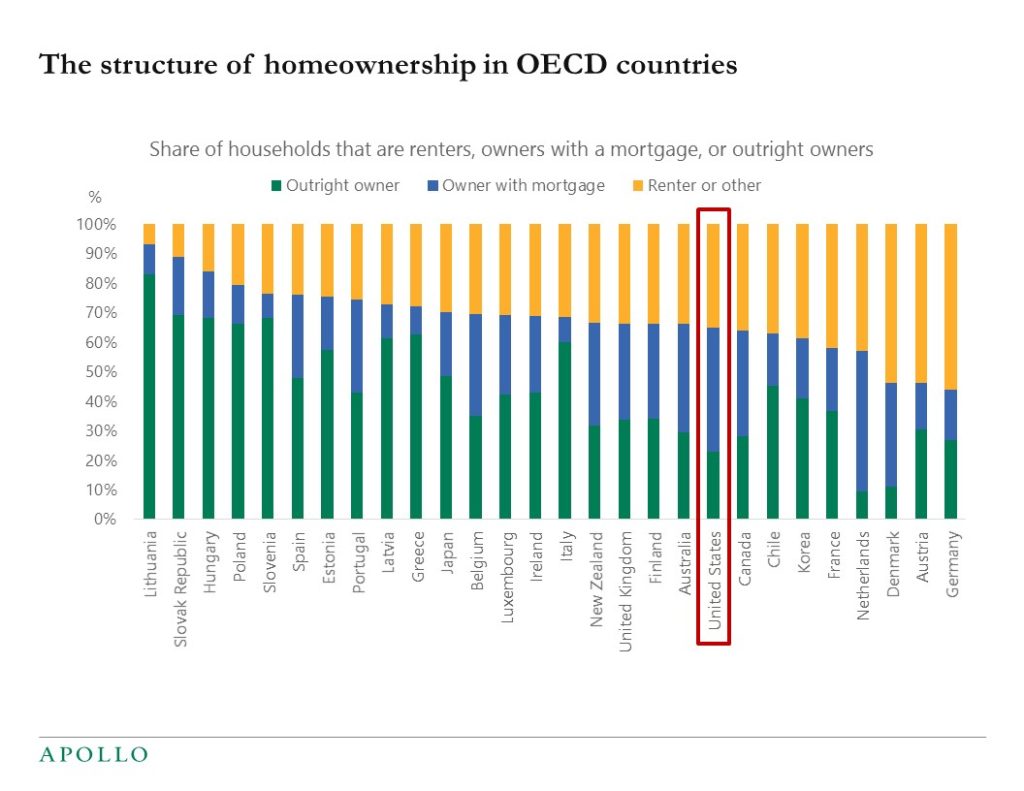
Source: OECD, Apollo Chief Economist. Note: Data for 2019 or latest year available See important disclaimers at the bottom of the page.
-
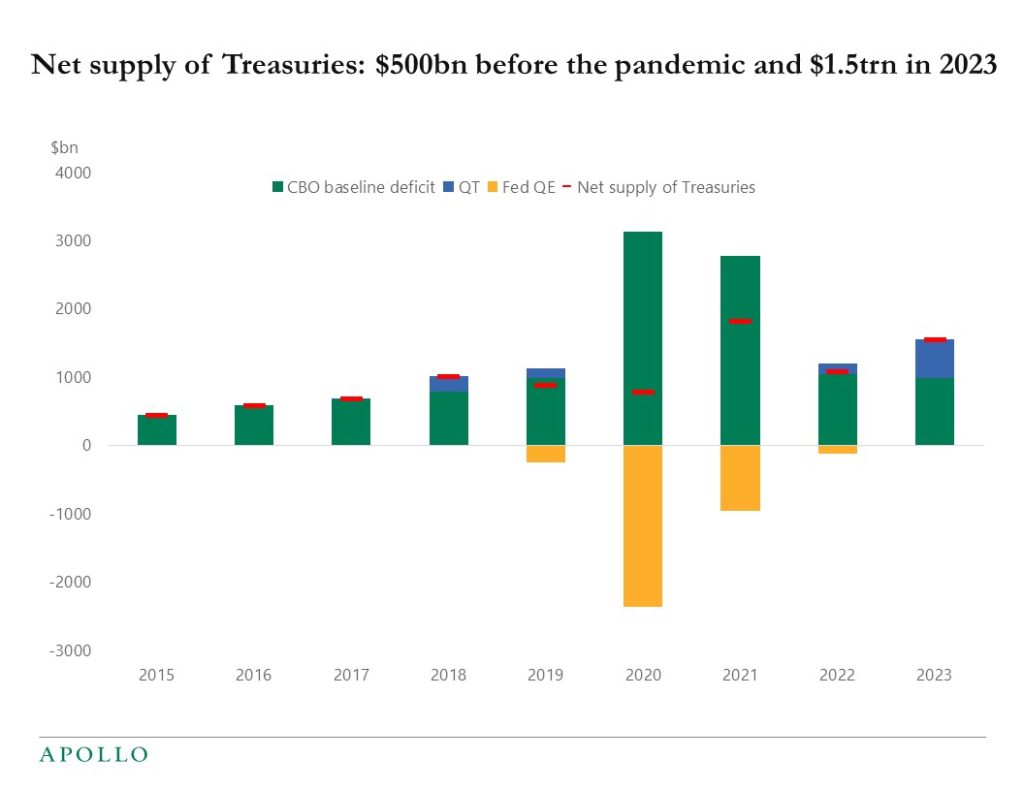
The annual net supply of Treasuries before the pandemic was $500bn. In 2023 it will be $1.5trn, with $1trn coming from the budget deficit and $500bn coming from Fed QT, see chart below.
This increasing supply of Treasuries is at risk of crowding out demand for other types of fixed income, including IG, HY, loans, and mortgages, in particular as the level of the risk-free rate continues to increase.
The upward pressure on rates because of the higher net supply of Treasuries is in addition to the upward pressure on rates coming from higher inflation.
The bottom line is that there is upside risk to rates not only from inflation but also from the growing supply of Treasuries, and the growing supply of Treasuries trading at higher rates could lower demand for other fixed income assets.
Source: CBO, FRB, Haver Analytics, Apollo Chief Economist. Note: QT is SOMA redemptions with cap assumed $60 bn per month in 2023 See important disclaimers at the bottom of the page.
-
The US releases about 1mn barrels of oil daily from the Strategic Petroleum Reserve, and the SPR inventory is now at levels last seen in 1984, see charts below.
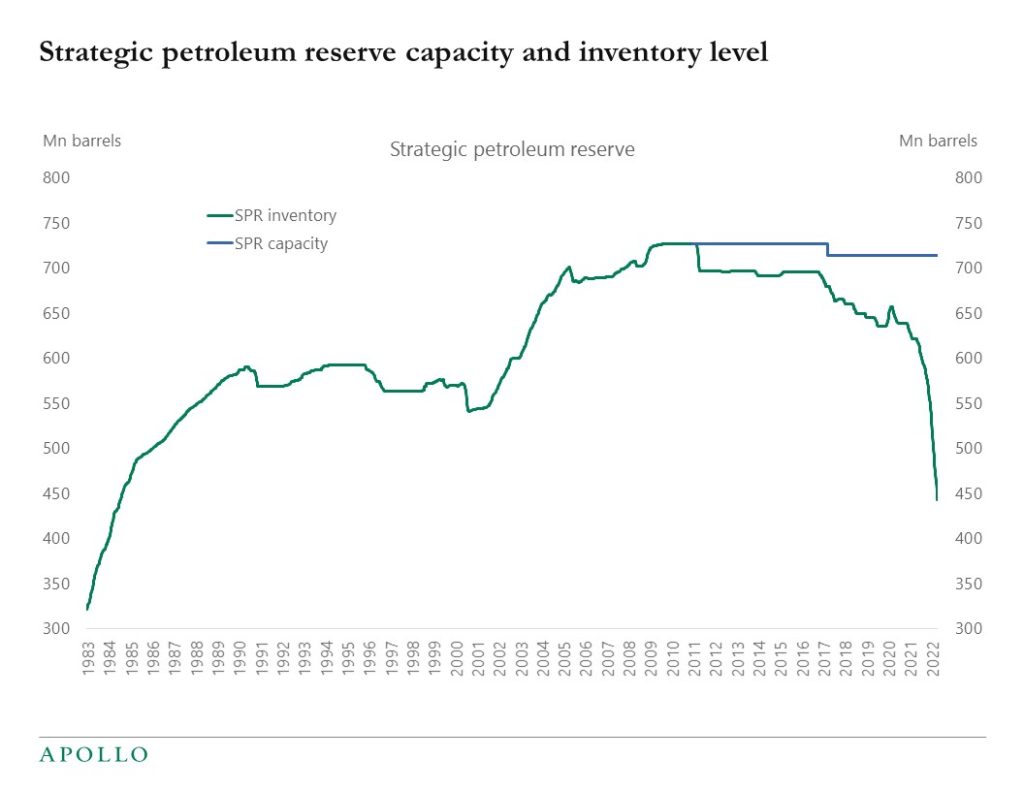
Source: DOE, Bloomberg, Apollo Chief Economist 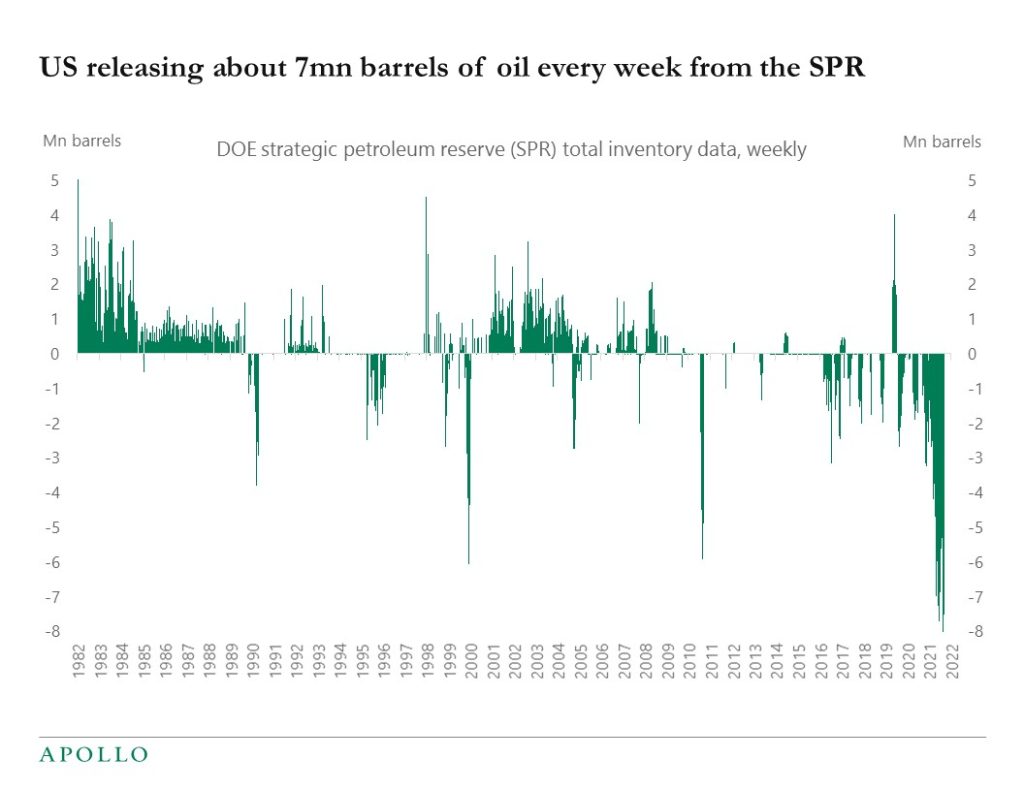
Source: DOE, Bloomberg, Apollo Chief Economist See important disclaimers at the bottom of the page.

This presentation may not be distributed, transmitted or otherwise communicated to others in whole or in part without the express consent of Apollo Global Management, Inc. (together with its subsidiaries, “Apollo”).
Apollo makes no representation or warranty, expressed or implied, with respect to the accuracy, reasonableness, or completeness of any of the statements made during this presentation, including, but not limited to, statements obtained from third parties. Opinions, estimates and projections constitute the current judgment of the speaker as of the date indicated. They do not necessarily reflect the views and opinions of Apollo and are subject to change at any time without notice. Apollo does not have any responsibility to update this presentation to account for such changes. There can be no assurance that any trends discussed during this presentation will continue.
Statements made throughout this presentation are not intended to provide, and should not be relied upon for, accounting, legal or tax advice and do not constitute an investment recommendation or investment advice. Investors should make an independent investigation of the information discussed during this presentation, including consulting their tax, legal, accounting or other advisors about such information. Apollo does not act for you and is not responsible for providing you with the protections afforded to its clients. This presentation does not constitute an offer to sell, or the solicitation of an offer to buy, any security, product or service, including interest in any investment product or fund or account managed or advised by Apollo.
Certain statements made throughout this presentation may be “forward-looking” in nature. Due to various risks and uncertainties, actual events or results may differ materially from those reflected or contemplated in such forward-looking information. As such, undue reliance should not be placed on such statements. Forward-looking statements may be identified by the use of terminology including, but not limited to, “may”, “will”, “should”, “expect”, “anticipate”, “target”, “project”, “estimate”, “intend”, “continue” or “believe” or the negatives thereof or other variations thereon or comparable terminology.