


Want it delivered daily to your inbox?
-
Why did used car prices go up 50% during the pandemic, was it because of more demand for vehicles, or was it because of supply chain problems with semiconductors? The answer to this question will determine where the Fed funds rate will peak during this cycle.
Specifically, identifying the sources of the increase in inflation is essential for understanding how quickly inflation will return to the Fed’s 2% target. A recent Fed working paper suggested that only 1/3 of the inflation increase during the pandemic was due to demand. If that is the case, the Fed today will not need to destroy much demand, and inflation will automatically come down to 2% again.
With supply chains improving every day and growth slowing, the trend in inflation should be lower. If supply problems mainly drove the run-up in inflation, then inflation could come back to 2% faster than the market currently thinks. In that case, a soft landing is likely, and equities and credit should be trading higher.
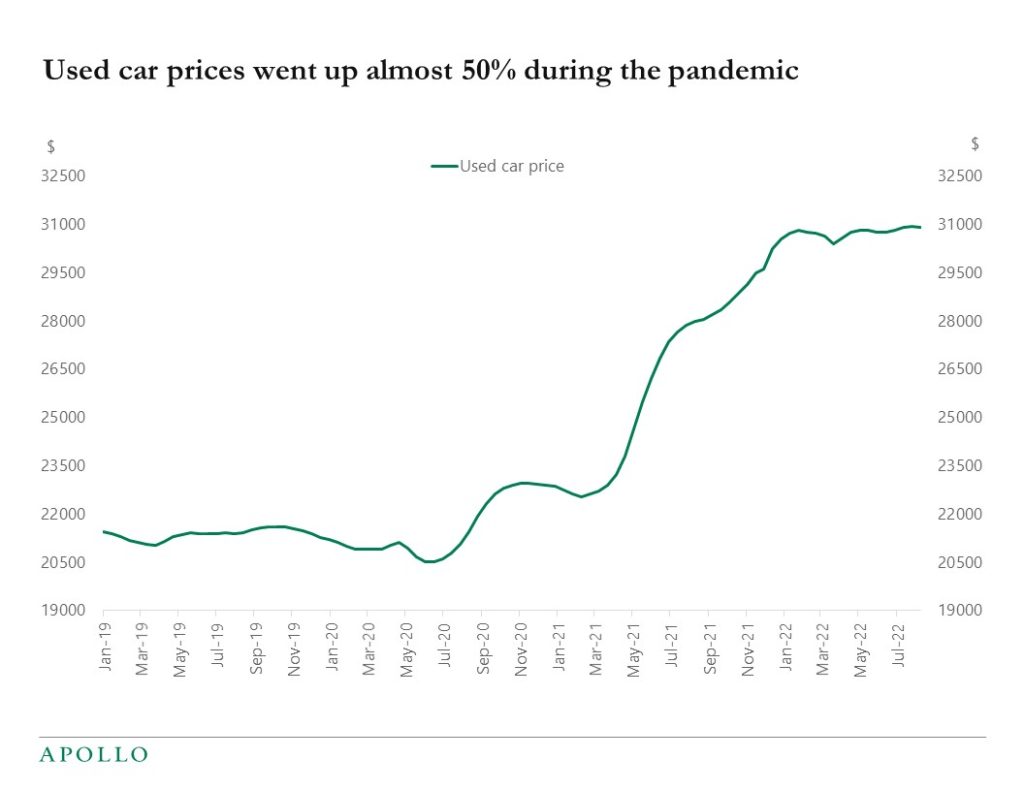
Source: Cargurus.com, Apollo Chief Economist See important disclaimers at the bottom of the page.
-
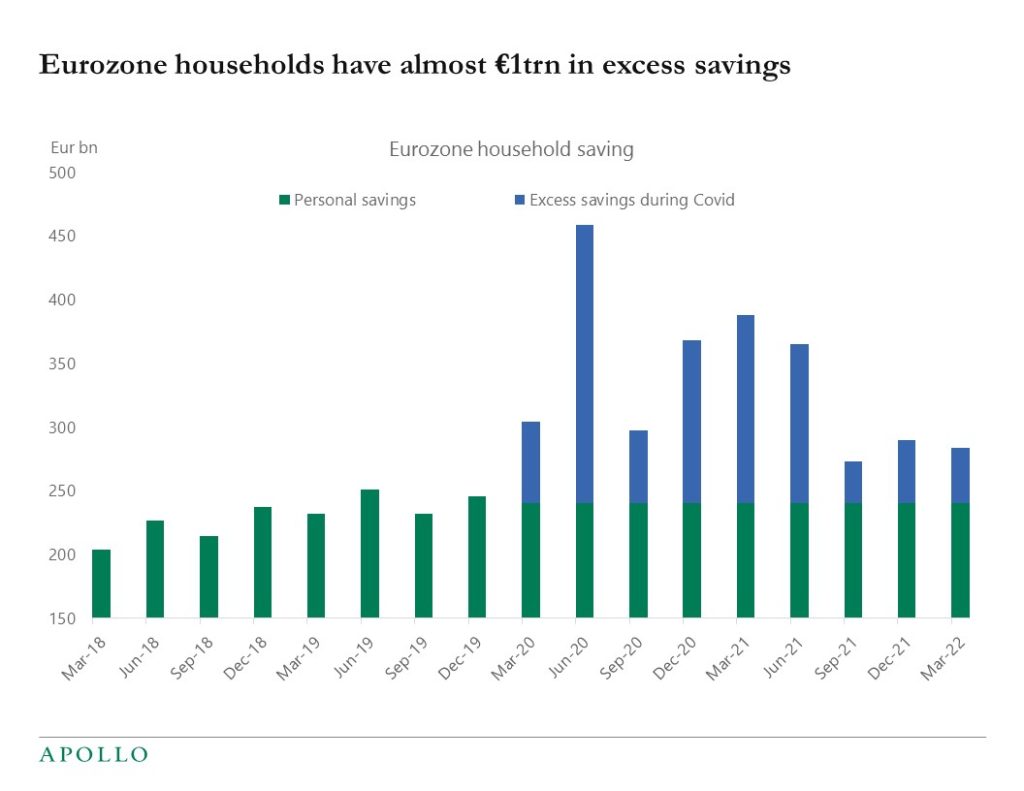
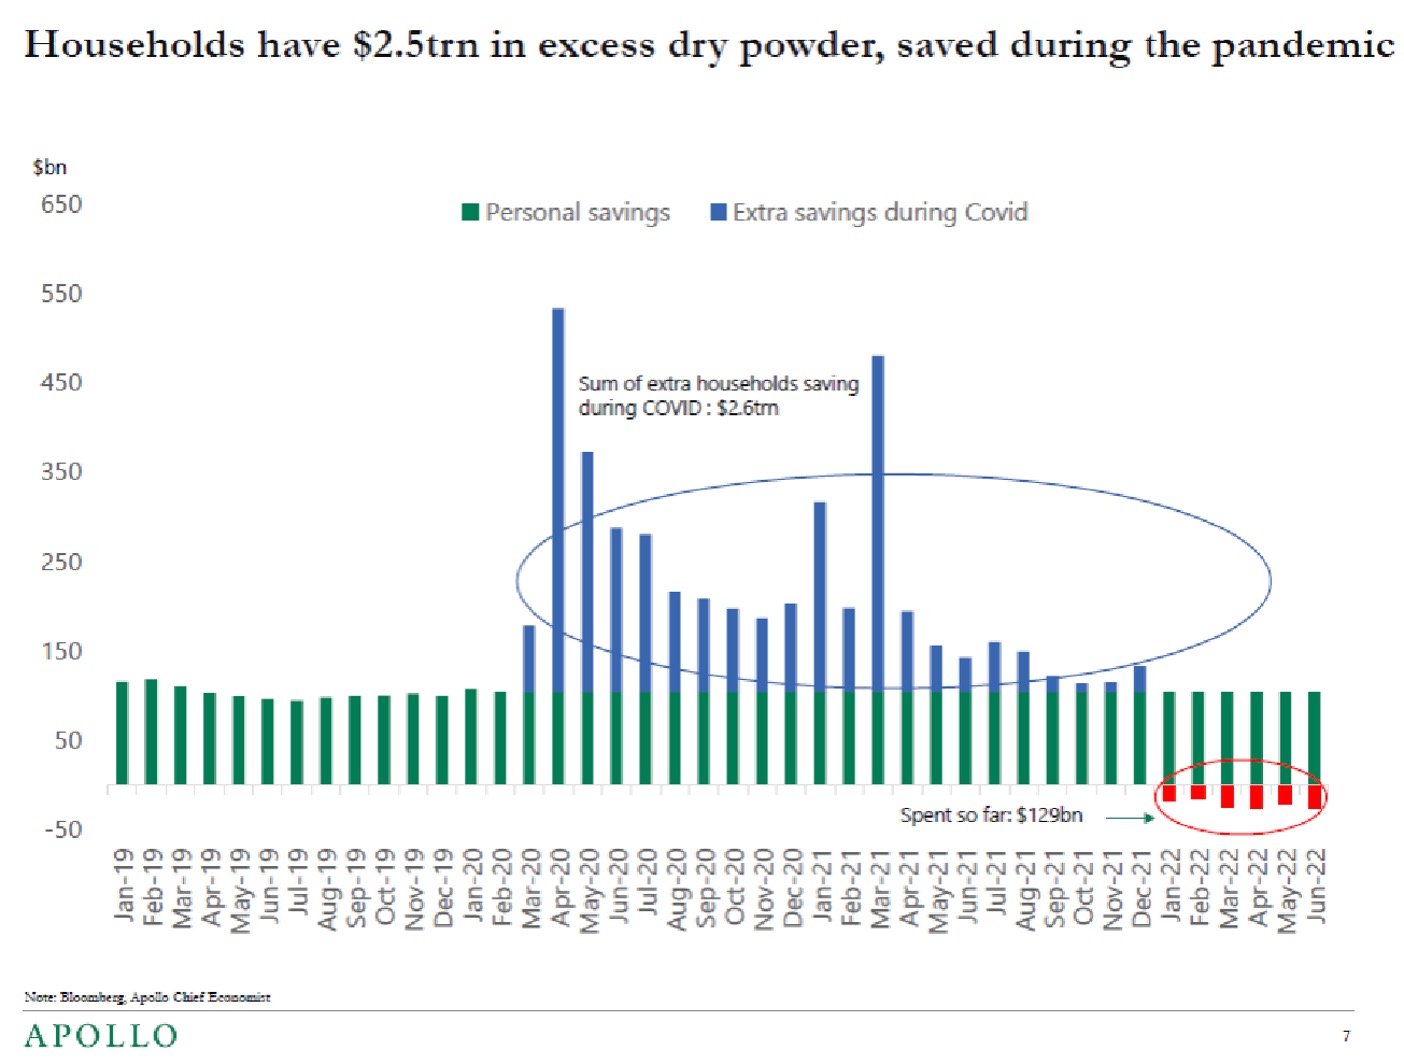
A high level of savings in the household sector during covid can also be seen in the Eurozone and in the UK, see charts below. This is a tailwind for the outlook for consumer spending across Europe. The headwinds to European private consumption include slowing growth, sanctions, and higher inflation, including higher energy prices.
Source: Bloomberg, Apollo Chief Economist 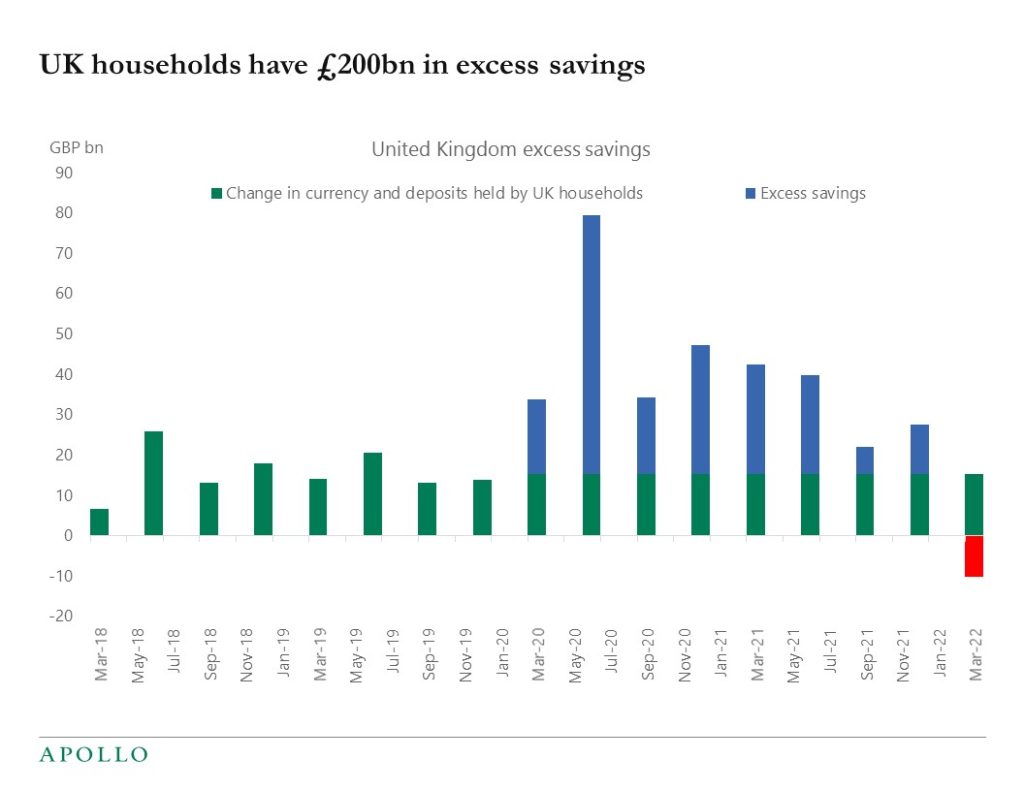
Source: Bloomberg, Apollo Chief Economist See important disclaimers at the bottom of the page.
-
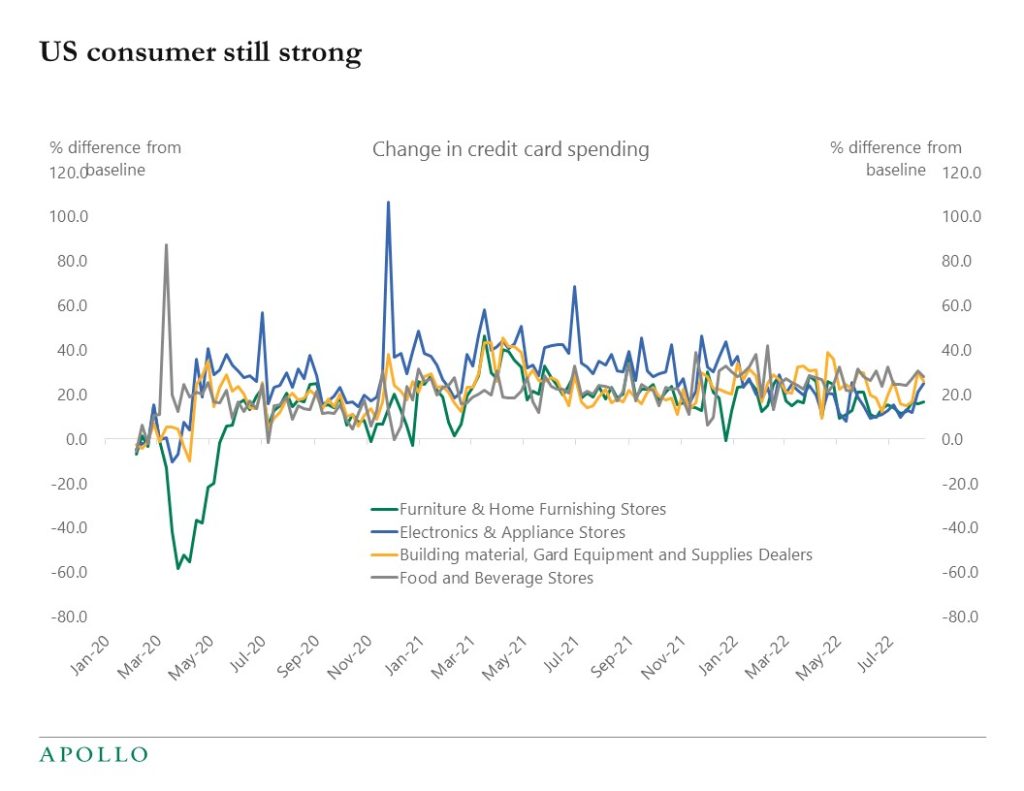
Weekly data for credit card spending shows no signs of a slowdown across all spending categories, see charts below. The implication is that the Fed needs to raise rates more to cool down the economy. Our weekly chart book with high-frequency indicators for the US economy is available here.
Source: BEA, Haver analytics, Apollo Chief Economist. Note: The weekly values represent the predicted percentage difference from the typical level of spending (prior to the pandemic declared by the World Health Organization on March 11, 2020) after adjusting for day-of-week, month, and year effects, based on daily data. The typical level corresponds to a value of zero. 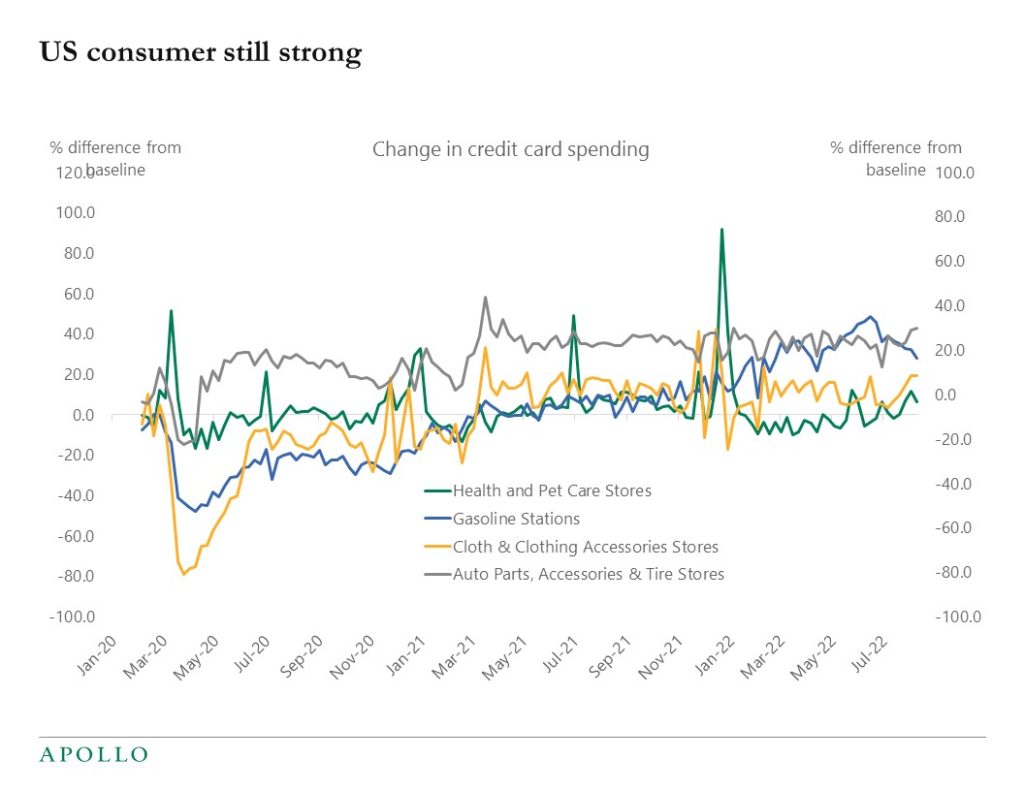
Source: BEA, Haver analytics, Apollo Chief Economist. Note: The weekly values represent the predicted percentage difference from the typical level of spending (prior to the pandemic declared by the World Health Organization on March 11, 2020) after adjusting for day-of-week, month, and year effects, based on daily data. The typical level corresponds to a value of zero. 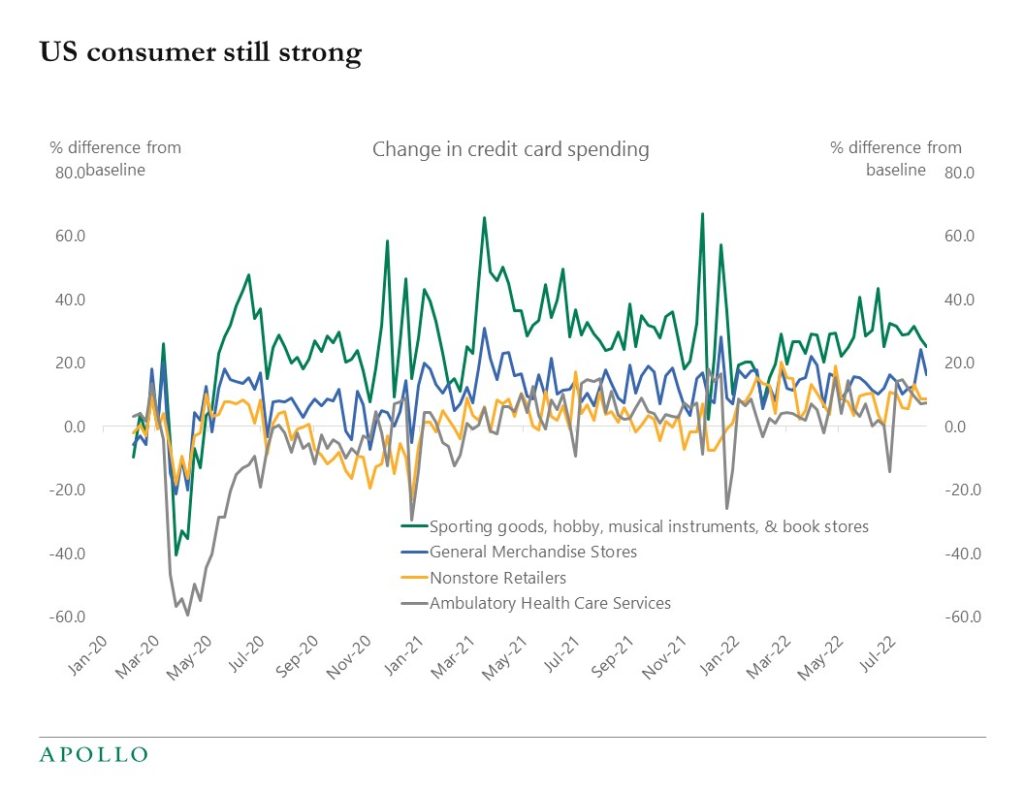
Source: BEA, Haver analytics, Apollo Chief Economist. Note: The weekly values represent the predicted percentage difference from the typical level of spending (prior to the pandemic declared by the World Health Organization on March 11, 2020) after adjusting for day-of-week, month, and year effects, based on daily data. The typical level corresponds to a value of zero. 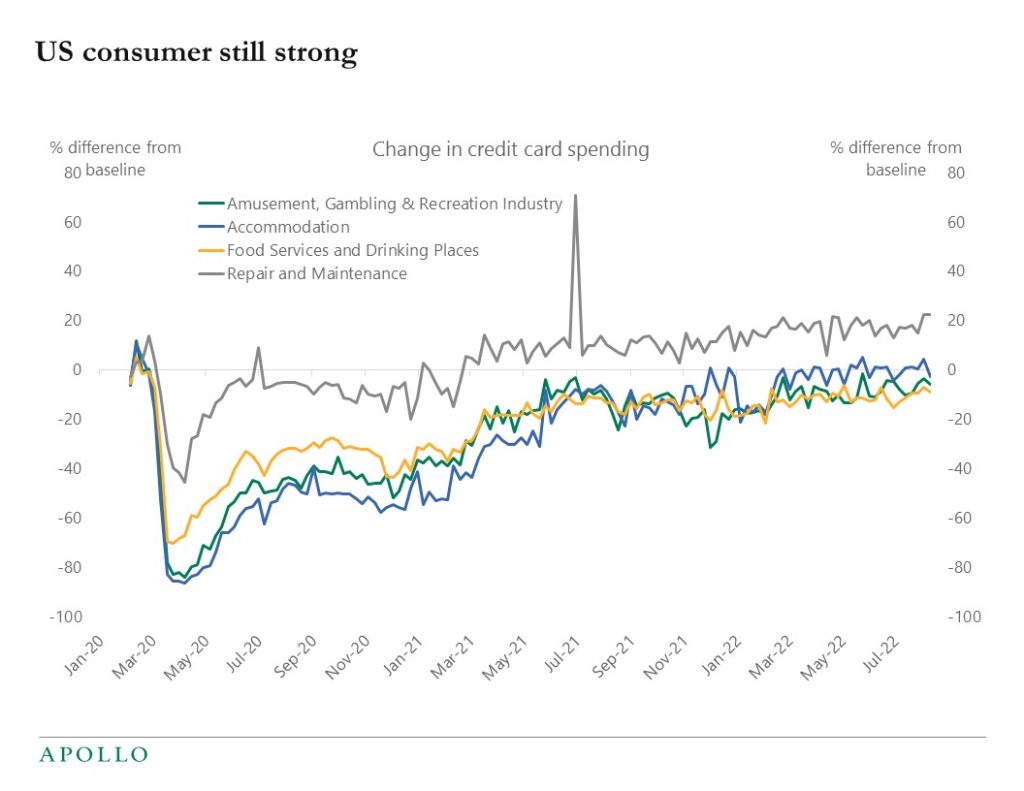
Source: BEA, Haver analytics, Apollo Chief Economist. Note: The weekly values represent the predicted percentage difference from the typical level of spending (prior to the pandemic declared by the World Health Organization on March 11, 2020) after adjusting for day-of-week, month, and year effects, based on daily data. The typical level corresponds to a value of zero. See important disclaimers at the bottom of the page.
-
During the recent rally in credit, the HY index has outperformed the IG index even on a duration-adjusted basis, and there are some good reasons why HY is less sensitive than previously to the coming economic slowdown, including higher average rating quality of the index and a record-high share of secured bonds in the HY index.
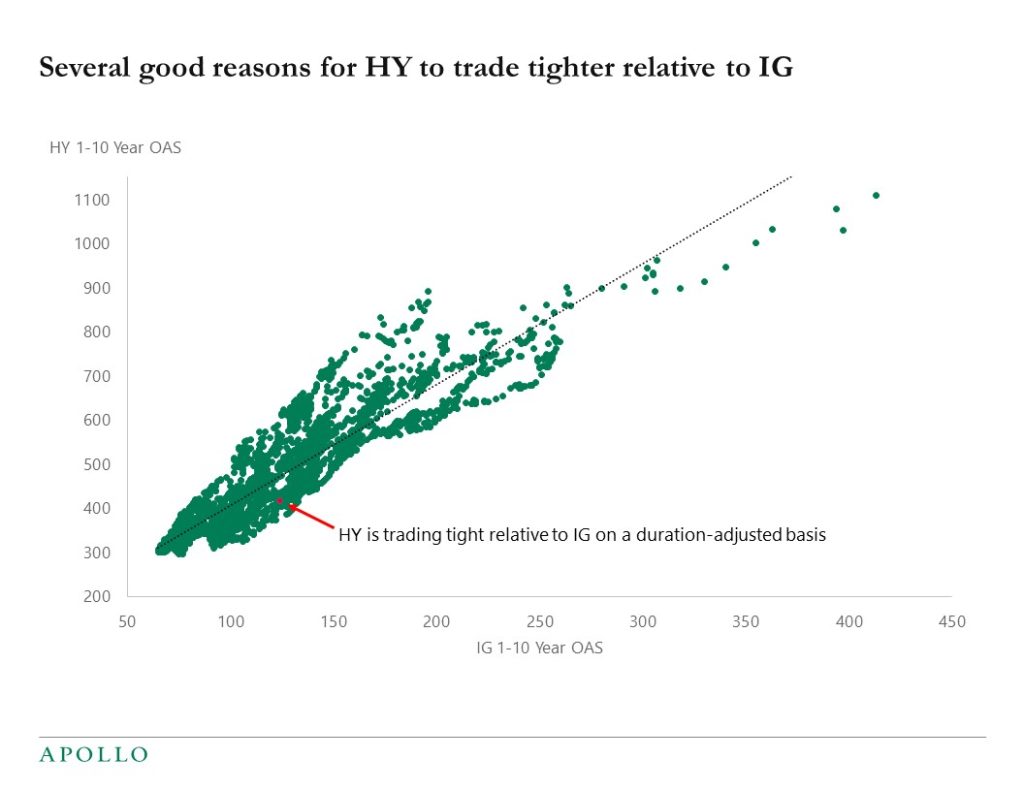
Source: Bloomberg, ICE BofA, Apollo Chief Economist. Note: Red dot indicates data as of 18 August 2022 See important disclaimers at the bottom of the page.
-
Housing has a weight of 40% in the core CPI index, and leading indicators of rent inflation are showing signs of rolling over, but the leading indicators in the charts below suggest that it may take some time before housing inflation returns to or below pre-pandemic levels. The implication for markets is that it is not enough that inflation has peaked. We also need to see key components of the CPI, such as housing, return to pre-pandemic levels of inflation, which is required to get headline inflation back to 2%.
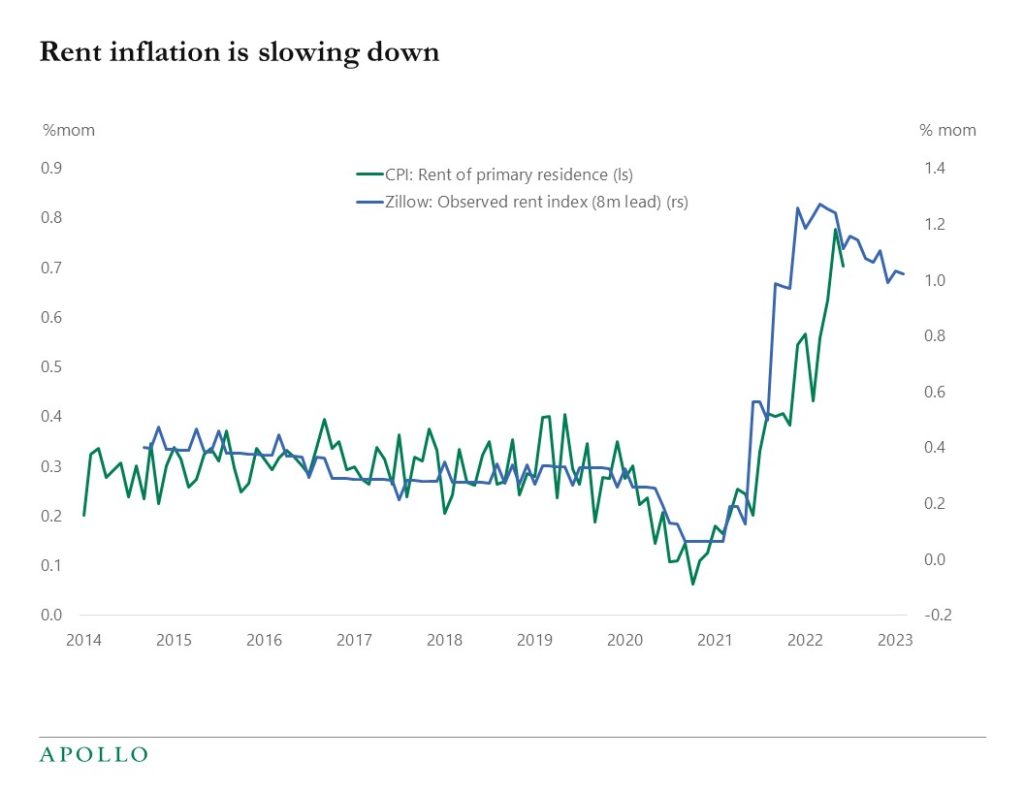
Source: Bloomberg, Haver, Apollo Chief Economist 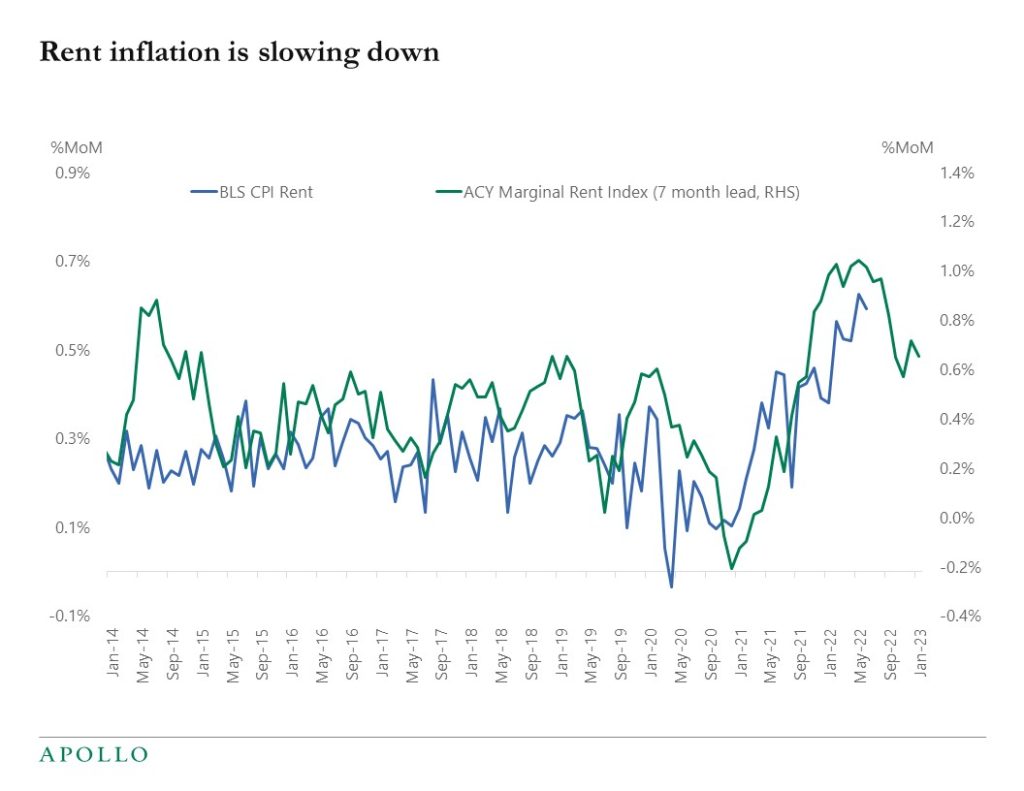
Source: BLS, Penn State, Apollo Chief Economist See important disclaimers at the bottom of the page.
-
Inflation today is 8.5%, and the consensus expects inflation at the end of this year at 7.3%. Inflation may have peaked, but these numbers are all unacceptably high for the Fed.
The implication for markets is that the Fed will not turn dovish anytime soon. The Fed’s inflation target is 2%, and the FOMC will continue to raise interest rates and keep them elevated until there are clear signs inflation is coming down to 2% even if this requires a slowing in corporate earnings growth.
The bottom line is that it is too early to declare victory over inflation, and we don’t know yet how much Fed tightening and lower earnings growth are going to be needed to get inflation all the way down to 2% again.
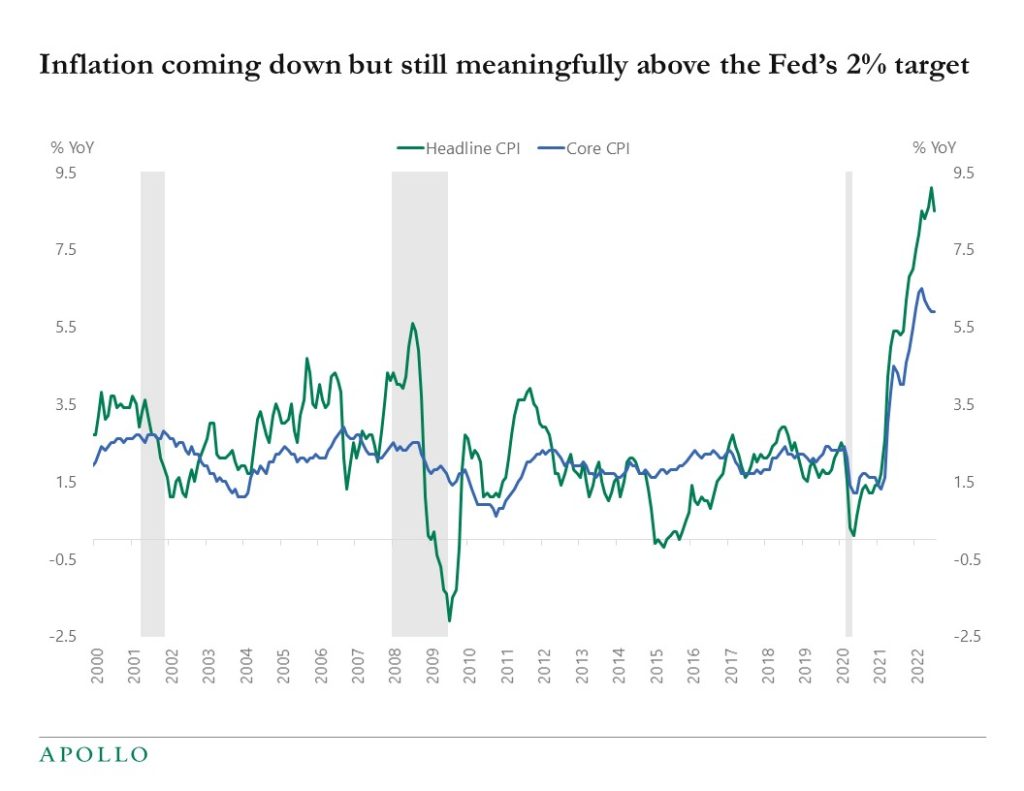
Source: BLS, Haver Analytics, Apollo Chief Economist See important disclaimers at the bottom of the page.
-
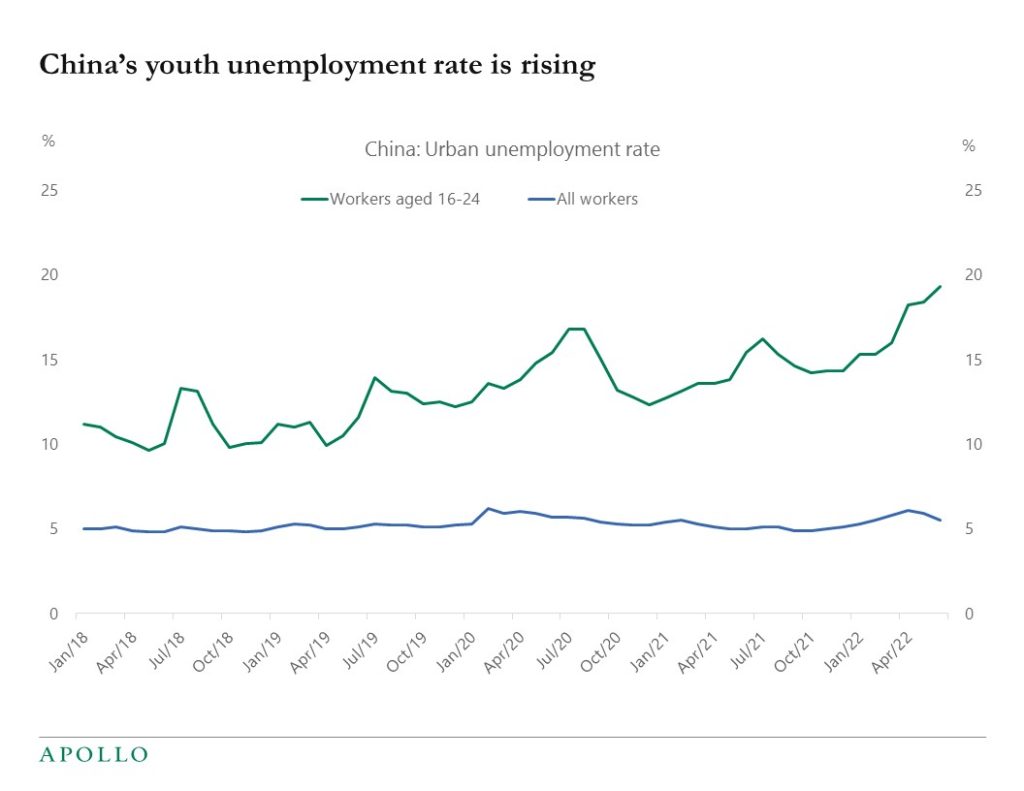
The youth unemployment rate in China has increased from 15% to 20% over the past year, and once the economy reopens after covid, many of these jobs will be coming back, see chart below.
Source: NBS, Bloomberg, Apollo Chief Economist See important disclaimers at the bottom of the page.
-
With cash in checking accounts being less sensitive to interest rates, the bottom line is that it will require many more Fed hikes to cool down the economy because consumer spending is driven not only by borrowing but also by the amount of liquid cash households hold in bank accounts. In other words, it is going to take some time before overall consumer spending starts to meaningfully slow down.
Note: Bloomberg, Apollo Chief Economist 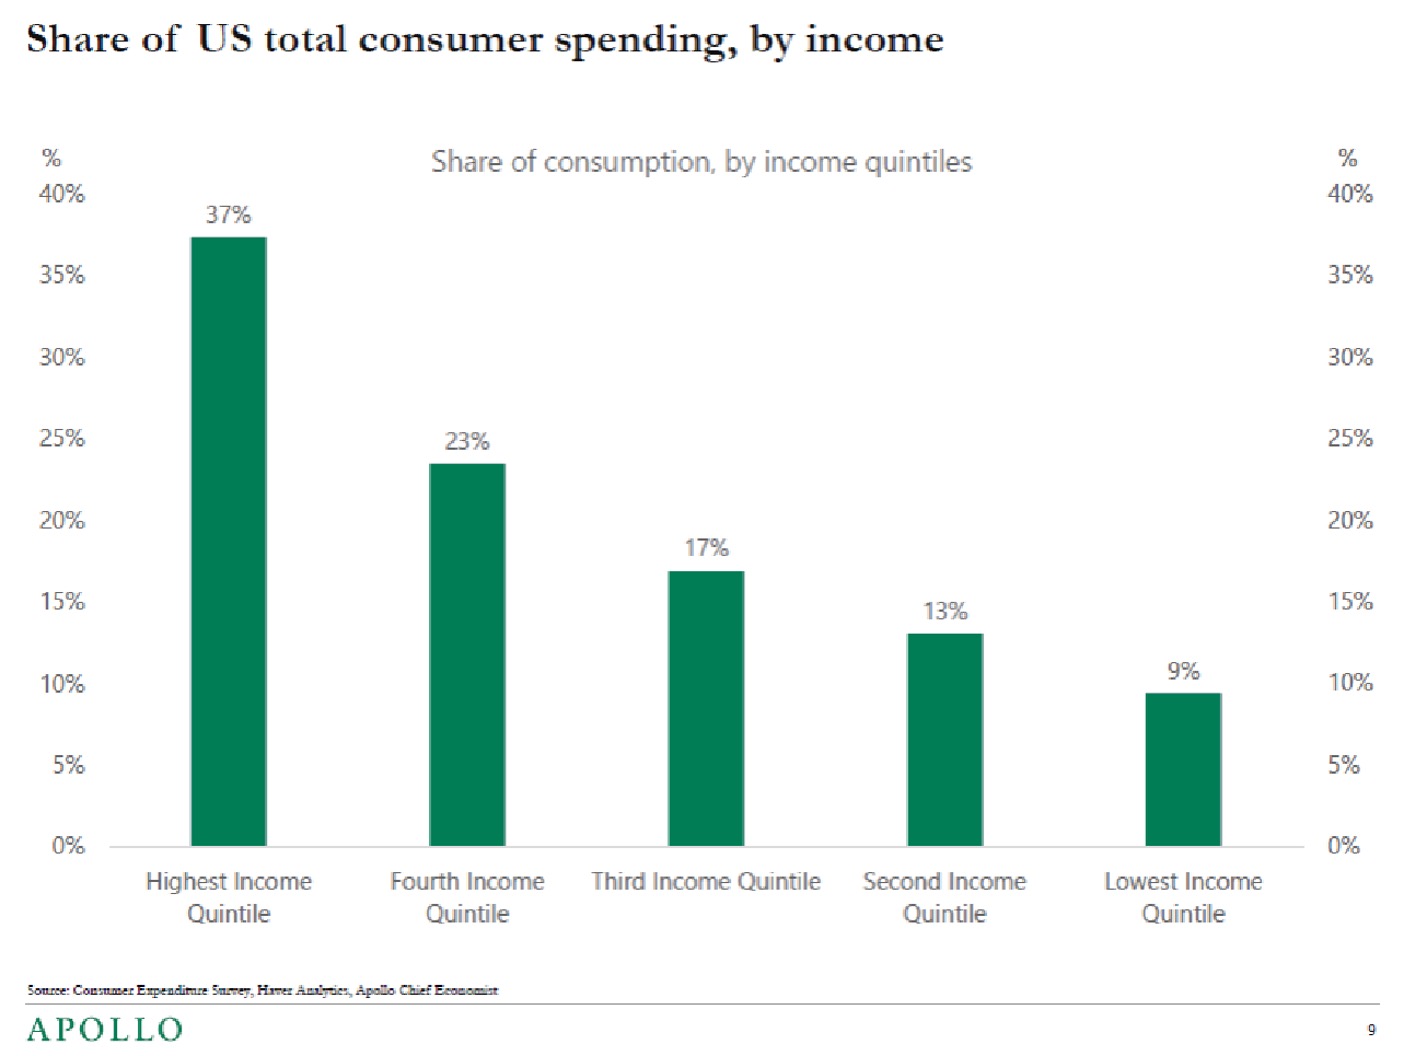
Source: Consumer Expenditure Survey, Haver Analytics, Apollo Chief Economist 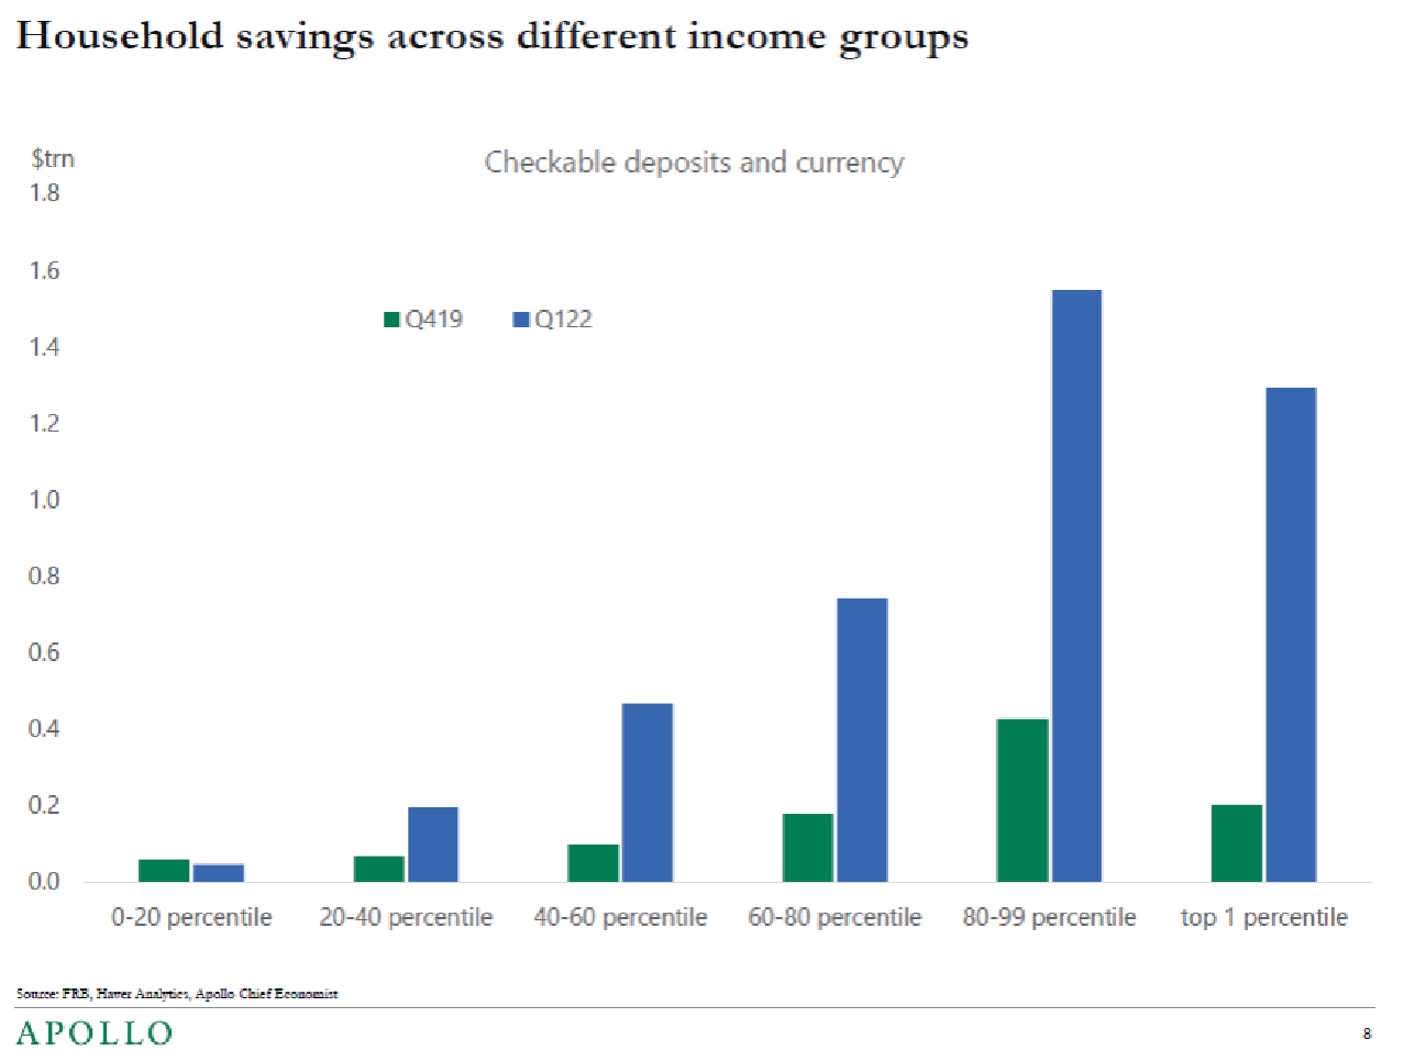
Source: FRB, Haver Analytics, Apollo Chief Economist See important disclaimers at the bottom of the page.
-
Daily data for restaurant bookings continues to show no signs of a slowdown, see chart below. Our weekly Slowdown Watch chart collection is available here.
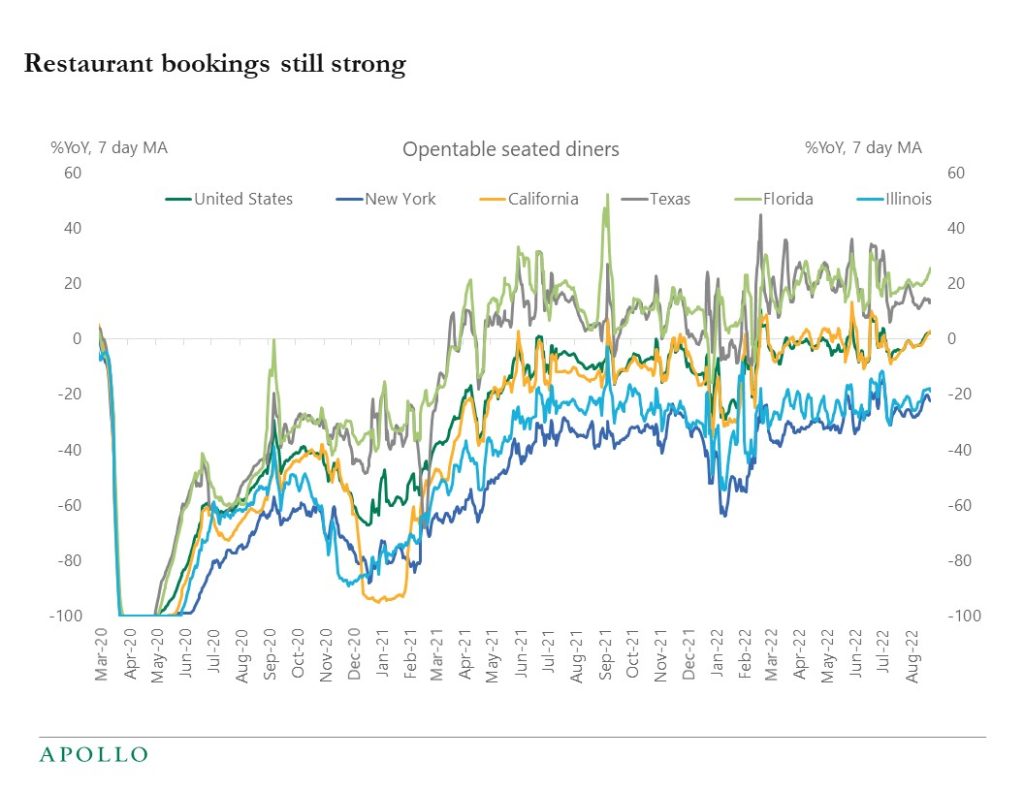
Source: OpenTable, Apollo Chief Economist See important disclaimers at the bottom of the page.
-
50.5% of US households have retirement assets, and the median balance per household is $65K, and the average balance is $255K.
For more, see Table 1 in this new paper from Congressional Research Service.
See important disclaimers at the bottom of the page.

This presentation may not be distributed, transmitted or otherwise communicated to others in whole or in part without the express consent of Apollo Global Management, Inc. (together with its subsidiaries, “Apollo”).
Apollo makes no representation or warranty, expressed or implied, with respect to the accuracy, reasonableness, or completeness of any of the statements made during this presentation, including, but not limited to, statements obtained from third parties. Opinions, estimates and projections constitute the current judgment of the speaker as of the date indicated. They do not necessarily reflect the views and opinions of Apollo and are subject to change at any time without notice. Apollo does not have any responsibility to update this presentation to account for such changes. There can be no assurance that any trends discussed during this presentation will continue.
Statements made throughout this presentation are not intended to provide, and should not be relied upon for, accounting, legal or tax advice and do not constitute an investment recommendation or investment advice. Investors should make an independent investigation of the information discussed during this presentation, including consulting their tax, legal, accounting or other advisors about such information. Apollo does not act for you and is not responsible for providing you with the protections afforded to its clients. This presentation does not constitute an offer to sell, or the solicitation of an offer to buy, any security, product or service, including interest in any investment product or fund or account managed or advised by Apollo.
Certain statements made throughout this presentation may be “forward-looking” in nature. Due to various risks and uncertainties, actual events or results may differ materially from those reflected or contemplated in such forward-looking information. As such, undue reliance should not be placed on such statements. Forward-looking statements may be identified by the use of terminology including, but not limited to, “may”, “will”, “should”, “expect”, “anticipate”, “target”, “project”, “estimate”, “intend”, “continue” or “believe” or the negatives thereof or other variations thereon or comparable terminology.