


Want it delivered daily to your inbox?
-
Predictably Bad Investments: Evidence from Venture Capitalists
https://papers.ssrn.com/sol3/papers.cfm?abstract_id=4135861
Central Bank Communication with the General Public
Directed Search with Phantom Vacancies
See important disclaimers at the bottom of the page.
-
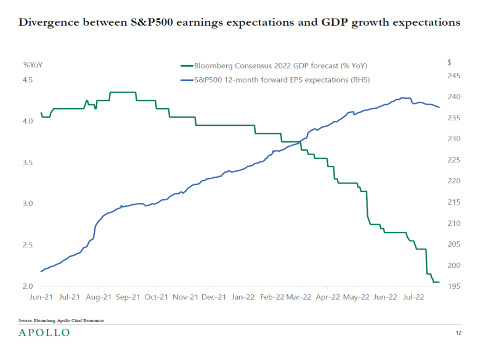
Consensus continues to downgrade growth expectations, and Treasury markets are starting to price a recession coming.
This narrative in rates is in sharp contrast to the story being told in equity and credit markets, where the consensus has only revised down earnings expectations very modestly, see chart below.
The bottom line is that rates investors and Fed watchers are getting increasingly worried about a coming recession, but equity investors are much more bullish and see little reason to downgrade earnings expectations meaningfully.
Our chart book with daily and weekly indicators for the US economy is available here.
See important disclaimers at the bottom of the page.
-
Weekly data shows that a rising share of households say that they have difficulties paying their expenses, see chart below.
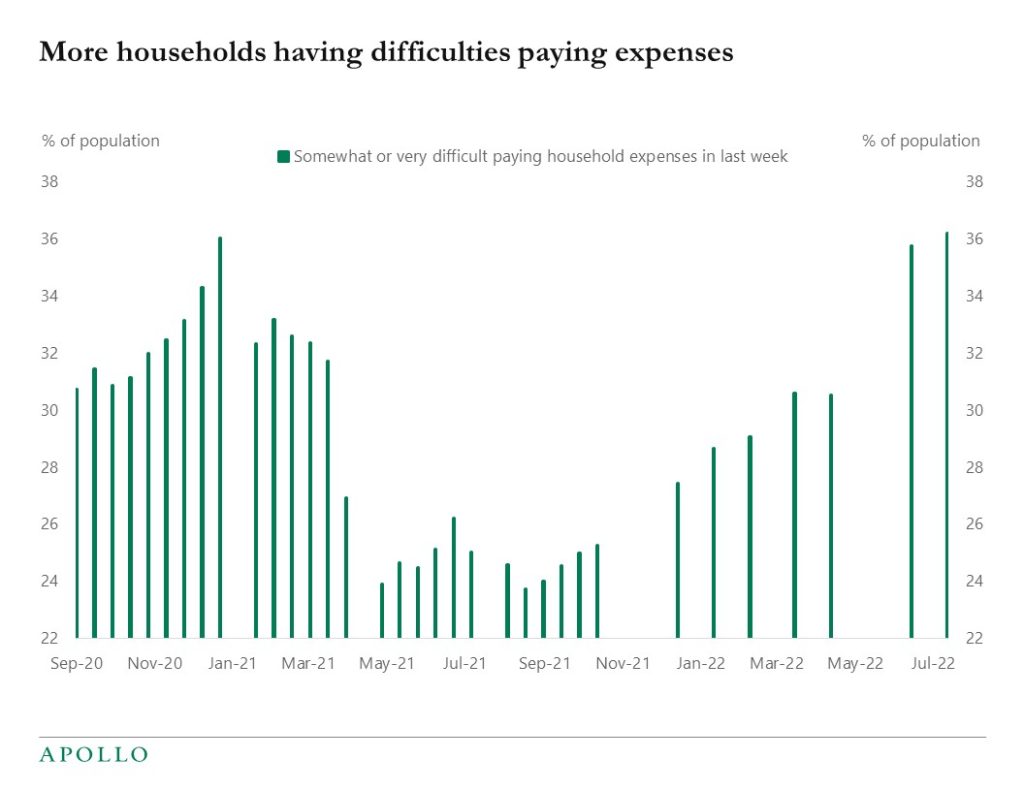
Source: Census Bureau, Apollo Chief Economist (Note: Household Pulse Survey) See important disclaimers at the bottom of the page.
-
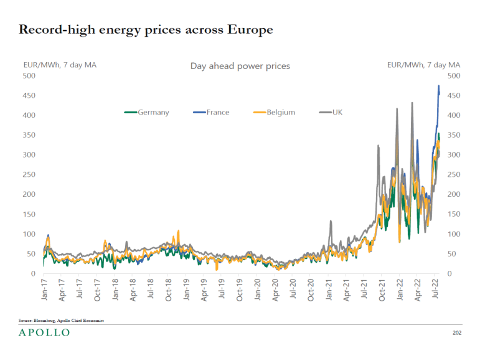
The costs of electricity for European households and firms are currently five to ten times higher than normal, and this is a serious risk to the outlook for Europe, see chart below.
See important disclaimers at the bottom of the page.
-
With Walmart’s earnings out, the debate about the health of the US consumer is heating up again.
Wage growth is high, and job creation is strong, but inflation is starting to have a negative impact and trigger substitutions and changing consumption patterns.
From a rates and Fed perspective, what matters is growth in overall consumer spending. The top 60% of incomes account for almost 80% of total consumer spending, and with significant savings left among middle- and high-income households, it will take some time before overall consumer spending starts to slow down, see charts below.
The bottom line is that the Fed will have to raise rates more than the market expects to successfully cool the economy down. And faster Fed hikes increase the risk of a harder landing and deeper yield curve inversion.
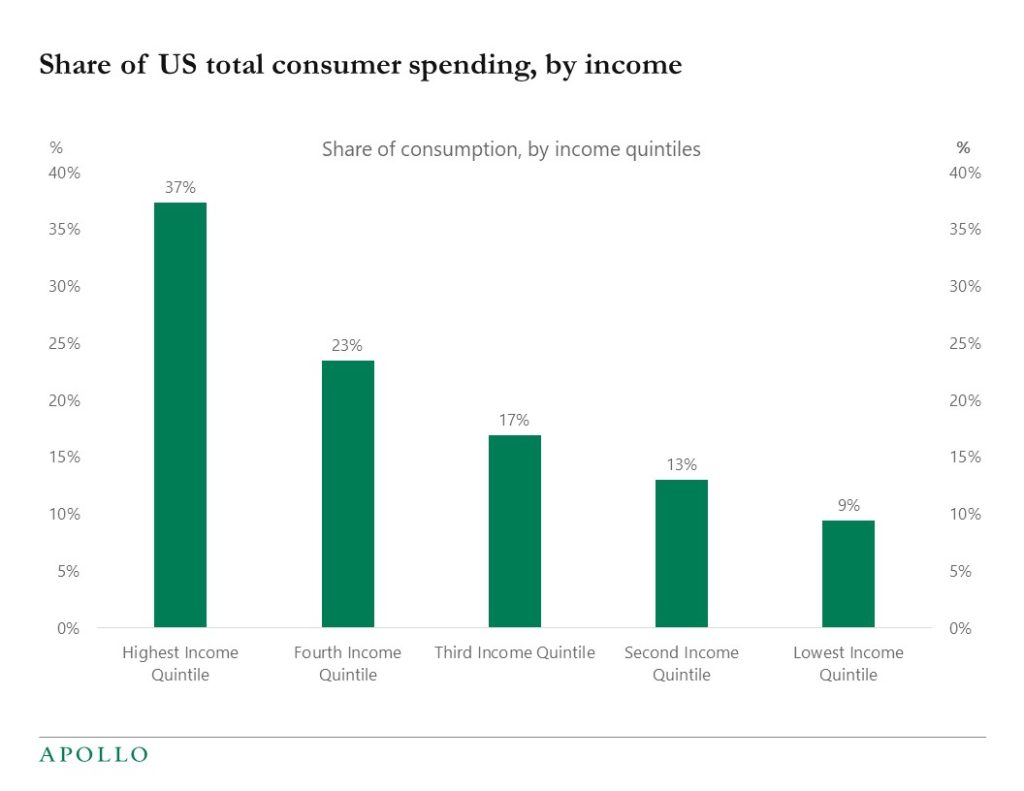
Source: Consumer Expenditure Survey, Haver Analytics, Apollo Chief Economist 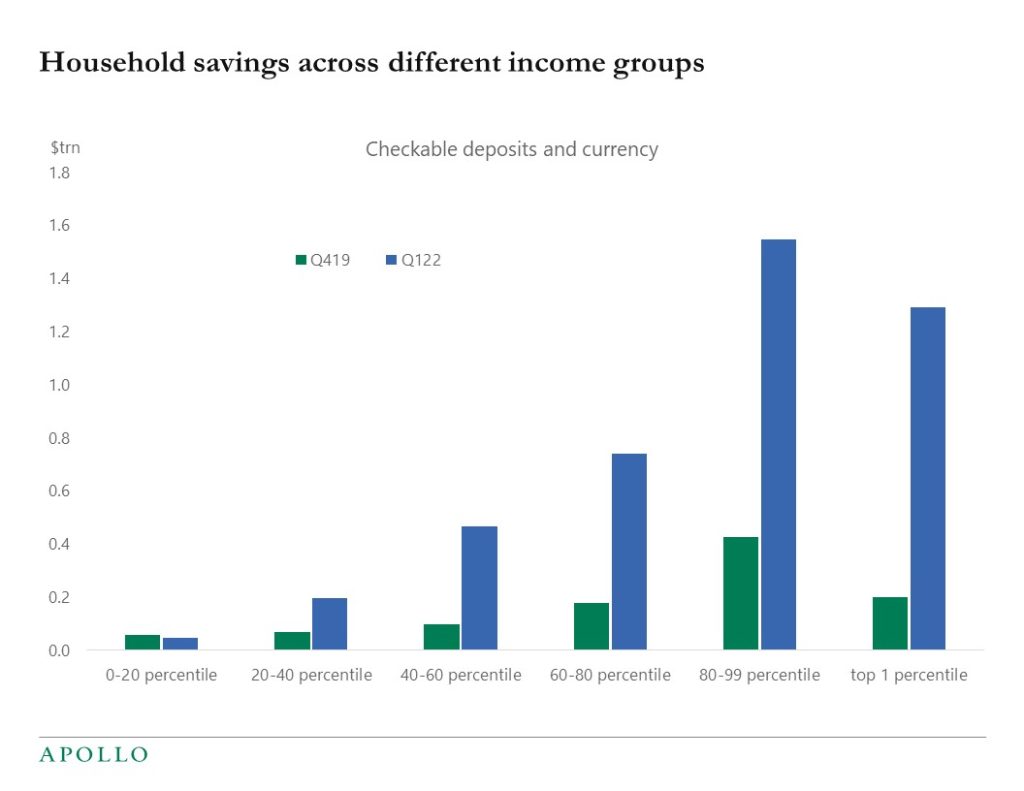
Source: FRB, Haver Analytics, Apollo Chief Economist See important disclaimers at the bottom of the page.
-
Using the global BIS database, there are currently zero countries in the world with inflation below 2%, see chart below.
This fact raises the question whether US inflation is really something special driven by stimulus checks, higher unemployment benefits, and PPP loans.
Maybe the simple explanation is that inflation in the US is not driven by fiscal policy or even monetary policy, as our economics textbooks would say.
Instead, inflation went up literally everywhere in the world because of supply problems in the goods sector and in the energy sector. If this is the case, then inflation will soon come down once the supply chain problems in the goods and energy sectors have been resolved.
The bottom line is that with falling commodity prices and falling costs of transporting goods by container, truck, train, and air, we could see a sharp decline in inflation over the coming months. At least, the global nature of inflation seen in the chart below suggests that there is really nothing special about US inflation.
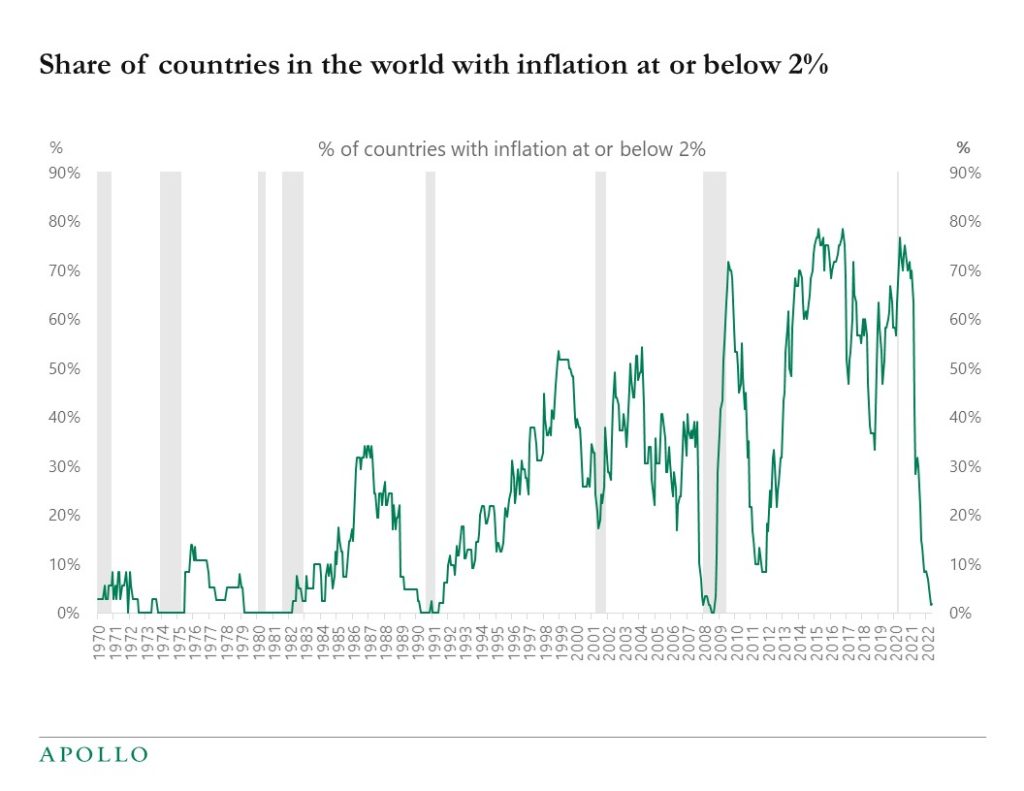
Source: BIS, Haver Analytics, Apollo Chief Economist. Note: Data till May 2022 (46 countries reported). The dataset includes the following 60 countries Euro Area, United States, United Kingdom, Austria, Belgium, Denmark, France, Germany, Italy, Luxembourg, Netherlands, Norway, Sweden, Switzerland, Canada, Japan, Finland, Greece, Iceland, Ireland, Malta, Portugal, Spain, Turkey, Australia, New Zealand, South Africa, Argentina, Brazil, Chile, Mexico, Peru, Cyprus, Israel, Saudi Arabia, United Arab Emirates, Hong Kong, India, Indonesia, Korea, Malaysia, Philippines, Singapore, Thailand, Algeria, Bulgaria, Russia, China, Czech Republic, Slovakia, Estonia, Latvia, Serbia, Hungary, Lithuania, Croatia, Slovenia, Macedonia, Poland, and Romania. See important disclaimers at the bottom of the page.
-
Dollar Funding Stresses in China
https://papers.ssrn.com/sol3/papers.cfm?abstract_id=4099944
IMF: Sharing the Pain of a Potential Russian Gas Shut-off to the European Union
https://www.imf.org/en/Publications/WP/Issues/2022/07/18/Market-Size-and-Supply-Disruptions-Sharing-the-Pain-of-a-Potential-Russian-Gas-Shut-off-to-520928
BIS: Big tech interdependencies – a key policy blind spot
See important disclaimers at the bottom of the page.
-
Our set of daily and weekly economic indicators for the US economy is available here, and we are watching the ongoing increase in jobless claims very carefully, see chart below.
So far, the uptrend in these weekly unemployment numbers is not alarming, but any signs of faster softening in the labor market would begin to impact Fed thinking. Ultimately Fed communication later this year will change from “we have an inflation problem” to “we have a growth problem.”
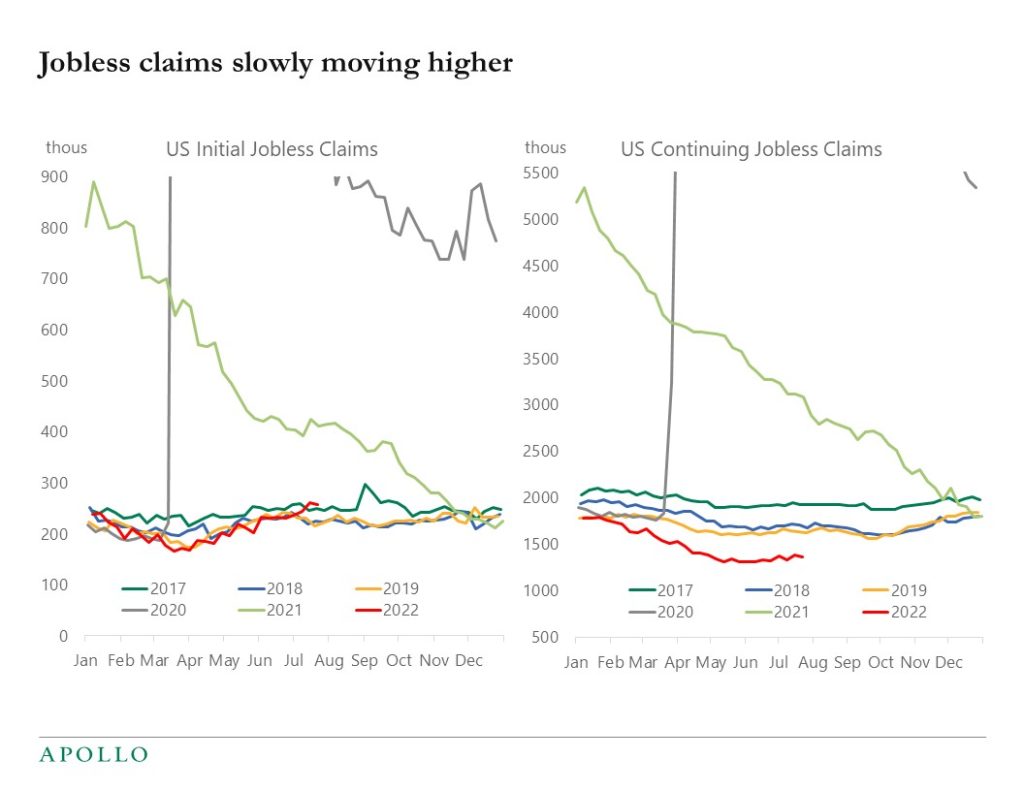
Source: Department of Labor, Bloomberg, Apollo Chief Economist See important disclaimers at the bottom of the page.
-
CFOs are less worried about their own business than they are about the broader economy, see chart below.
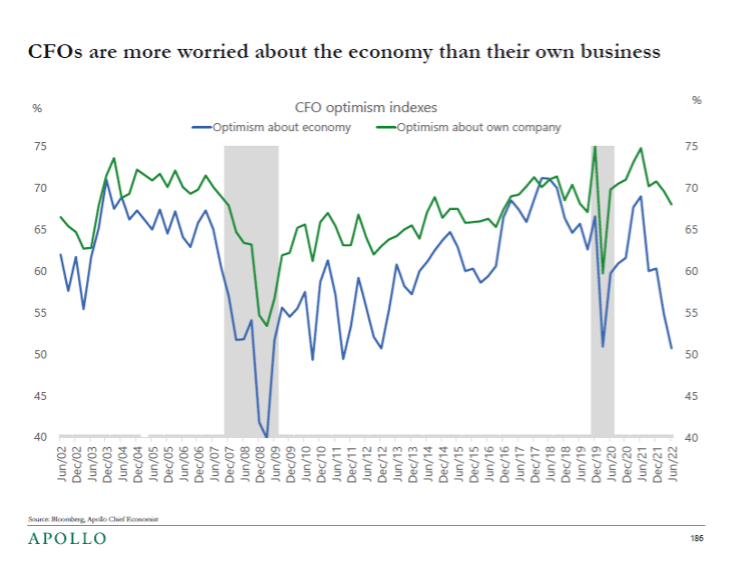
See important disclaimers at the bottom of the page.
-
The United Nations is forecasting significant declines in the size of the working-age populations for Japan, Europe, and China, see chart below. This has important implications for consumer spending patterns, overall GDP growth, and the level of long-term interest rates in the US relative to the rest of the world.
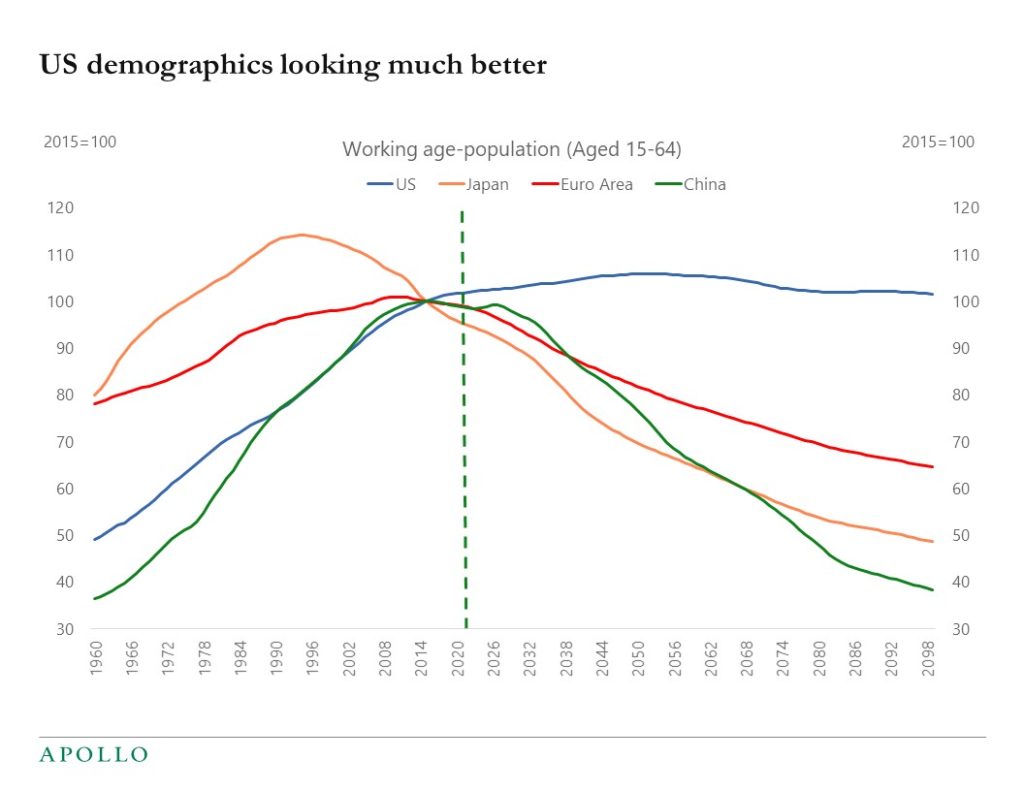
Source: UN, Haver, Apollo Chief Economist See important disclaimers at the bottom of the page.

This presentation may not be distributed, transmitted or otherwise communicated to others in whole or in part without the express consent of Apollo Global Management, Inc. (together with its subsidiaries, “Apollo”).
Apollo makes no representation or warranty, expressed or implied, with respect to the accuracy, reasonableness, or completeness of any of the statements made during this presentation, including, but not limited to, statements obtained from third parties. Opinions, estimates and projections constitute the current judgment of the speaker as of the date indicated. They do not necessarily reflect the views and opinions of Apollo and are subject to change at any time without notice. Apollo does not have any responsibility to update this presentation to account for such changes. There can be no assurance that any trends discussed during this presentation will continue.
Statements made throughout this presentation are not intended to provide, and should not be relied upon for, accounting, legal or tax advice and do not constitute an investment recommendation or investment advice. Investors should make an independent investigation of the information discussed during this presentation, including consulting their tax, legal, accounting or other advisors about such information. Apollo does not act for you and is not responsible for providing you with the protections afforded to its clients. This presentation does not constitute an offer to sell, or the solicitation of an offer to buy, any security, product or service, including interest in any investment product or fund or account managed or advised by Apollo.
Certain statements made throughout this presentation may be “forward-looking” in nature. Due to various risks and uncertainties, actual events or results may differ materially from those reflected or contemplated in such forward-looking information. As such, undue reliance should not be placed on such statements. Forward-looking statements may be identified by the use of terminology including, but not limited to, “may”, “will”, “should”, “expect”, “anticipate”, “target”, “project”, “estimate”, “intend”, “continue” or “believe” or the negatives thereof or other variations thereon or comparable terminology.