


The Daily Spark is moving to Apollo.com— read the latest from Torsten Slok here.
Want it delivered daily to your inbox?
-
The cyclically adjusted price earnings ratio, also known as the Shiller P/E, is a stock market valuation measure that divides the current stock price by the average of the last 10 years’ inflation-adjusted earnings, thereby smoothing out business cycle volatility to assess long-term over/undervaluation and predict future returns. It provides a better gauge of sustainable earnings power than the traditional P/E ratio, which uses only one year’s earnings. The latest reading shows that equity valuations are near the highest levels since 1880, see chart below.
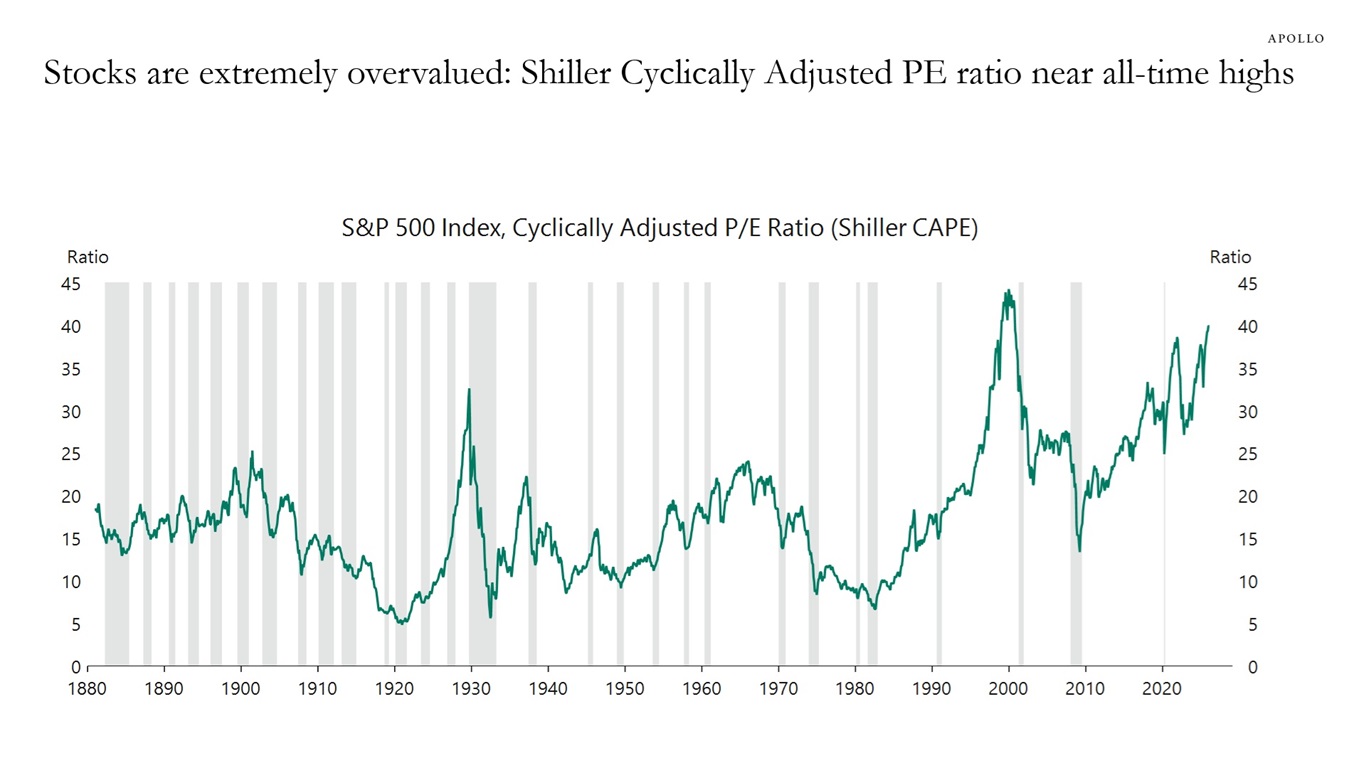
Sources: Robert Shiller, Macrobond, Apollo Chief Economist See important disclaimers at the bottom of the page.
-
Durable goods data shows that there is a capex boom underway in the US economy, see chart below, and the One Big Beautiful Bill is going to boost business fixed investment further over the coming quarters.
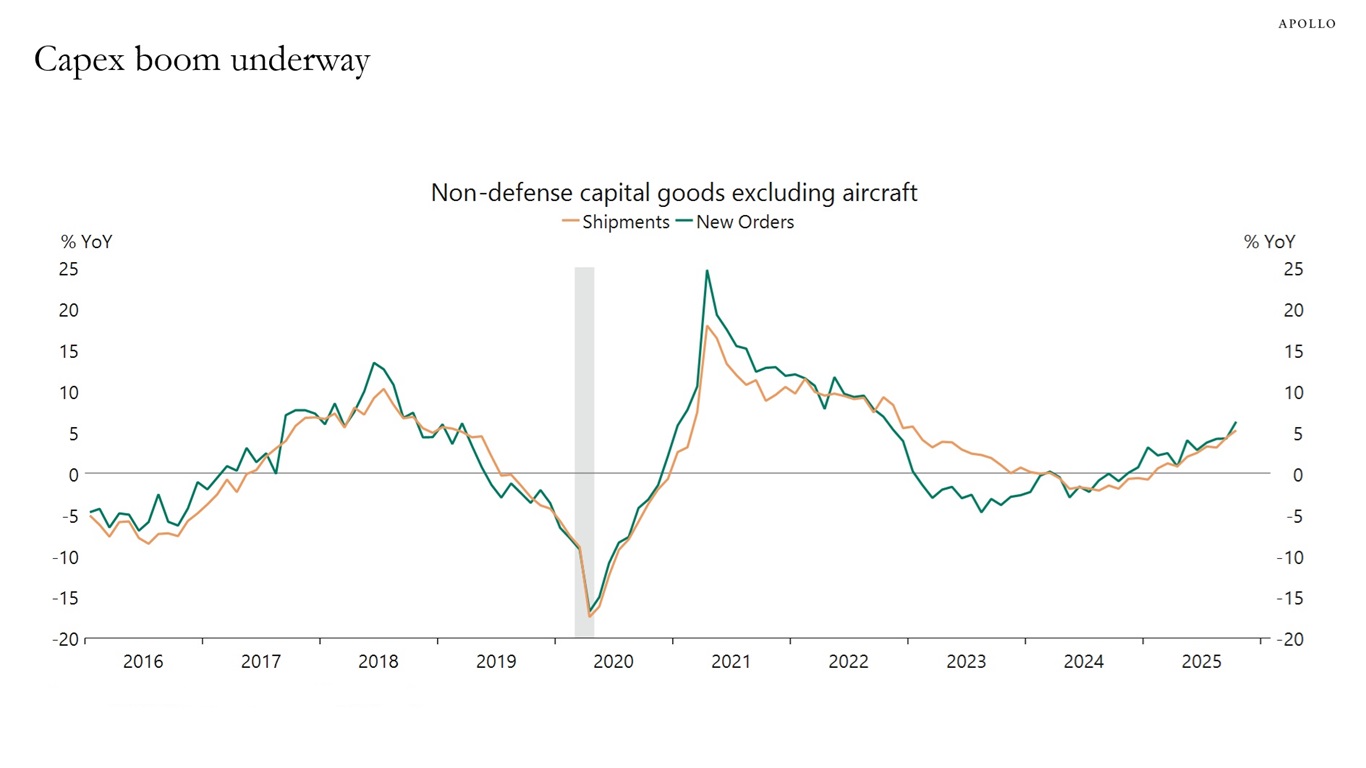
Sources: US Census Bureau, Macrobond, Apollo Chief Economist See important disclaimers at the bottom of the page.
-
In 2025, we worried that the trade war and immigration restrictions would lead to stagflation.
With those headwinds fading, the list of tailwinds keeps growing, and we are starting to worry about overheating in 2026.
The bottom line is that there are significant upside catalysts to growth and inflation over the coming quarters, see list of tailwinds below.
US economic outlook: 10 tailwinds in 2026
1. Trade war uncertainty fading
2. Strong AI and data center spending
3. High AI stock prices boosting wealth effects for consumers
4. Dollar depreciation
5. Falling oil prices
6. The Soccer World Cup
7. One Big Beautiful Bill eliminates federal income tax on overtime pay and tips
8. One Big Beautiful Bill increases the child tax credit to $2,200 dollars per child
9. One Big Beautiful Bill extends 100% expensing for equipment and factories to encourage capex and hiring
10. Tax refunds for households will be larger because the total tax liability for 2026 is lower
See important disclaimers at the bottom of the page.
-
We have updated our chart book documenting the extreme AI concentration within the S&P 500’s market cap, returns, earnings and capex. It is available here.
The bottom line is that investors in the S&P 500 remain overexposed to AI.
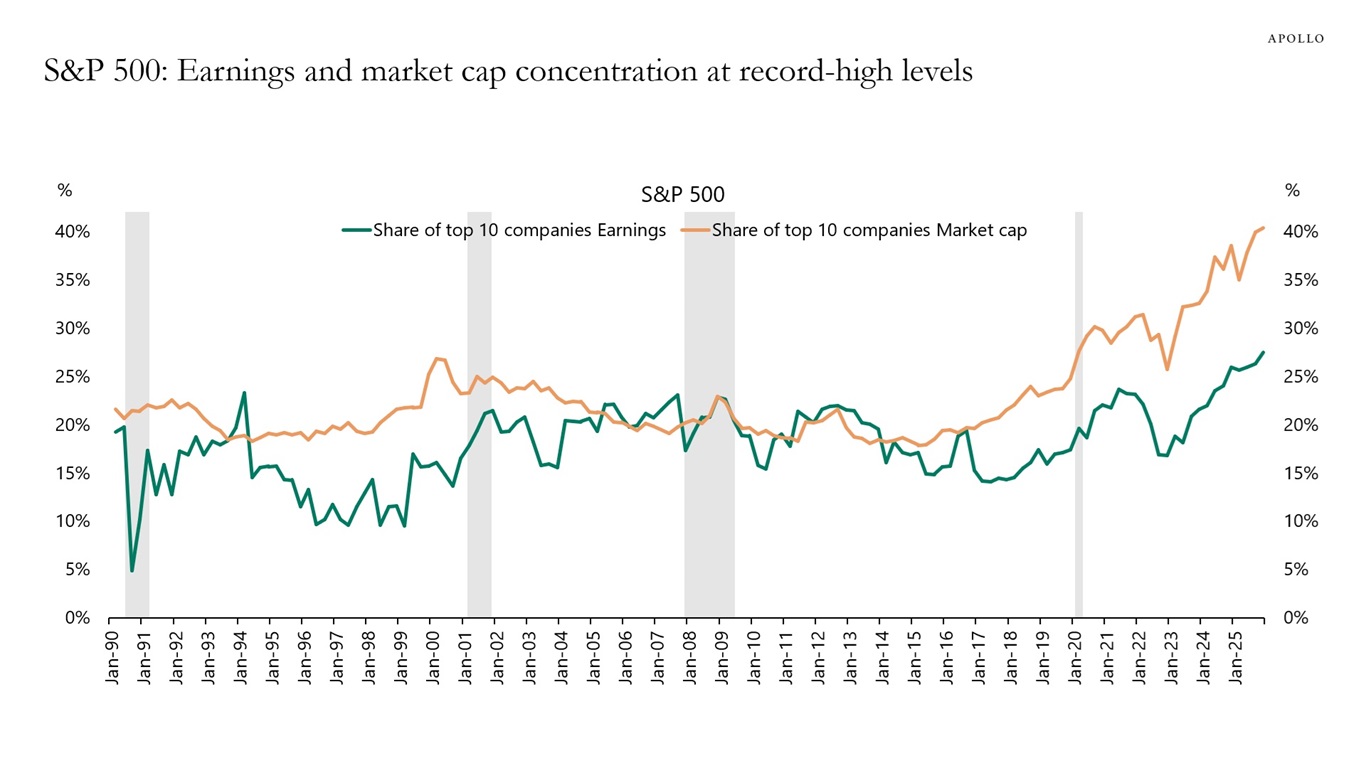
Sources: Bloomberg, Apollo Chief Economist See important disclaimers at the bottom of the page.
-
The latest Duke CFO survey shows that the vast majority of CFOs are seeing no impact from AI on labor productivity, decision-making speed, customer satisfaction or time spent on high value-added tasks, see chart below.
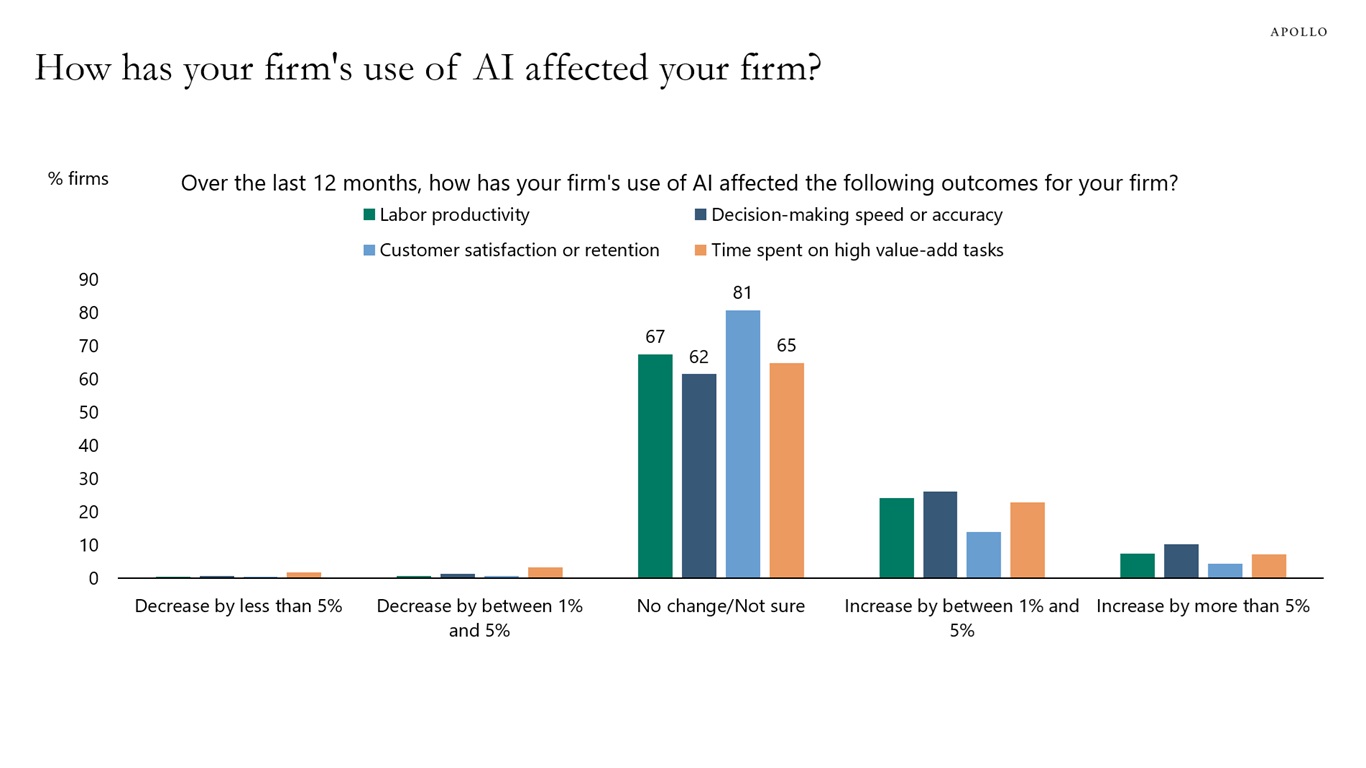
Sources: CFO Survey, Federal Reserve Bank of Richmond, Federal Reserve Bank of Atlanta, Apollo Chief Economist See important disclaimers at the bottom of the page.
-
Data from the Census shows that the weekly number of business applications is at all-time highs, see chart below.
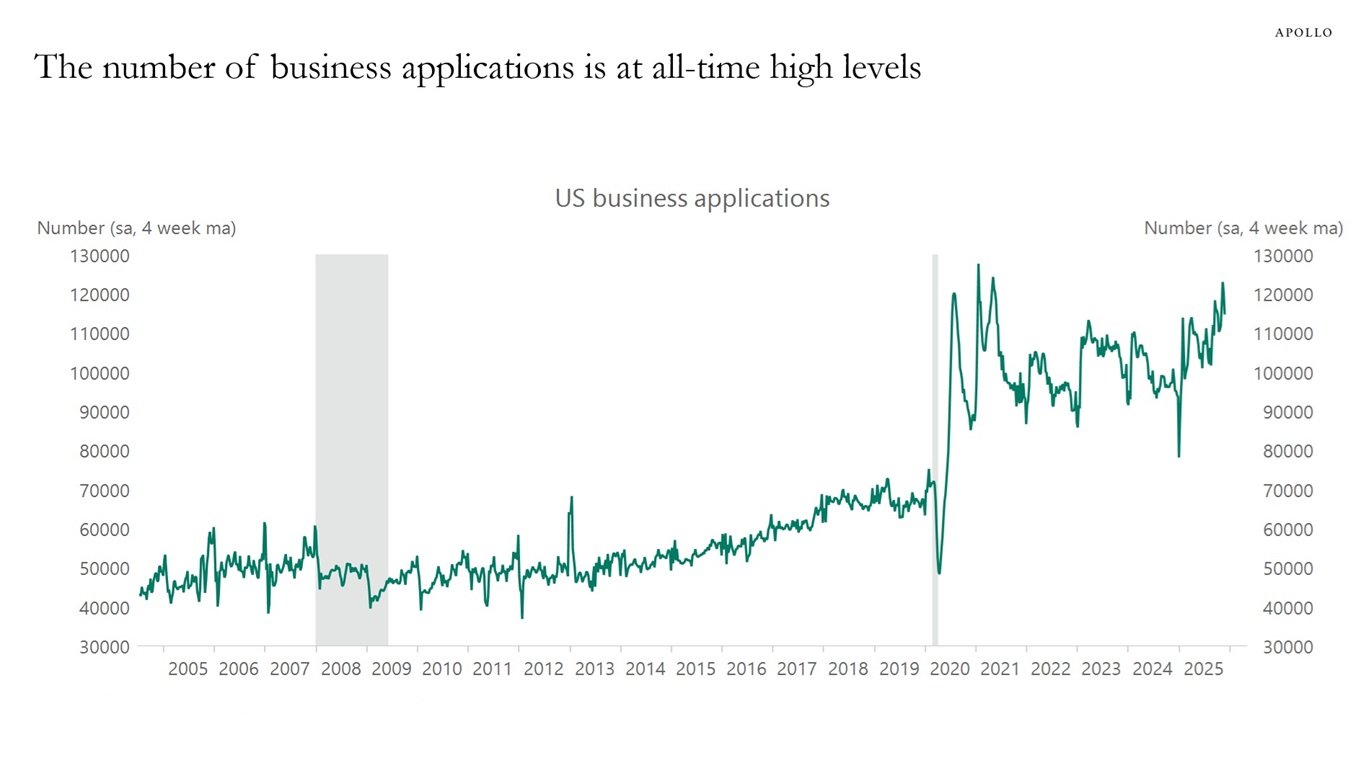
Sources: US Census Bureau, Macrobond, Apollo Chief Economist See important disclaimers at the bottom of the page.
-
Hyperscalers and AI‑adjacent issuers are expected to contribute a meaningful share of incremental IG supply in 2026 as they fund large data‑center and AI infrastructure capex.
Estimates of 2026 IG gross issuance from 10 Wall Street banks show wide dispersion, with forecasts ranging from about $1.6 trillion at the low end to $2.25 trillion at the high end, see chart below.
The significant increase in hyperscaler issuance raises questions about who will be the marginal buyer of IG paper.
Will it come from Treasury purchases and hence put upward pressure on the level of rates? Or might it come from mortgage purchases, putting upward pressure on mortgage spreads?
The bottom line is that the volume of fixed-income products coming to market this year is significant and is likely to put upward pressure on rates and credit spreads as we go through 2026.
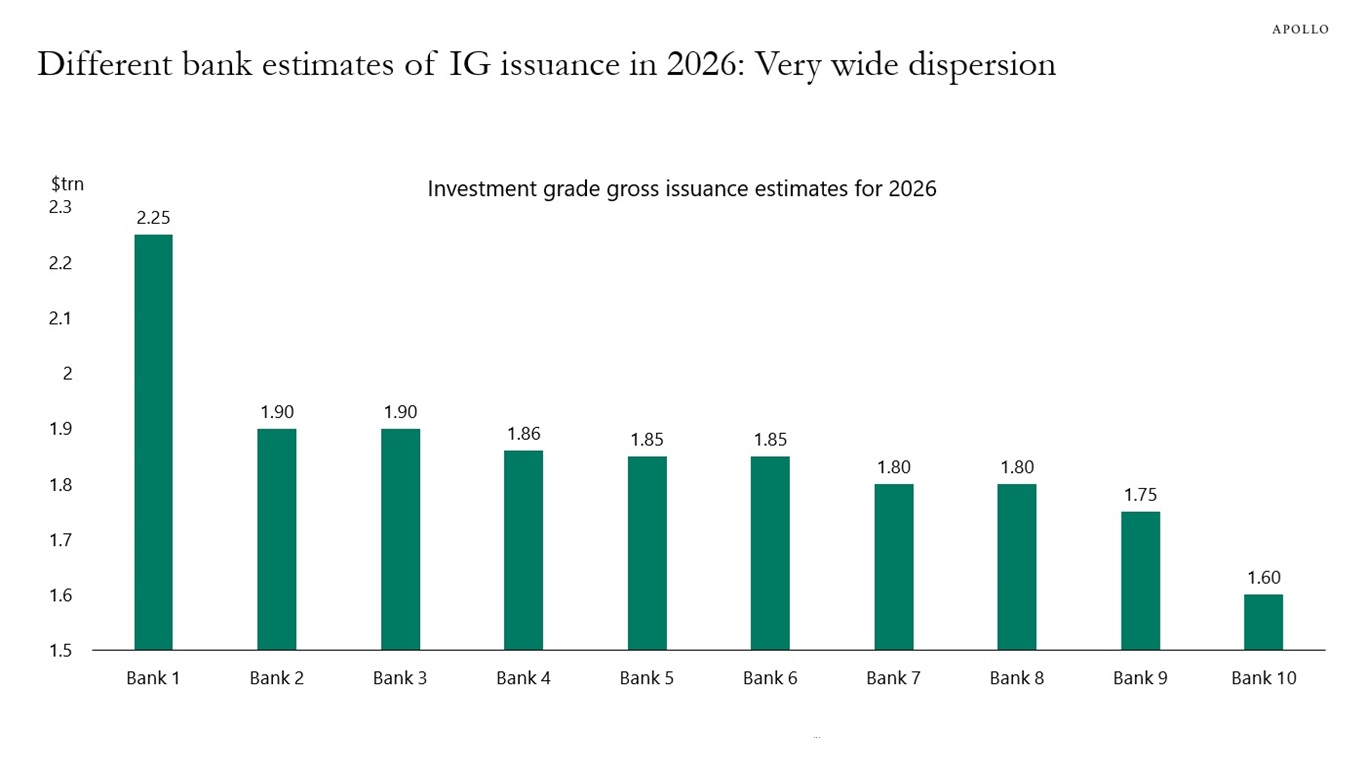
Note: The banks are MS, GS, Wells Fargo, DB, Bank of America, Mizuho, JP Morgan, BNP, Citi, and Barclays. Sources: Ten different investment banks, Apollo Chief Economist See important disclaimers at the bottom of the page.
-
OECD data shows that the future early retirement age differs dramatically across countries. Illustrated using male workers, it is 58 in the UK, 62 in the US and 71 in Denmark, see chart below.
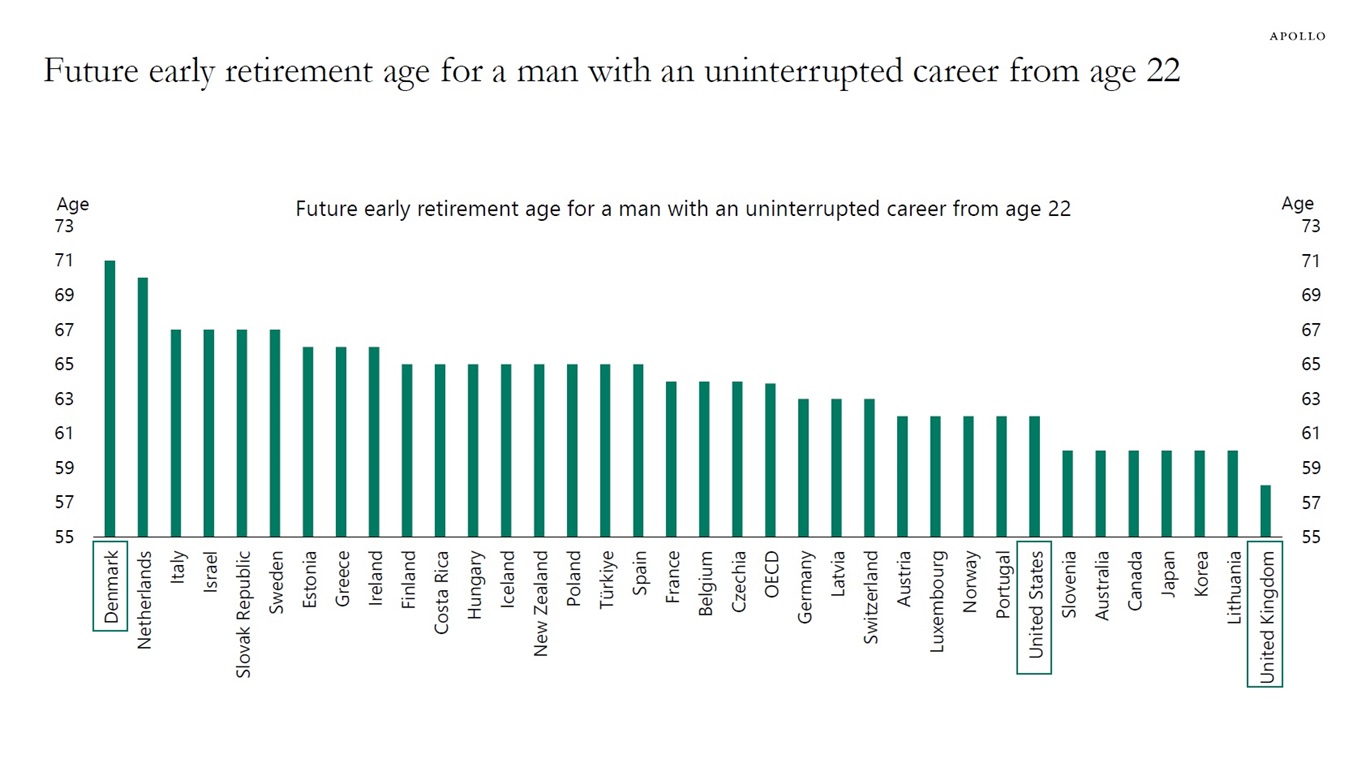
Sources: OECD Pensions at a Glance 2025 | OECD, Apollo Chief Economist See important disclaimers at the bottom of the page.
-
Demand for housing is slowing because of high home prices, high mortgage rates and declining immigration.
Housing supply is steady because existing homeowners are reluctant to sell their homes, since they’re locked into lower mortgage rates and don’t want to take on higher ones. Housing supply of new homes is rising.
The bottom line is that falling demand and rising supply are putting downward pressure on home prices.
Our latest US housing outlook is available here.
See important disclaimers at the bottom of the page.
-
The IMF estimates that fiscal policy will boost growth by 1% in Germany and 0.5% in Japan in 2026. The CBO estimates that the One Big Beautiful Bill will boost US growth by 0.9%. The bottom line is that fiscal policy in the G3 will be very expansionary over the coming quarters, see chart below.
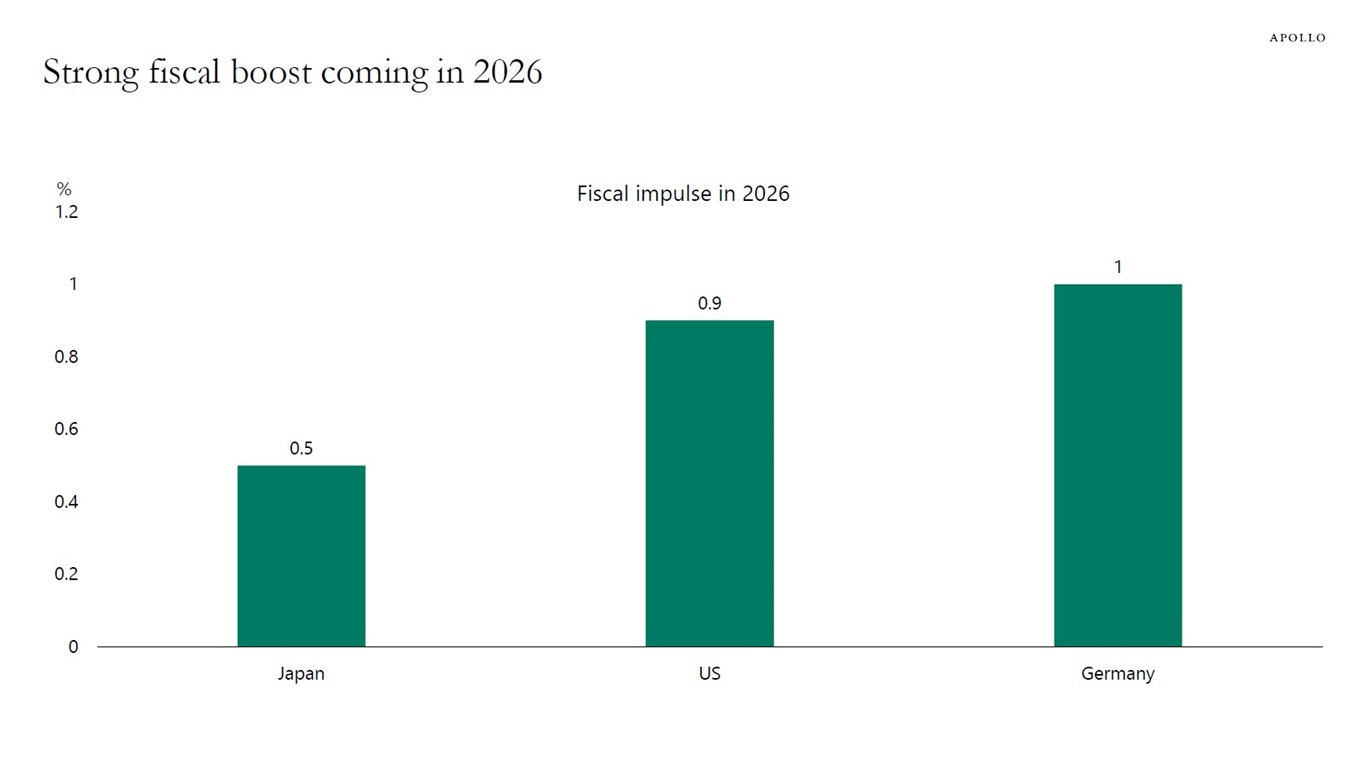
Note: Fiscal impulse calculated using cyclically adjusted primary balance for Japan and Germany, and the estimated Impact of the OBBBA from the CBO. Sources: IMF Fiscal Monitor, CBO, Haver Analytics, Apollo Chief Economist See important disclaimers at the bottom of the page.

This presentation may not be distributed, transmitted or otherwise communicated to others in whole or in part without the express consent of Apollo Global Management, Inc. (together with its subsidiaries, “Apollo”).
Apollo makes no representation or warranty, expressed or implied, with respect to the accuracy, reasonableness, or completeness of any of the statements made during this presentation, including, but not limited to, statements obtained from third parties. Opinions, estimates and projections constitute the current judgment of the speaker as of the date indicated. They do not necessarily reflect the views and opinions of Apollo and are subject to change at any time without notice. Apollo does not have any responsibility to update this presentation to account for such changes. There can be no assurance that any trends discussed during this presentation will continue.
Statements made throughout this presentation are not intended to provide, and should not be relied upon for, accounting, legal or tax advice and do not constitute an investment recommendation or investment advice. Investors should make an independent investigation of the information discussed during this presentation, including consulting their tax, legal, accounting or other advisors about such information. Apollo does not act for you and is not responsible for providing you with the protections afforded to its clients. This presentation does not constitute an offer to sell, or the solicitation of an offer to buy, any security, product or service, including interest in any investment product or fund or account managed or advised by Apollo.
Certain statements made throughout this presentation may be “forward-looking” in nature. Due to various risks and uncertainties, actual events or results may differ materially from those reflected or contemplated in such forward-looking information. As such, undue reliance should not be placed on such statements. Forward-looking statements may be identified by the use of terminology including, but not limited to, “may”, “will”, “should”, “expect”, “anticipate”, “target”, “project”, “estimate”, “intend”, “continue” or “believe” or the negatives thereof or other variations thereon or comparable terminology.