Treasury Issuance Growing

Apollo Chief Economist

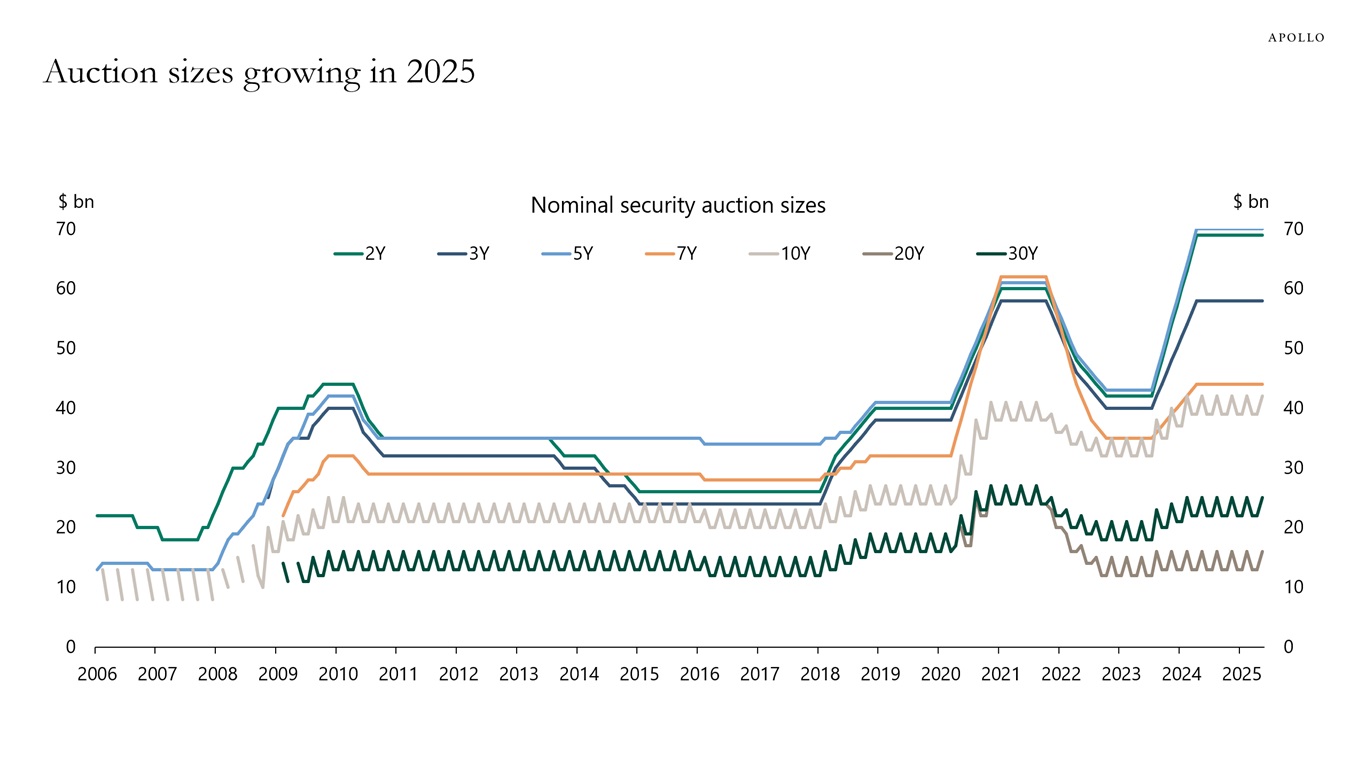
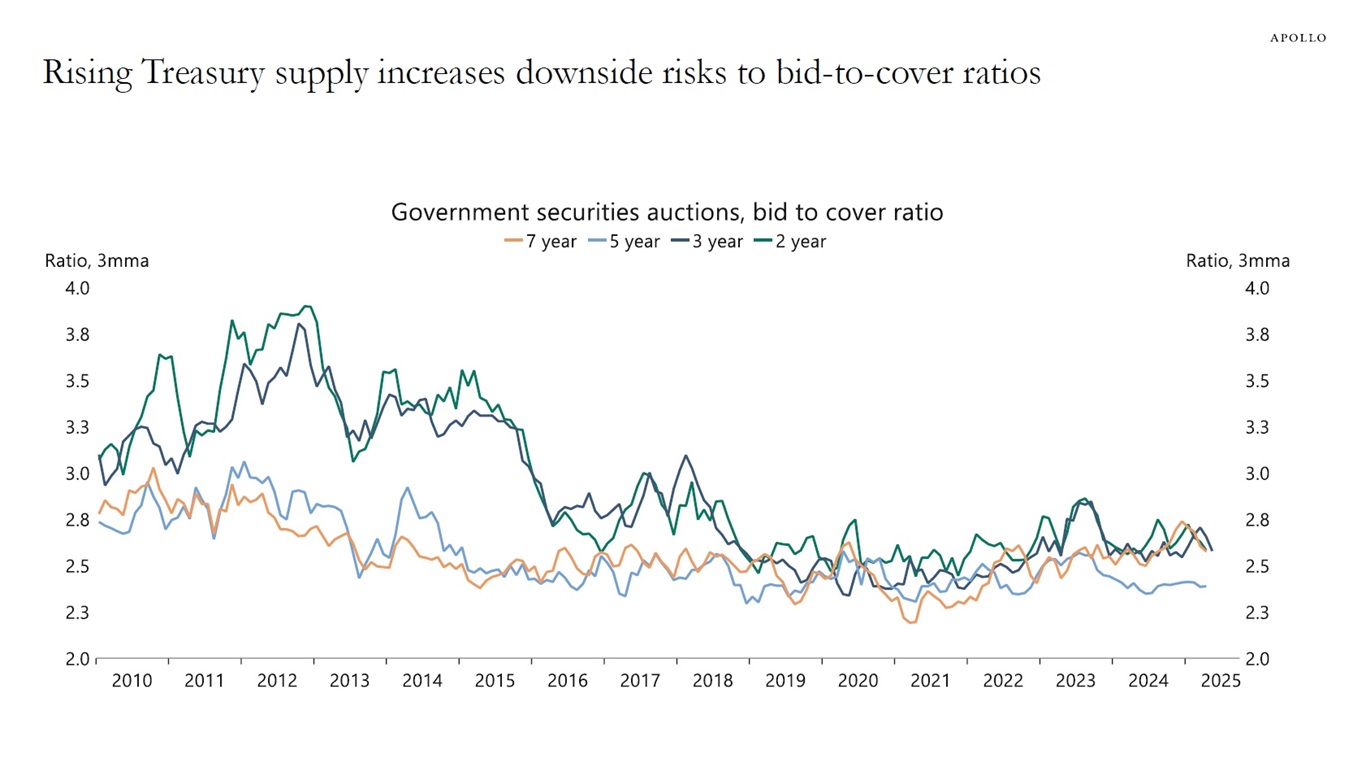
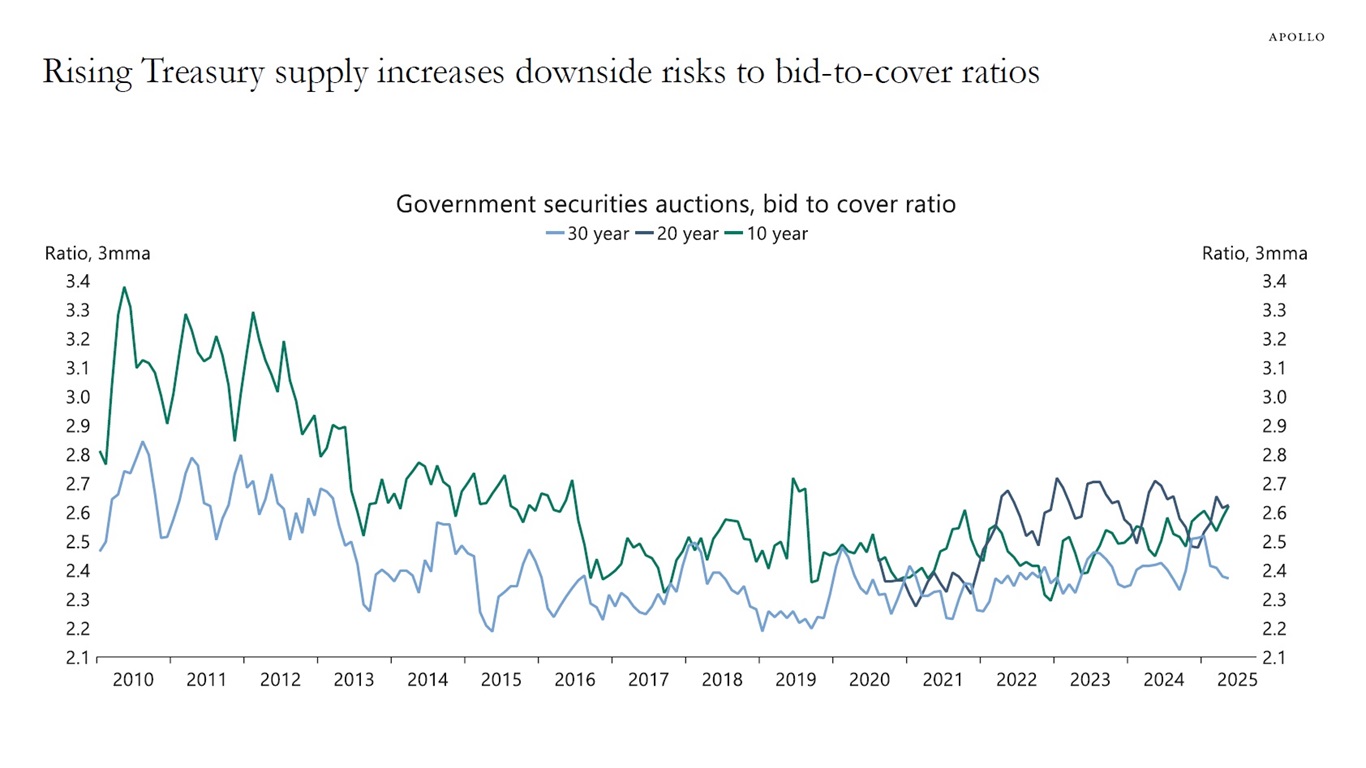
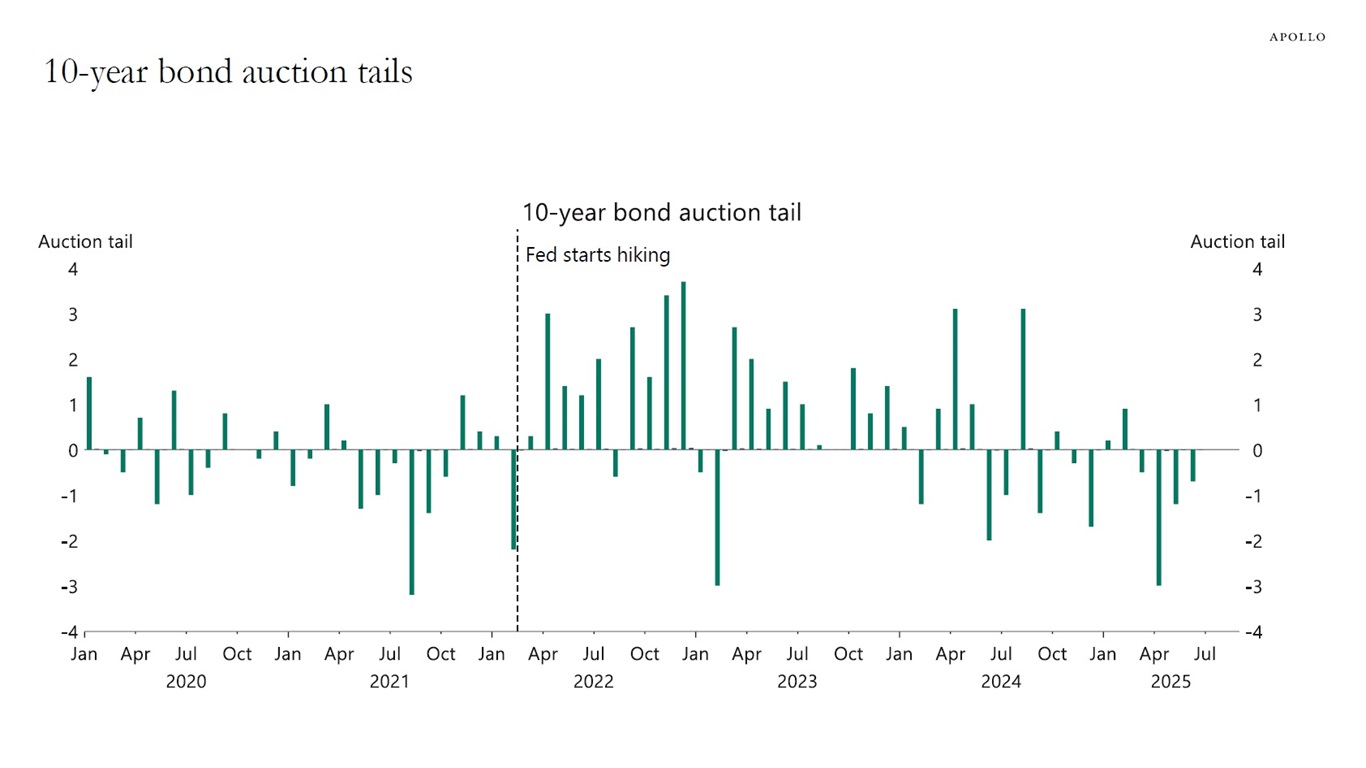
Examining Treasury auction metrics across the curve reveals no signs of weakness in demand for US Treasuries at present. Bid-to-cover ratios are stable, and there is no evidence of auctions systematically tailing, see the first four charts below.

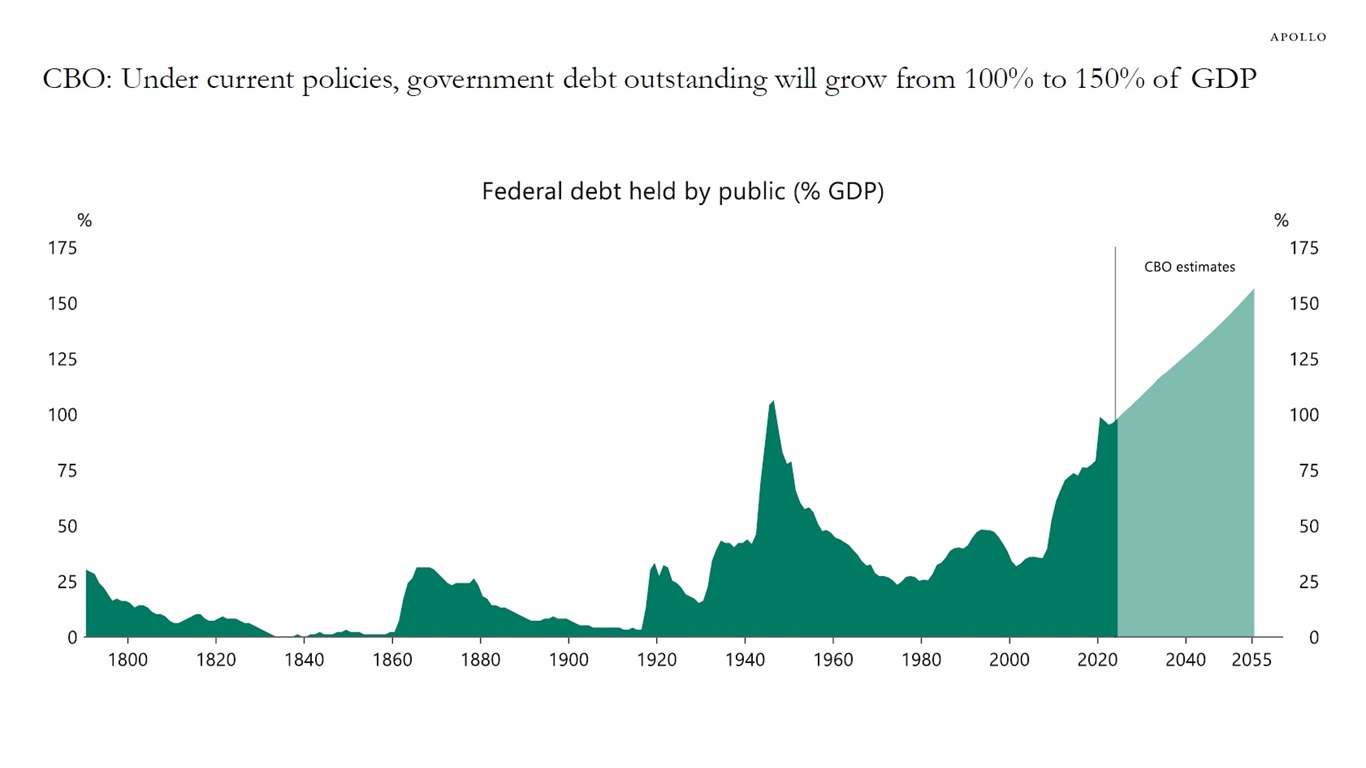
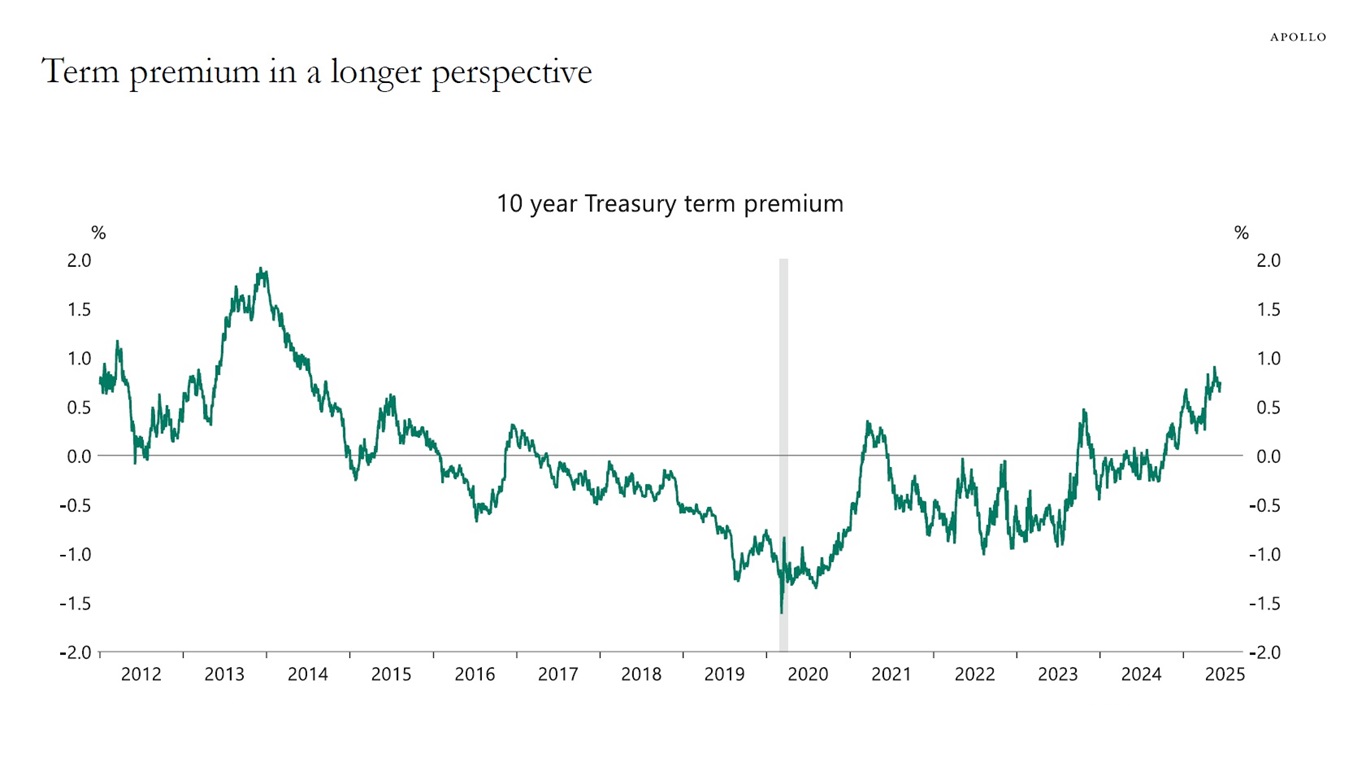
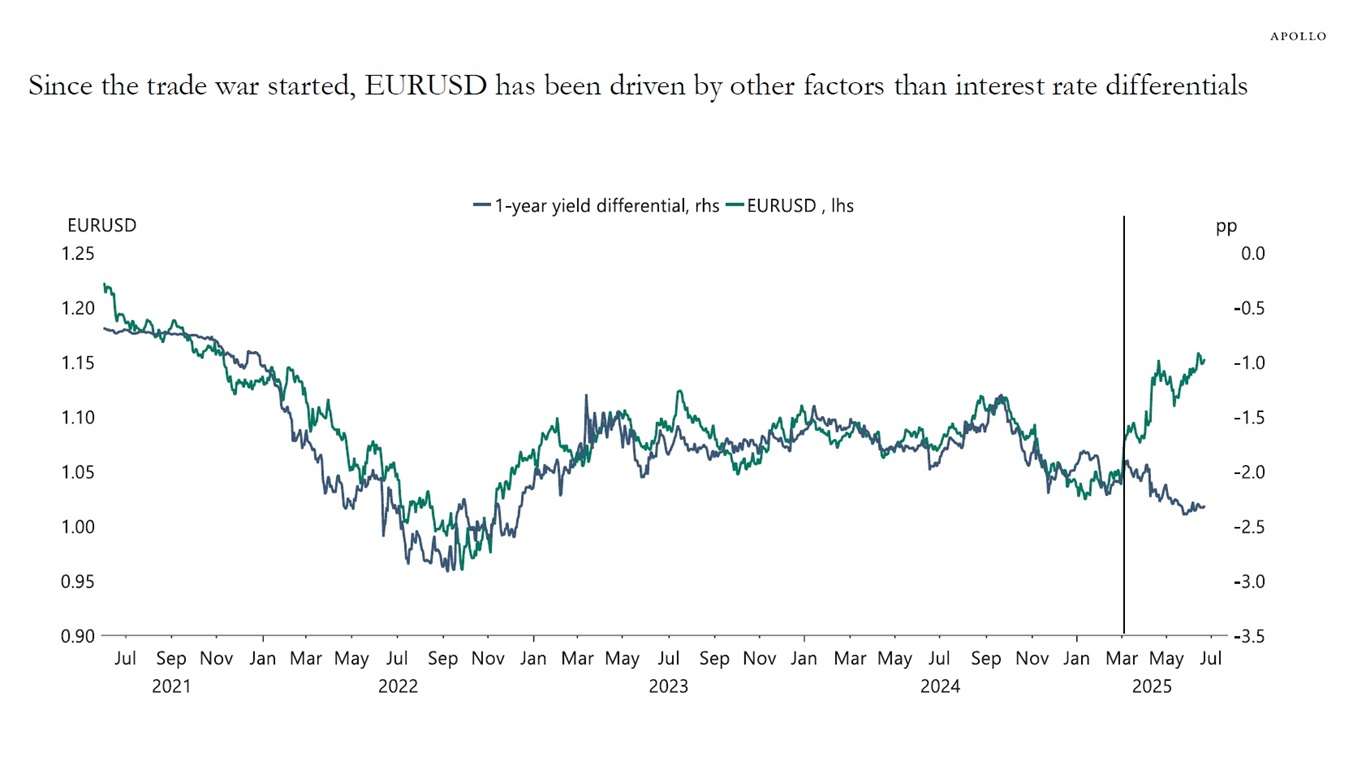
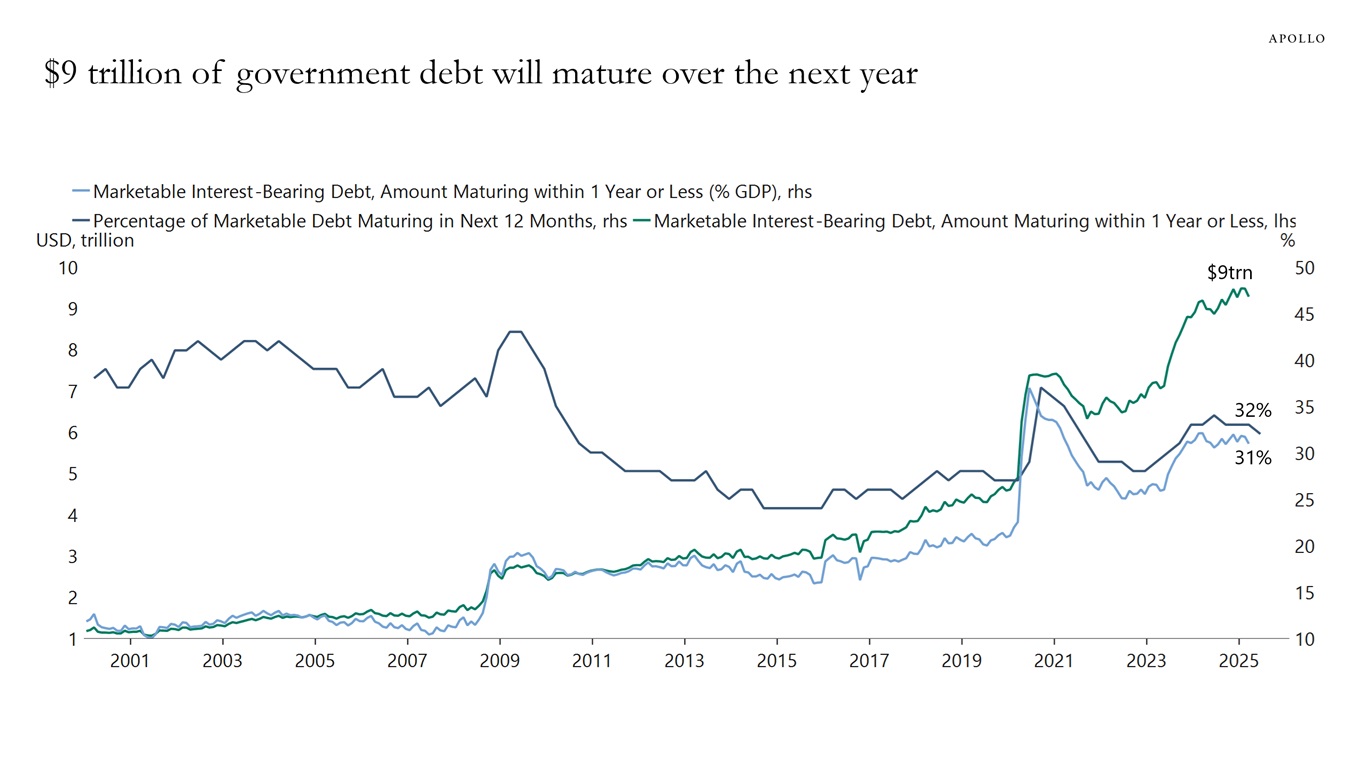
These charts, however, offer little comfort when considering the rising trend in debt-to-GDP, the increasing term premium, the falling dollar, and the $9 trillion that the US government needs to refinance over the next 12 months, see the following four charts below.

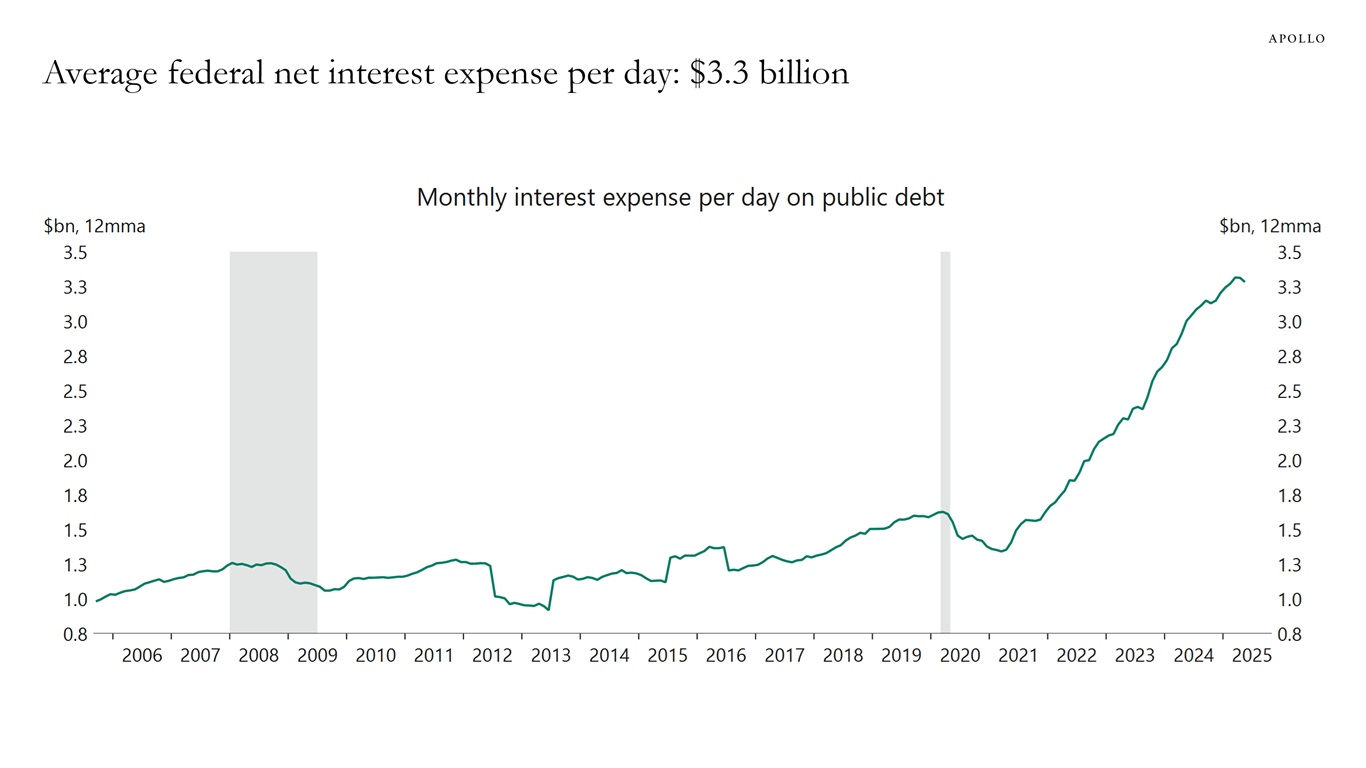
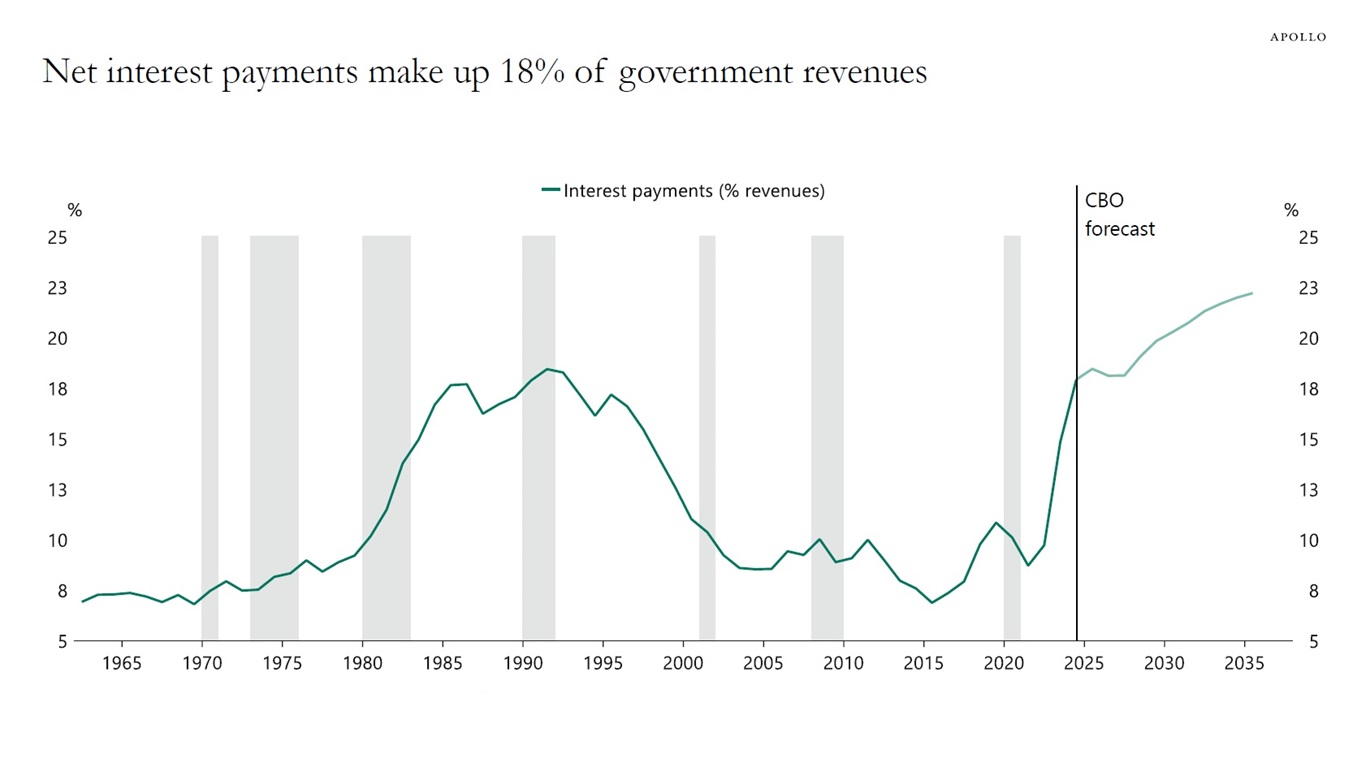
In particular, debt-servicing costs are rising rapidly, and the US government currently pays a record-high $3.3 billion in interest payments every day, and for every dollar the US government collects in tax revenue, about 20 cents go to paying interest on debt.

With debt levels growing much faster than GDP, the bottom line is that Treasury issuance will continue to grow faster than the economy, and the most likely outcome is that investors will demand compensation in the form of higher long-term interest rates.

In sum, there is upside pressure on short rates from higher oil prices, higher tariffs, and restrictions on immigration, and there is upside pressure on long rates because of fiscal challenges.

This is obviously very important for investors in both public and private markets.

Our updated chart book looking at demand and supply for US Treasuries is available here.

Auction sizes growing in 2025
Sources: Bureau of Public Debt, Haver Analytics, Apollo Chief Economist
Rising Treasury supply increases downside risks to bid-to-cover ratios
Sources: US Department of Treasury, Macrobond, Apollo Chief Economist
Rising Treasury supply increases downside risks to bid-to-cover ratios
Sources: US Department of Treasury, Macrobond, Apollo Chief Economist
10-year bond auction tails
Note: Bloomberg ticker USN10YTL Index. Sources: Bloomberg, Macrobond, Apollo Chief Economist
CBO: Under current policies, government debt outstanding will grow from 100% to 150% of GDP
Sources: US Congressional Budget Office (CBO), Macrobond, Apollo Chief Economist
Term premium in a longer perspective
Note: The NY Fed measure for the term premium is based on a five-factor, no arbitrage structure model. Sources: Federal Reserve Bank of New York, Macrobond, Apollo Chief Economist
Since the trade war started, EURUSD has been driven by other factors than interest rate differentials
Note: 1-year yield differential = 1-year German government bill minus 1-year US T-bill. pp = percentage points. Sources: Bloomberg, Macrobond, Apollo Chief Economist
$9 trillion of government debt will mature over the next year
Sources: US Department of Treasury, Macrobond, Apollo Chief Economist
Average federal net interest expense per day: $3.3 billion
Sources: US Treasury, Bloomberg, Macrobond, Apollo Chief Economist
Net interest payments make up 18% of government revenues
Sources: US Congressional Budget Office (CBO), Macrobond, Apollo Chief Economist

Download high-res chart book


This presentation may not be distributed, transmitted or otherwise communicated to others in whole or in part without the express consent of Apollo Global Management, Inc. (together with its subsidiaries, “Apollo”).  

Apollo makes no representation or warranty, expressed or implied, with respect to the accuracy, reasonableness, or completeness of any of the statements made during this presentation, including, but not limited to, statements obtained from third parties. Opinions, estimates and projections constitute the current judgment of the speaker as of the date indicated. They do not necessarily reflect the views and opinions of Apollo and are subject to change at any time without notice. Apollo does not have any responsibility to update this presentation to account for such changes. There can be no assurance that any trends discussed during this presentation will continue.   

Statements made throughout this presentation are not intended to provide, and should not be relied upon for, accounting, legal or tax advice and do not constitute an investment recommendation or investment advice. Investors should make an independent investigation of the information discussed during this presentation, including consulting their tax, legal, accounting or other advisors about such information. Apollo does not act for you and is not responsible for providing you with the protections afforded to its clients. This presentation does not constitute an offer to sell, or the solicitation of an offer to buy, any security, product or service, including interest in any investment product or fund or account managed or advised by Apollo. 

Certain statements made throughout this presentation may be “forward-looking” in nature. Due to various risks and uncertainties, actual events or results may differ materially from those reflected or contemplated in such forward-looking information. As such, undue reliance should not be placed on such statements. Forward-looking statements may be identified by the use of terminology including, but not limited to, “may”, “will”, “should”, “expect”, “anticipate”, “target”, “project”, “estimate”, “intend”, “continue” or “believe” or the negatives thereof or other variations thereon or comparable terminology.