Understanding Demand for Treasuries and Why the Yield Curve Is Steepening

Apollo Chief Economist

This chart book looks at demand and supply in the Treasury market, including recent developments in Treasury auction metrics. There are 10 conclusions:

1. For every $5 the government collects in taxes, a dollar goes to paying interest on debt.

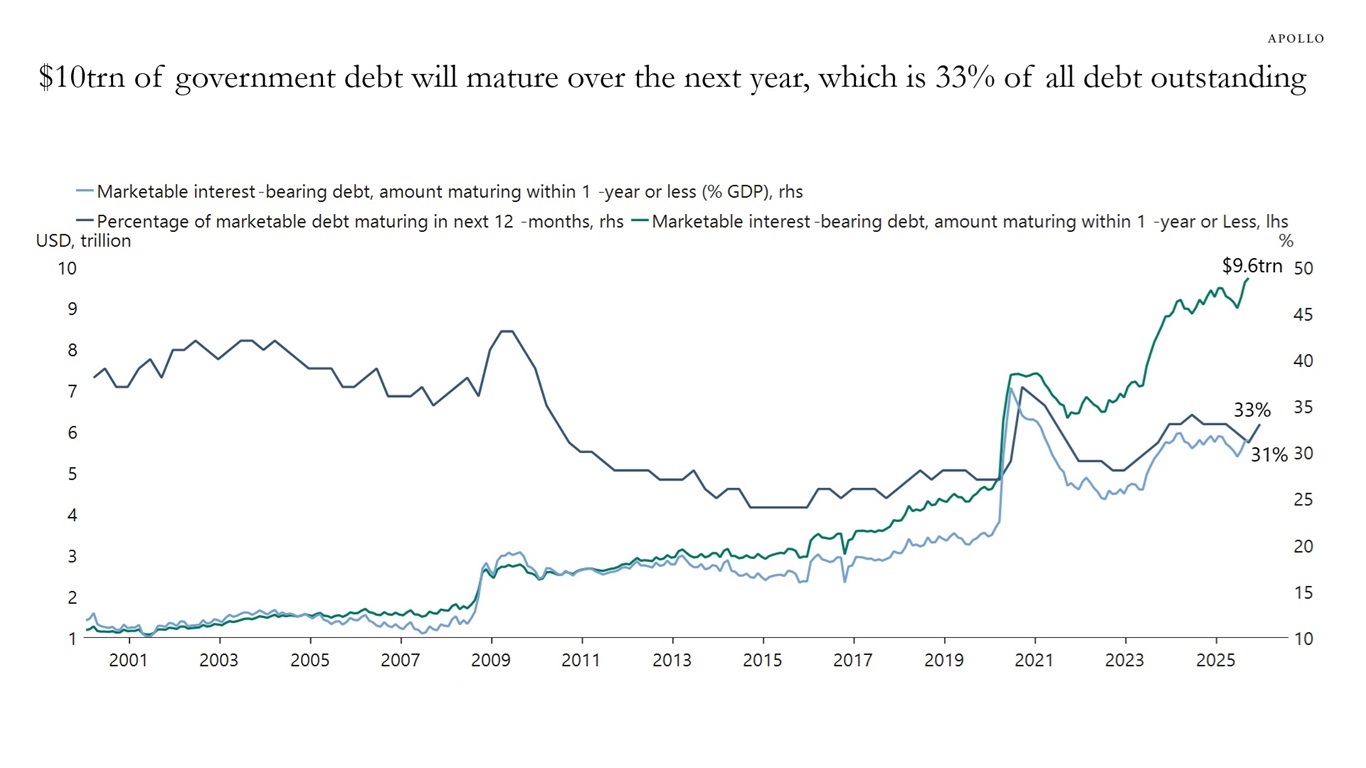
2. $10 trillion of government debt will mature over the next year, which is 33% of all debt outstanding.

3. The share of T-bills outstanding has increased to 22%, and 85% of Treasury gross issuance is T-bills.

4. The average federal net interest expense per day, including weekends, is now $3.5 billion.

5. Foreign ownership of Treasuries has declined to 25% of the total outstanding, down from 33% a decade ago.

6. Japan has been increasing its holdings of Treasuries while China has been lowering its holdings.

7. In Treasury auctions, tails and stop-through have been small and relatively balanced, implying that there is still solid demand across the curve.

8. Treasury auction metrics show that indirect bidding, often a proxy for foreign central bank demand, has been declining over the past year, particularly for notes.

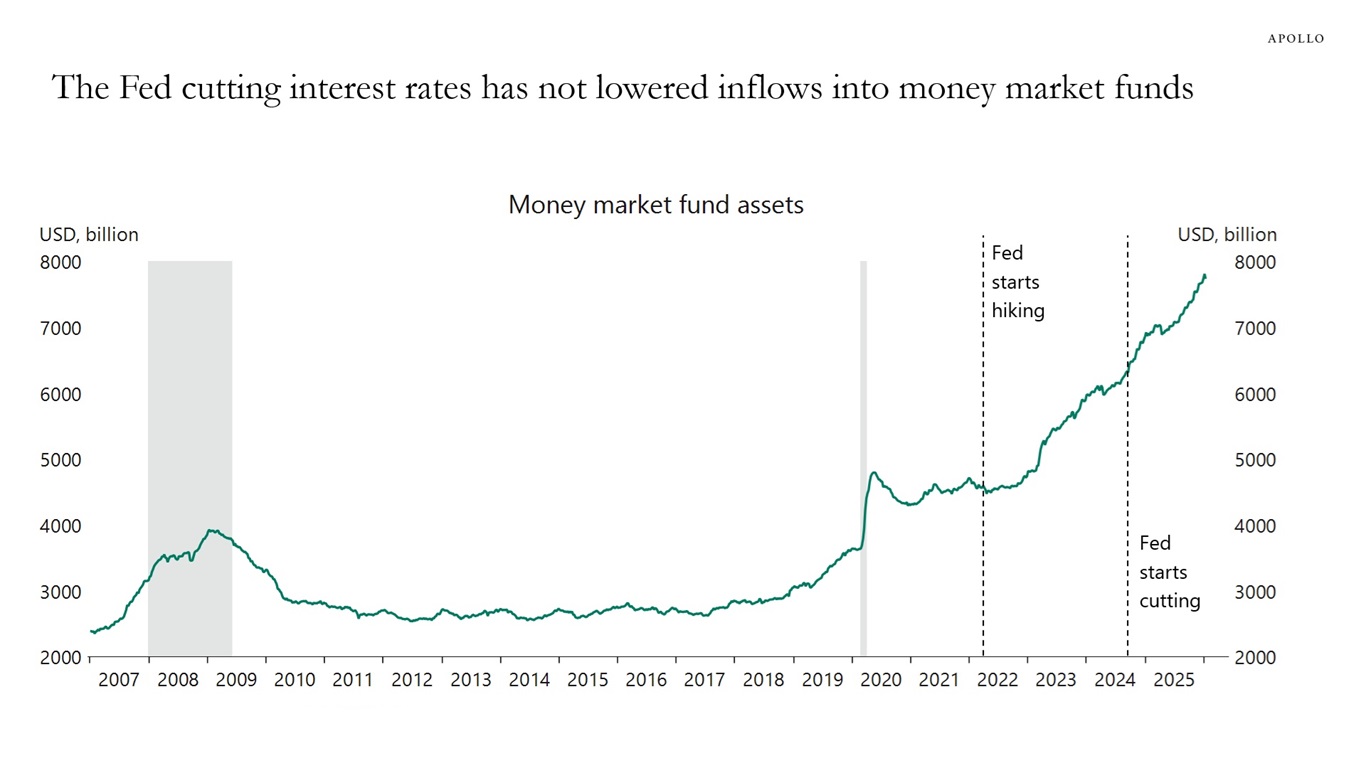
9. The Fed cutting interest rates has not lowered inflows into money market funds, implying that “money on the sidelines” is not as interest rate sensitive as many people think.

10. 89% of US government debt is fixed rate, and 22% of debt outstanding is in bills.

$10trn of government debt will mature over the next year, which is 33% of all debt outstanding
Sources: US Department of Treasury, Macrobond, Apollo Chief Economist
The Fed cutting interest rates has not lowered inflows into money market funds
Sources: Investment Company Institute (ICI), Macrobond, Apollo Chief Economist

Download high-res chart book


This presentation may not be distributed, transmitted or otherwise communicated to others in whole or in part without the express consent of Apollo Global Management, Inc. (together with its subsidiaries, “Apollo”).  

Apollo makes no representation or warranty, expressed or implied, with respect to the accuracy, reasonableness, or completeness of any of the statements made during this presentation, including, but not limited to, statements obtained from third parties. Opinions, estimates and projections constitute the current judgment of the speaker as of the date indicated. They do not necessarily reflect the views and opinions of Apollo and are subject to change at any time without notice. Apollo does not have any responsibility to update this presentation to account for such changes. There can be no assurance that any trends discussed during this presentation will continue.   

Statements made throughout this presentation are not intended to provide, and should not be relied upon for, accounting, legal or tax advice and do not constitute an investment recommendation or investment advice. Investors should make an independent investigation of the information discussed during this presentation, including consulting their tax, legal, accounting or other advisors about such information. Apollo does not act for you and is not responsible for providing you with the protections afforded to its clients. This presentation does not constitute an offer to sell, or the solicitation of an offer to buy, any security, product or service, including interest in any investment product or fund or account managed or advised by Apollo. 

Certain statements made throughout this presentation may be “forward-looking” in nature. Due to various risks and uncertainties, actual events or results may differ materially from those reflected or contemplated in such forward-looking information. As such, undue reliance should not be placed on such statements. Forward-looking statements may be identified by the use of terminology including, but not limited to, “may”, “will”, “should”, “expect”, “anticipate”, “target”, “project”, “estimate”, “intend”, “continue” or “believe” or the negatives thereof or other variations thereon or comparable terminology.