


Model Portfolios Need a Modern Makeover
Public markets now represent a shrinking slice of the real economy. So why do most model portfolios still look the same? In this new Apollo series, we explore how private markets can help enhance portfolio outcomes, using historical data and insights to reveal their potential impact in shifting the efficient frontier.
Traditional Portfolios Haven’t Kept Up with the Changing Economy
For decades, the 60/40 portfolio allocation model has been top-of-mind for long-term investors. This mix of public equities and fixed income was designed to balance growth and stability and provide the diversification benefits of assets with low correlation to each other. However, as more lending and credit creation take place in private markets, the traditional 60/40 model is becoming outdated. Now, a handful of mega-cap stocks drive public equity returns, while the rising correlation between public stocks and bonds has practically eroded the diversification benefits of the traditional 60/40 portfolio, leaving investors more exposed to systemic risks.
Public Markets Are Shrinking
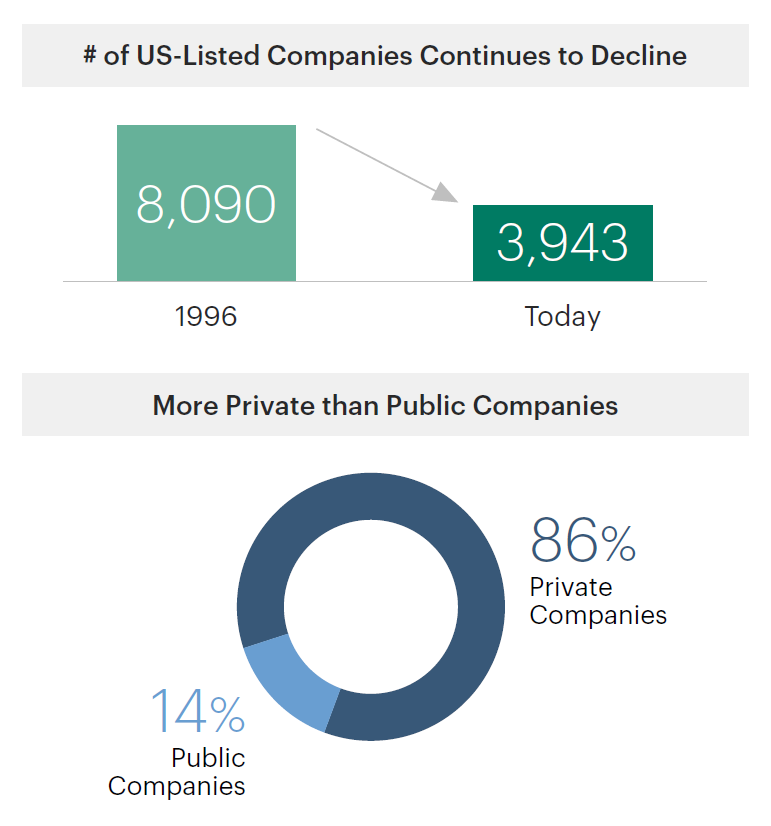
Sources: (Top) World Federation of Exchanges, World Bank as of June 30, 2025. Represents companies in the United States, Europe and Asia with LTM revenues greater than $100 million. (Bottom) WFE, PitchBook and World Bank as of December 2024.
Allocations to Private Markets Can Help Improve Outcomes
We believe the strategic inclusion of private markets is the next evolution of model portfolios. Our analysis shows that by incorporating private market investments, model portfolios have the potential to demonstrate improved risk-adjusted outcomes and diversification benefits all the while meeting a range of investment goals. From 4Q06 to 2Q25, a traditional 60/40 portfolio of public stocks and bonds returned just 7.3% on an annualized basis. Adding private markets to this 60/40 portfolio incrementally increased returns and lowered risk over this same time period, with a portfolio of 100% private markets delivering a 10.3% annualized return.
Shifting the Efficient Frontier with Private Markets
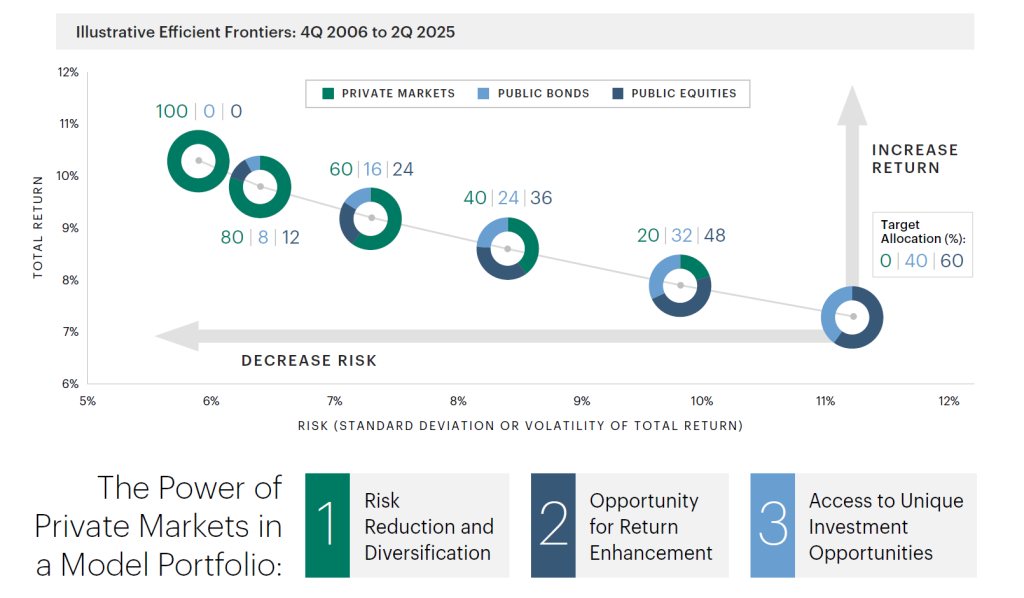
For illustrative purposes only. Past performance is not indicative of future results. The returns referenced above do not reflect any actual portfolio. Diversification does not ensure or protect against loss. This analysis uses indices from 4Q 2006 to 2Q 2025 (rebalanced quarterly). Public Equities include S&P 500, Russell 2000, and MSCI ACWI ex-US IMI. Public Bonds include Bloomberg US Aggregate Index, Bloomberg Corporate High Yield, and Morningstar LSTA Levered Loan Index. Private Markets include Preqin Private Equity, Preqin Secondaries , Preqin Infrastructure, Preqin Real Estate, Preqin Private Debt, and Cliffwater CDLI. Nothing herein is intended to imply that investments in private markets are considered “conservative,” “safe,” “risk free,” or “risk averse.” Please see the disclosures at the end of this document for more information about the model portfolio methodology
The information herein is provided for educational purposes only and should not be construed as financial or investment advice, nor should any information in this document be relied on when making an investment decision. Opinions and views expressed reflect the current opinions and views of the authors and Apollo Analysts as of the date hereof and are subject to change. Please see the end of this document for important disclosure information.
Important Disclosure Information
This presentation is for educational purposes only and should not be treated as research. This presentation may not be distributed, transmitted or otherwise communicated to others, in whole or in part, without the express written consent of Apollo Global Management, Inc. (together with its subsidiaries, “Apollo”).
The views and opinions expressed in this presentation are the views and opinions of the author(s) of the White Paper. They do not necessarily reflect the views and opinions of Apollo and are subject to change at any time without notice. Further, Apollo and its affiliates may have positions (long or short) or engage in securities transactions that are not consistent with the information and views expressed in this presentation. There can be no assurance that an investment strategy will be successful. Historic market trends are not reliable indicators of actual future market behavior or future performance of any particular investment which may differ materially, and should not be relied upon as such. Target allocations contained herein are subject to change. There is no assurance that the target allocations will be achieved, and actual allocations may be significantly different than that shown here. This presentation does not constitute an offer of any service or product of Apollo. It is not an invitation by or on behalf of Apollo to any person to buy or sell any security or to adopt any investment strategy, and shall not form the basis of, nor may it accompany nor form part of, any right or contract to buy or sell any security or to adopt any investment strategy. Nothing herein should be taken as investment advice or a recommendation to enter into any transaction.
Hyperlinks to third-party websites in this presentation are provided for reader convenience only. There can be no assurance that any trends discussed herein will continue. Unless otherwise noted, information included herein is presented as of the dates indicated. This presentation is not complete and the information contained herein may change at any time without notice. Apollo does not have any responsibility to update the presentation to account for such changes. Apollo has not made any representation or warranty, expressed or implied, with respect to fairness, correctness, accuracy, reasonableness, or completeness of any of the information contained herein, and expressly disclaims any responsibility or liability therefore. The information contained herein is not intended to provide, and should not be relied upon for, accounting, legal or tax advice or investment recommendations. Investors should make an independent investigation of the information contained herein, including consulting their tax, legal, accounting or other advisors about such information. Apollo does not act for you and is not responsible for providing you with the protections afforded to its clients.
Certain information contained herein may be “forward-looking” in nature. Due to various risks and uncertainties, actual events or results may differ materially from those reflected or contemplated in such forward-looking information. As such, undue reliance should not be placed on such information. Forward-looking statements may be identified by the use of terminology including, but not limited to, “may”, “will”, “should”, “expect”, “anticipate”, “target”, “project”, “estimate”, “intend”, “continue” or “believe” or the negatives thereof or other variations thereon or comparable terminology.
The Standard & Poor’s 500 (“S&P 500”) Index is a market-capitalization-weighted index of the 500 largest U.S. publicly traded companies by market value.
Additional information may be available upon request.