


Want it delivered daily to your inbox?
-
The average daily US equity market turnover now exceeds $1 trillion, driven by higher retail participation, more high-frequency trading and recent tech-sector volatility, see chart below.
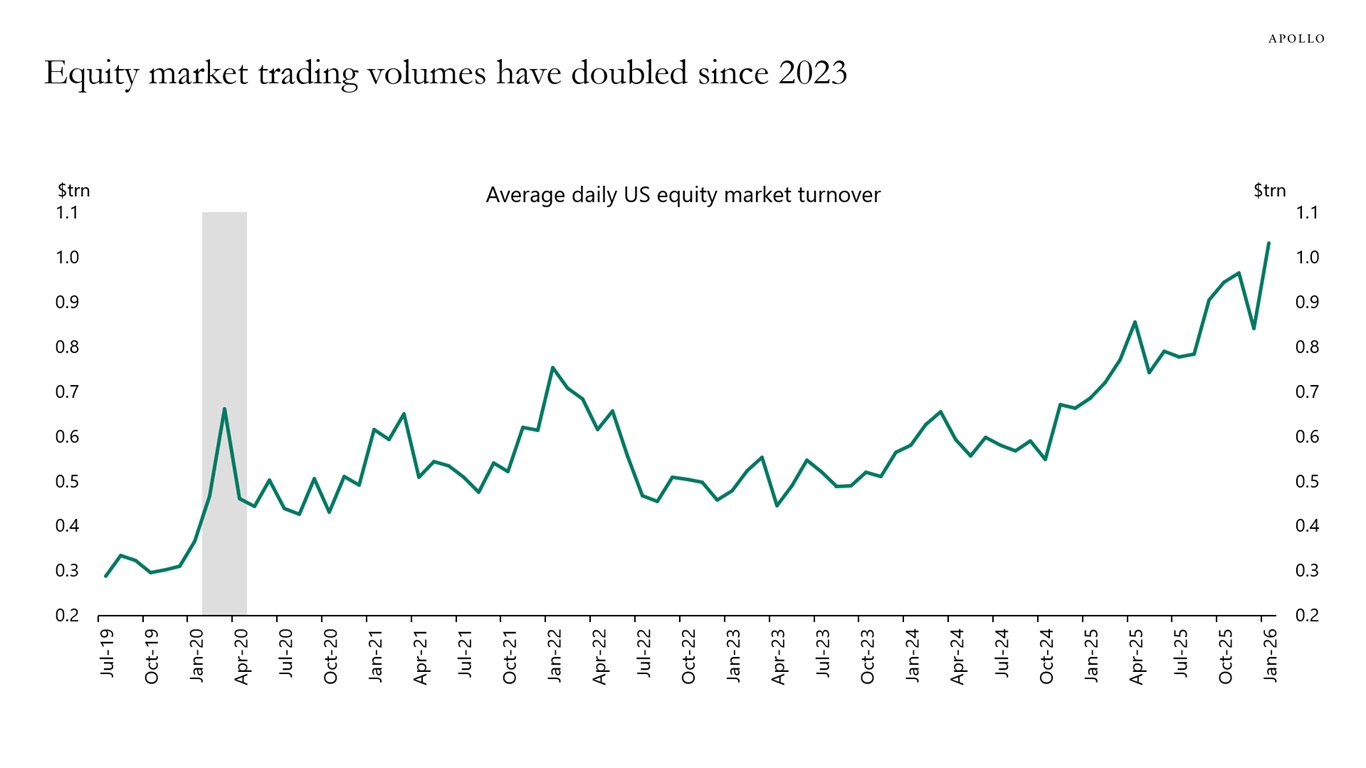
Sources: Bloomberg, Apollo Chief Economist See important disclaimers at the bottom of the page.
-
Economic research institutions have identified sectors and occupations that are likely to be vulnerable to AI, see for example here, here and here.
But employment declines in AI-exposed industries since 2022 are being overattributed to ChatGPT, see the first chart below.
Since late 2022, those same industries have also been hit by three major overlapping shocks: Fed tightening, trade-war uncertainty and a meaningful slowdown in immigration-driven labor supply.
The bottom line is that a large share of the AI-sensitive sectors of the economy is also rate, trade or immigration-sensitive, see the second chart.
Hence, the slowdown in employment in AI-exposed sectors is likely driven by some combination of all these factors rather than only AI.
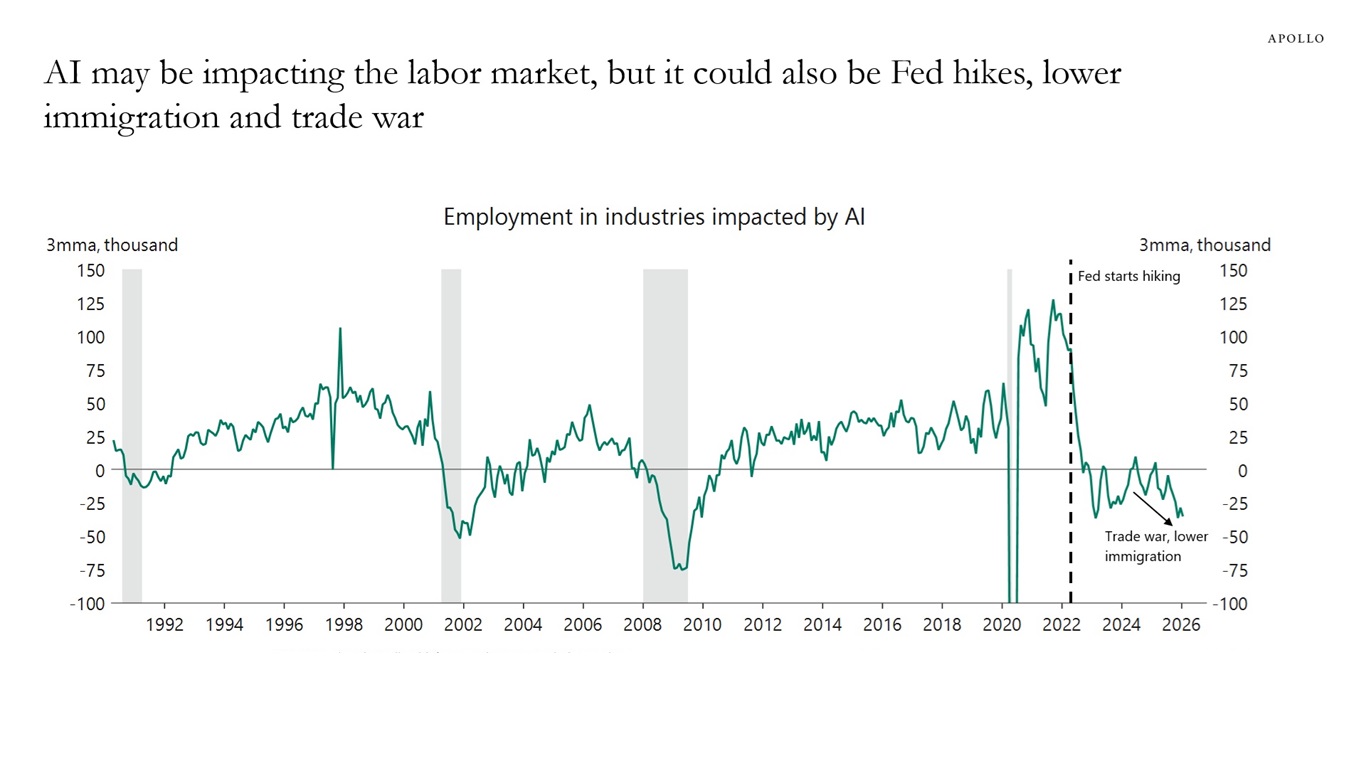
Note: Includes employment in professional & business services, office & administrative services, accounting & book keeping, legal services, computer systems design, public relations, publishing, broadcasting, data processing & hosting, credit intermediation, insurance, warehousing & storage, couriers & messengers, transportation support services, telecommunications, medical & diagnostic laboratories and motion picture & sound recording industries. Sources: US Bureau of Labor Statistics (BLS), Macrobond, Apollo Chief Economist 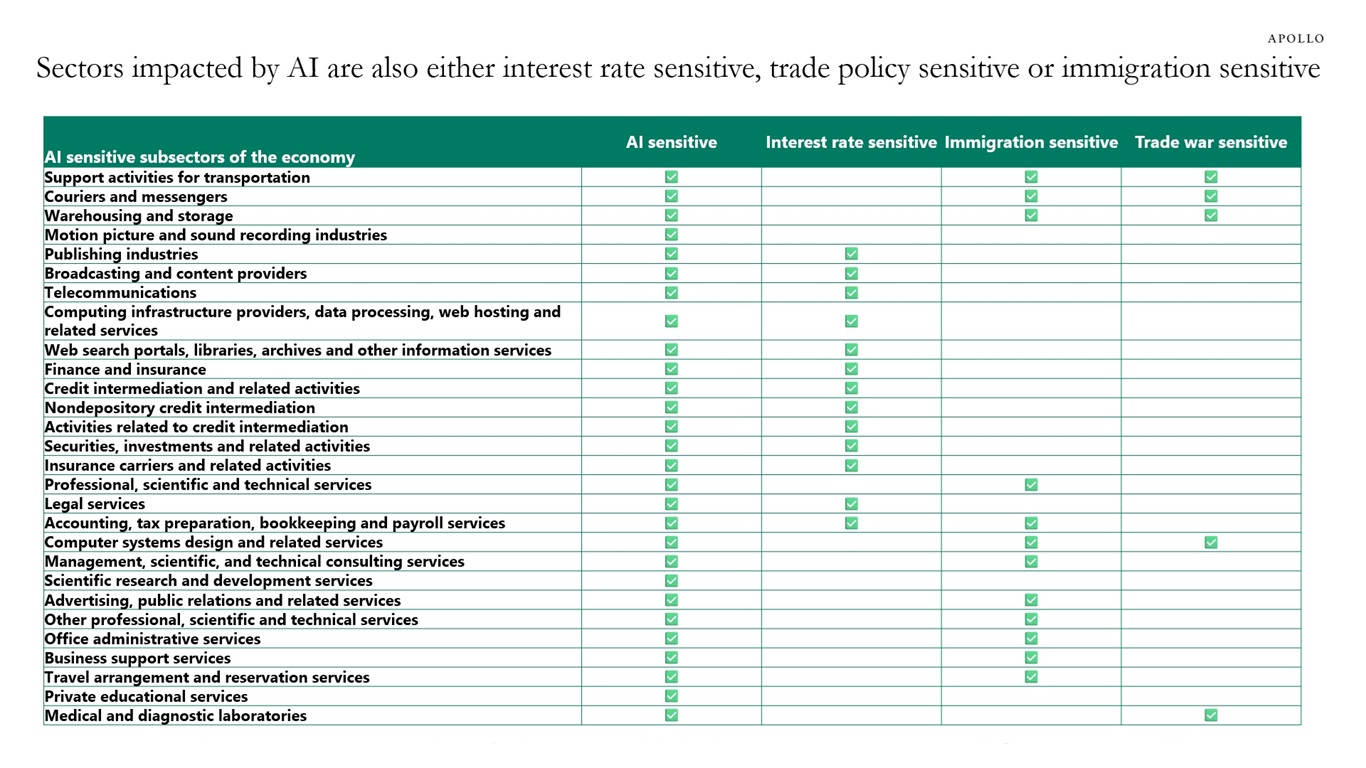
Source: Apollo Chief Economist, Fed: Educational Exposure to Generative Artificial Intelligence, https://www.federalreserve.gov/econres/notes/feds-notes/educational-exposure-to-generative-artificial-intelligence-20250226.html, February 2025 See important disclaimers at the bottom of the page.
-
The share of S&P 500 names moving more than 10% in a single day has increased, and high dispersion and low implied correlation suggest stocks are increasingly trading on their own fundamentals, see charts below. At the same time, options activity remains extremely elevated, consistent with heavy retail speculation and leverage-like exposure. Larger idiosyncratic moves and outsized options participation leave the market structure more fragile and more vulnerable to an abrupt, outsized move.
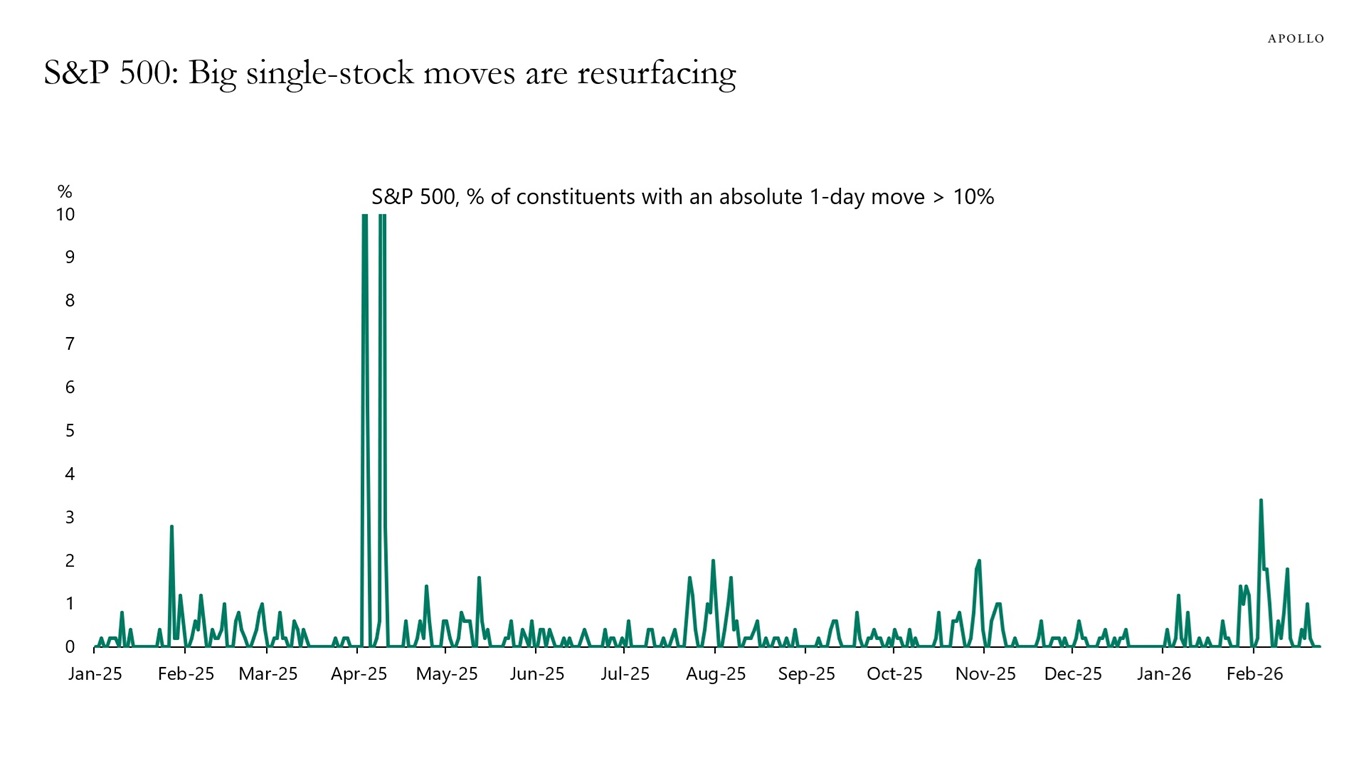
Sources: Bloomberg, Apollo Chief Economist 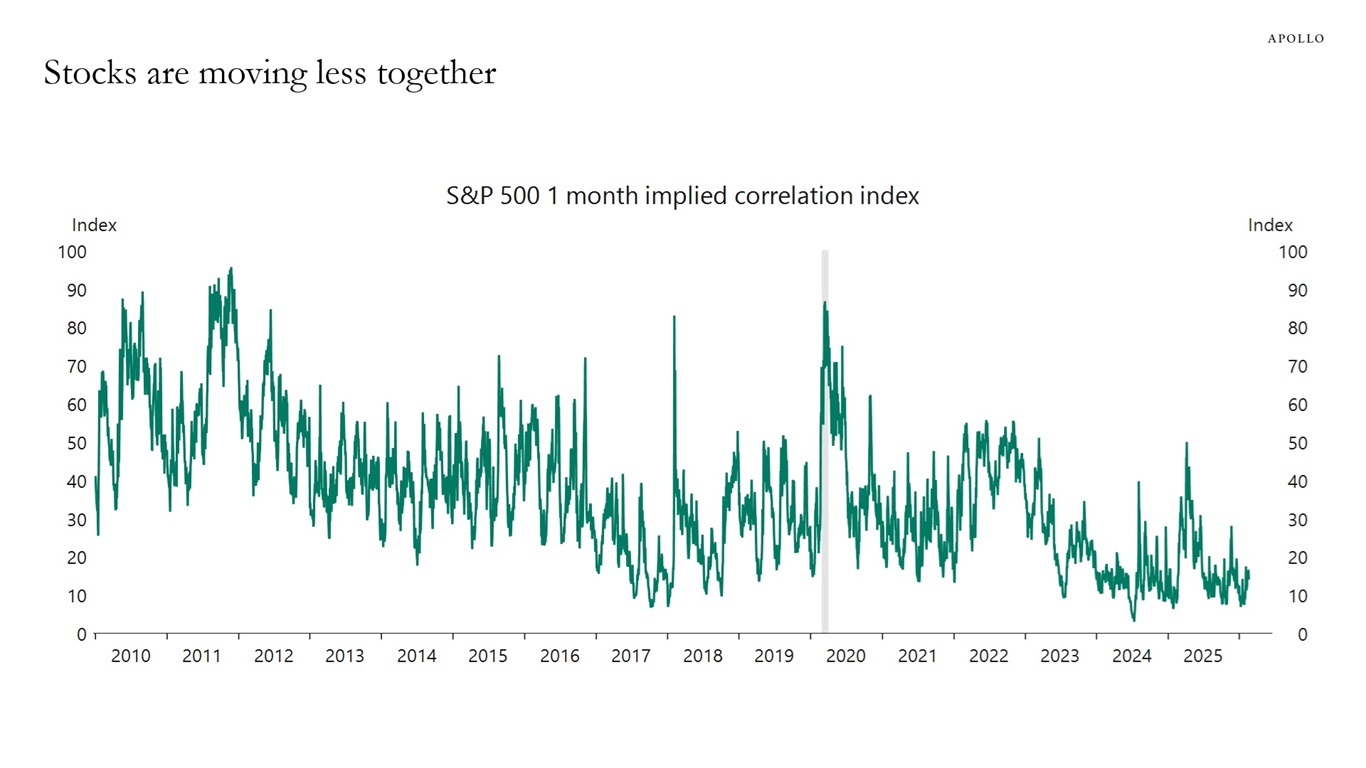
Note: It is the option-implied estimate of average pairwise correlation among S&P 500 constituents over one month. Sources: Bloomberg, Macrobond, Apollo Chief Economist 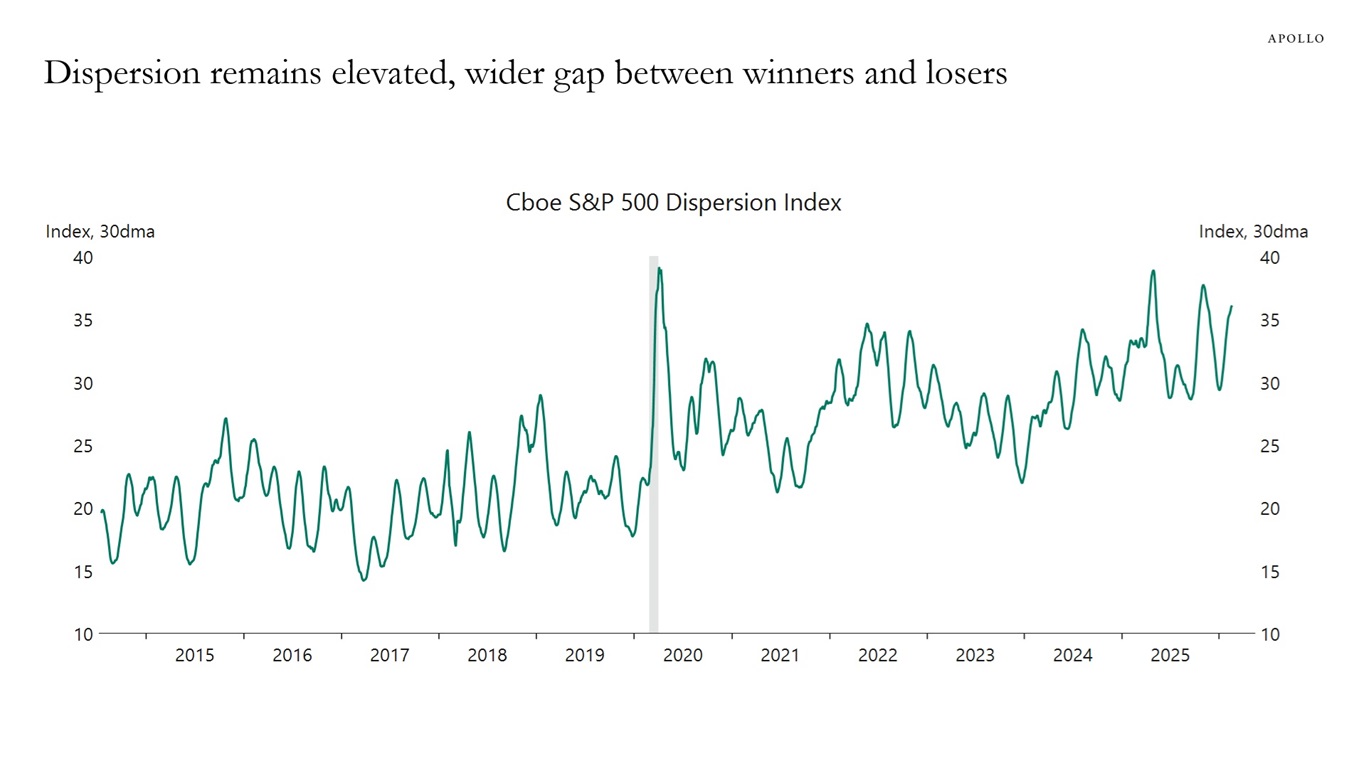
Sources: Bloomberg, Macrobond, Apollo Chief Economist 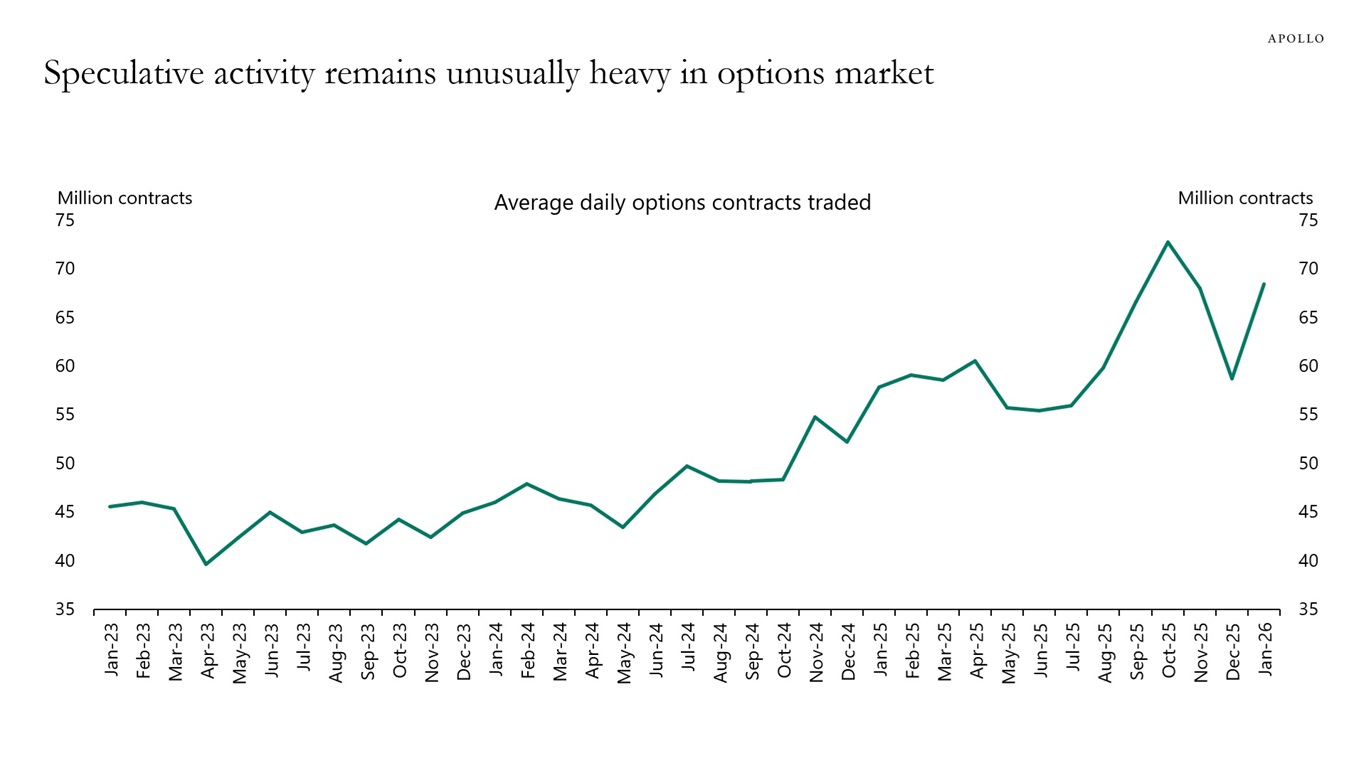
Sources: Bloomberg, Apollo Chief Economist See important disclaimers at the bottom of the page.
-
The US economy continues to perform well. But the tail risks have increased from 10% to 30%.
What could suddenly change the current situation?
It could be geopolitics, government debt levels or a rapid rise or fall in interest rates.
Predicting the future path of AI adoption and productivity is particularly challenging.
The contribution to GDP growth from AI spending continues to increase, and as a result, if AI fails to meet expectations, the recession probability will rise, see chart below.
Similarly, if AI were to trigger a sharp rise in unemployment, it could also have a disruptive impact on the economy and financial markets.
We remain constructive on the US economic outlook, but investors should pay closer attention to tail risks than usual, because the risk of a sudden shift in investor sentiment is rising.
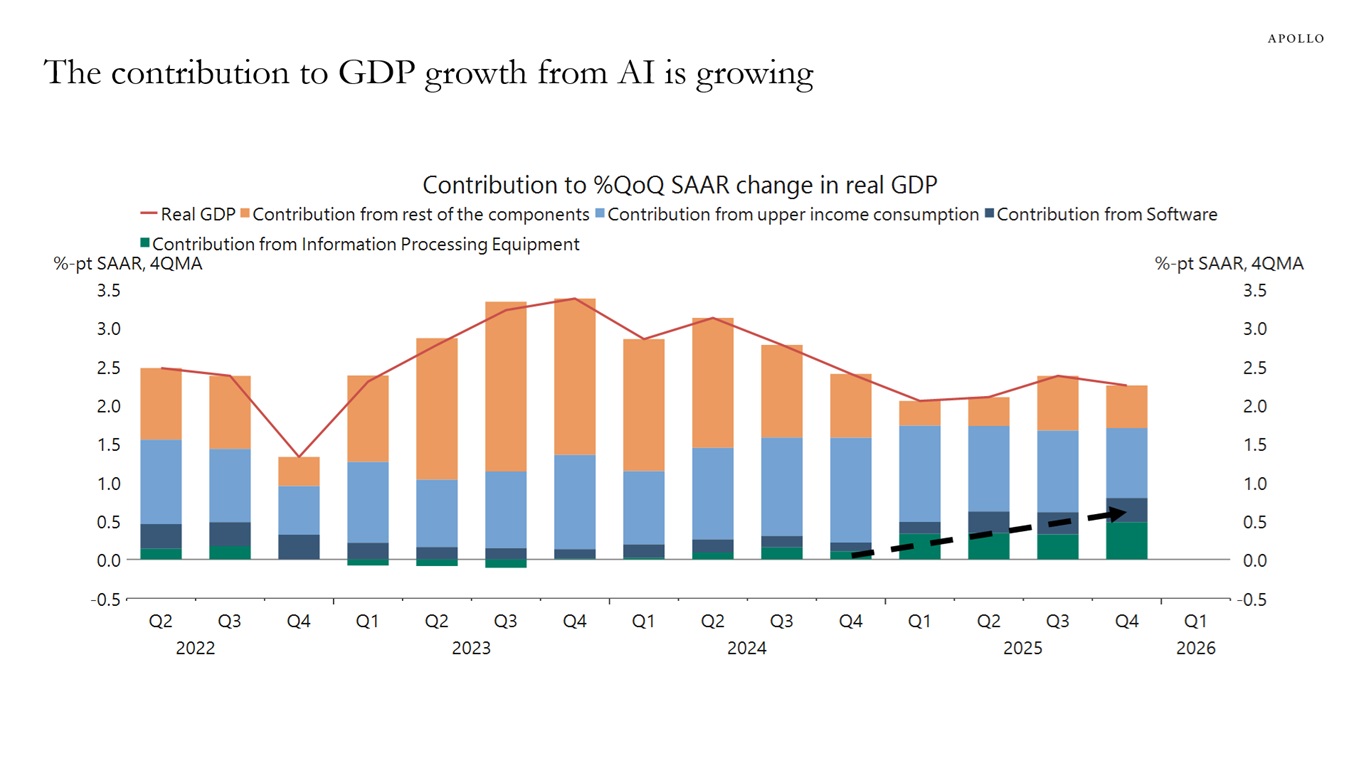
Note: Assuming upper income constitutes 60% consumption. Sources: US Bureau of Economic Analysis (BEA), Macrobond, Apollo Chief Economist See important disclaimers at the bottom of the page.
-
The appetite for buying gold has increased significantly in recent months in India, see chart below.
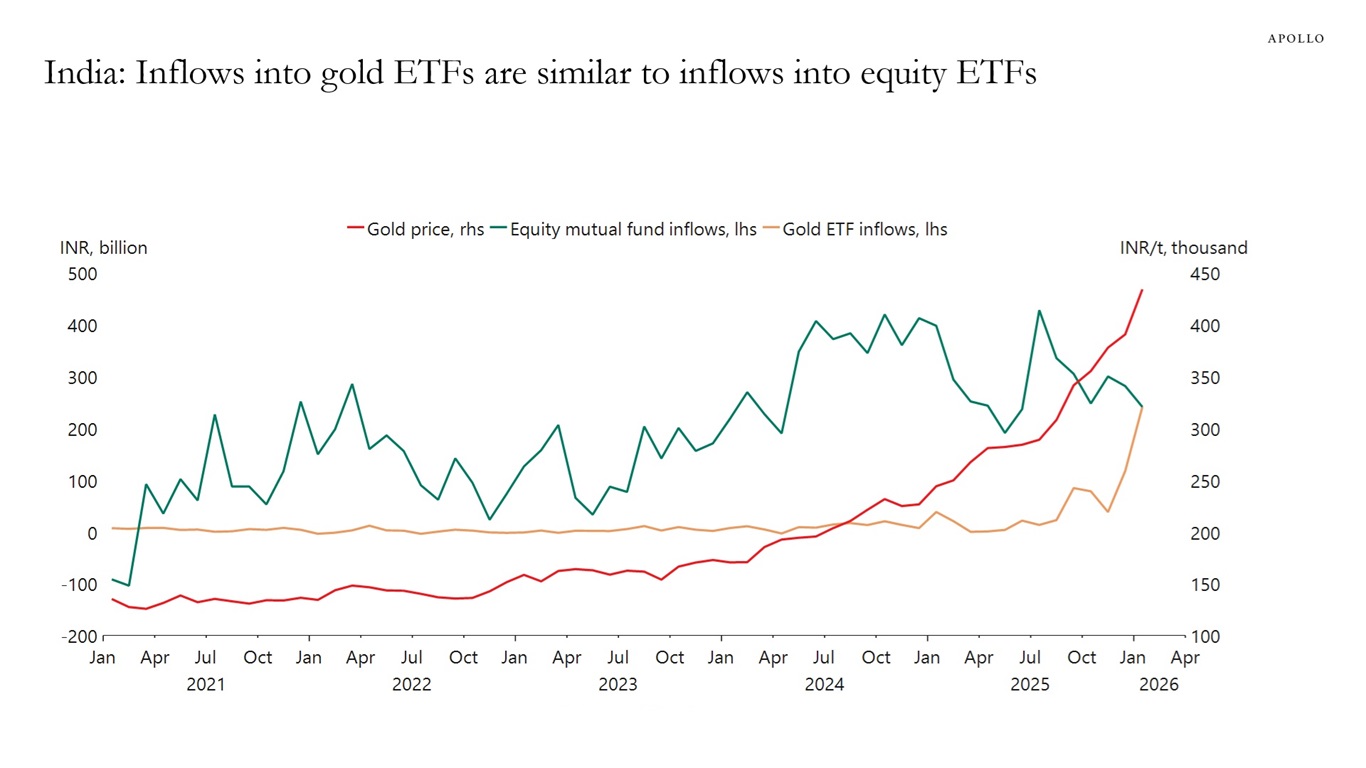
Note: Gold prices are INR per troy ounce. Sources: Association of Mutual Funds in India, Macrobond, Apollo Chief Economist See important disclaimers at the bottom of the page.
-
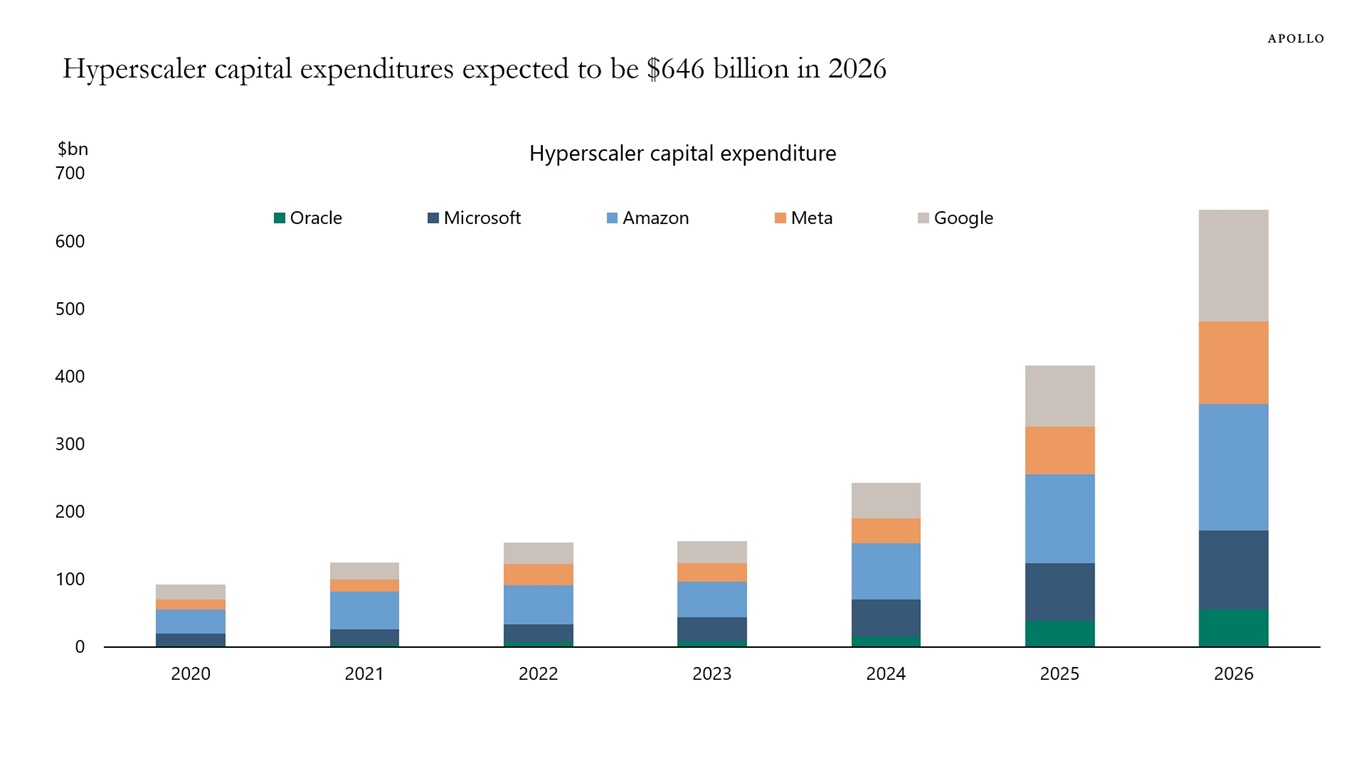
The amount of money being spent on capex by hyperscalers is enormous at around $646 billion in 2026.
The charts in this chart book put that number into perspective.
Specifically:
- Hyperscaler capex is expected in 2026 to be at approximately $646 billion, or about 2% of US GDP.
- For comparison, annual growth in consumer spending is currently around $1 trillion.
- US hyperscaler capex at $646 billion is roughly equivalent to the size of GDP for Singapore, Sweden and Argentina.
- For comparison, total US bank loan growth in 2025 was around $700 billion.
- For comparison, defense spending in 2025 was at $917 billion.
- Hyperscaler capex is more than the combined military spending of Germany, France, UK, Japan, Italy and Canada.
- Hyperscaler capex is roughly the same size as the market cap of the stock markets in Belgium, Denmark and Indonesia.
Sources: FactSet, Apollo Chief Economist See important disclaimers at the bottom of the page.
-
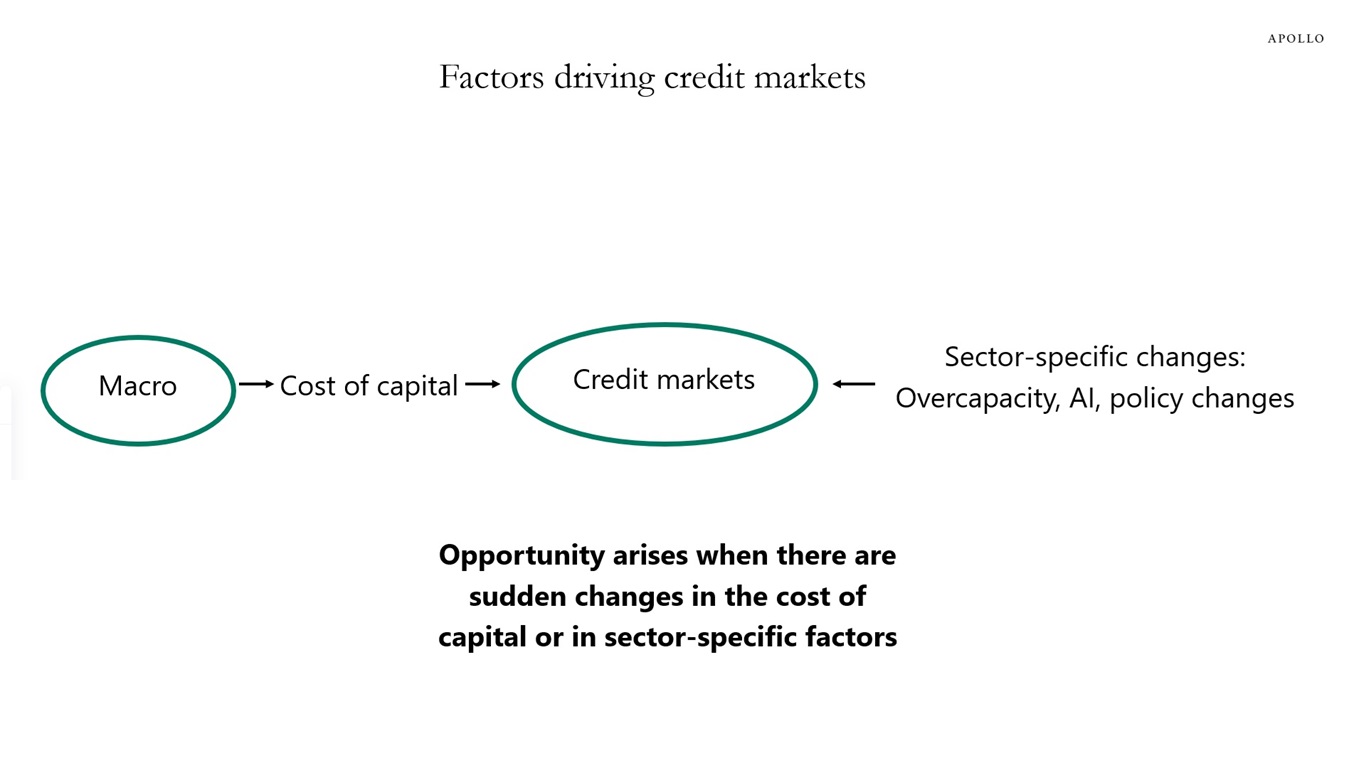
If the economy enters a recession, it is a problem for all credit markets. But there are also situations where only one sector is hit by some shock, while the rest of the economy is fine.
This is the situation we are in today with software.
For software, the problem is not only the threat from AI but also the rise in the cost of capital following the Fed’s 2022 interest rate hikes.
History is full of episodes where changes in the cost of capital and sector-specific factors have created opportunities in credit markets, see chart below. For example, the energy credit cycle from 2014 to 2016, the brick-and-mortar retail cycle from 2016 to 2019 and the commercial real estate cycle from 2022 to 2024.
The bottom line is that individual sectors of the economy can be in distress while the rest remain fine. In fact, that is what creative destruction and disruption are all about.
In short: In a capitalist economy where new products are invented every day, the only constant is change, and that is where opportunities arise for credit investors.
Source: Apollo Chief Economist See important disclaimers at the bottom of the page.
-
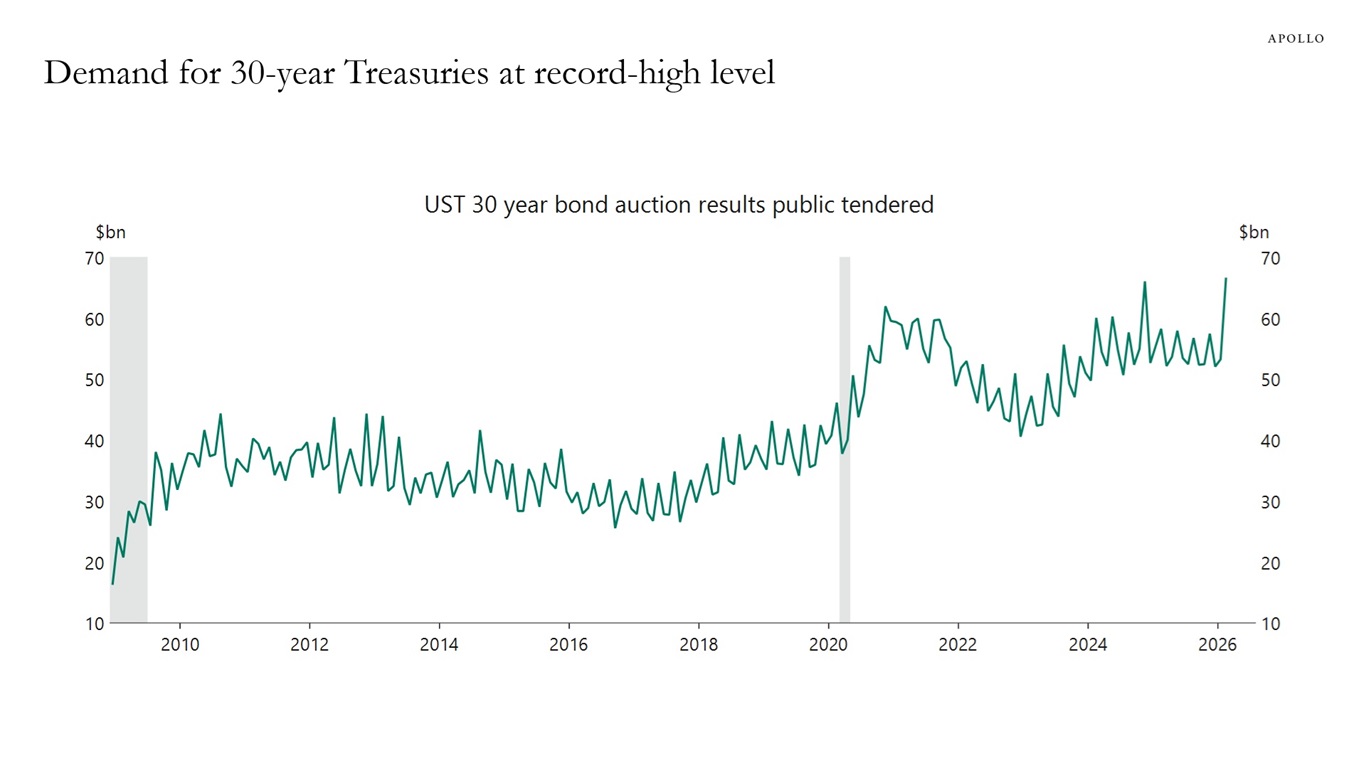
The latest 30-year Treasury auction shows continued strong buying of US duration with public tendered demand at the highest level on record, see chart below. Indirect bidders, who are normally a proxy for foreign demand, took 69.8%, well above the historical average at 64%. Primary dealers, who have to buy what others don’t, were left with only 5.9%. The bottom line is that Treasury auction metrics show that there continues to be very solid demand for the long end in US Treasuries.
Sources: Bloomberg, Macrobond, Apollo Chief Economist See important disclaimers at the bottom of the page.
-
The private sector in the US is in really good shape. Households have been deleveraging since the 2008 financial crisis, see the first chart. The corporate sector has been deleveraging since COVID, see the second chart.
Unfortunately, the government balance sheet is not in good shape. Government debt to GDP has increased steadily from 40% of GDP in 2007 to more than 100% today, see the third chart.
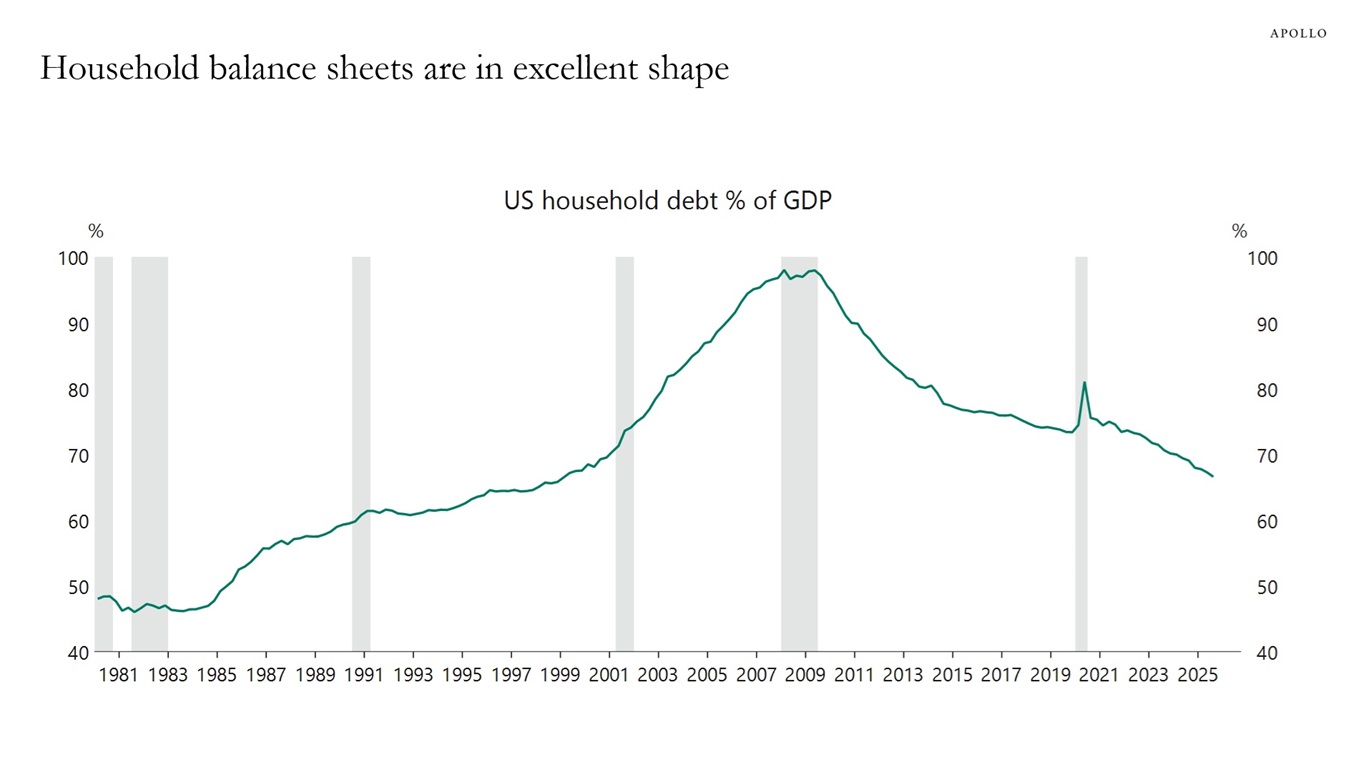
Sources: Federal Reserve, US Bureau of Economic Analysis (BEA), Macrobond, Apollo Chief Economist 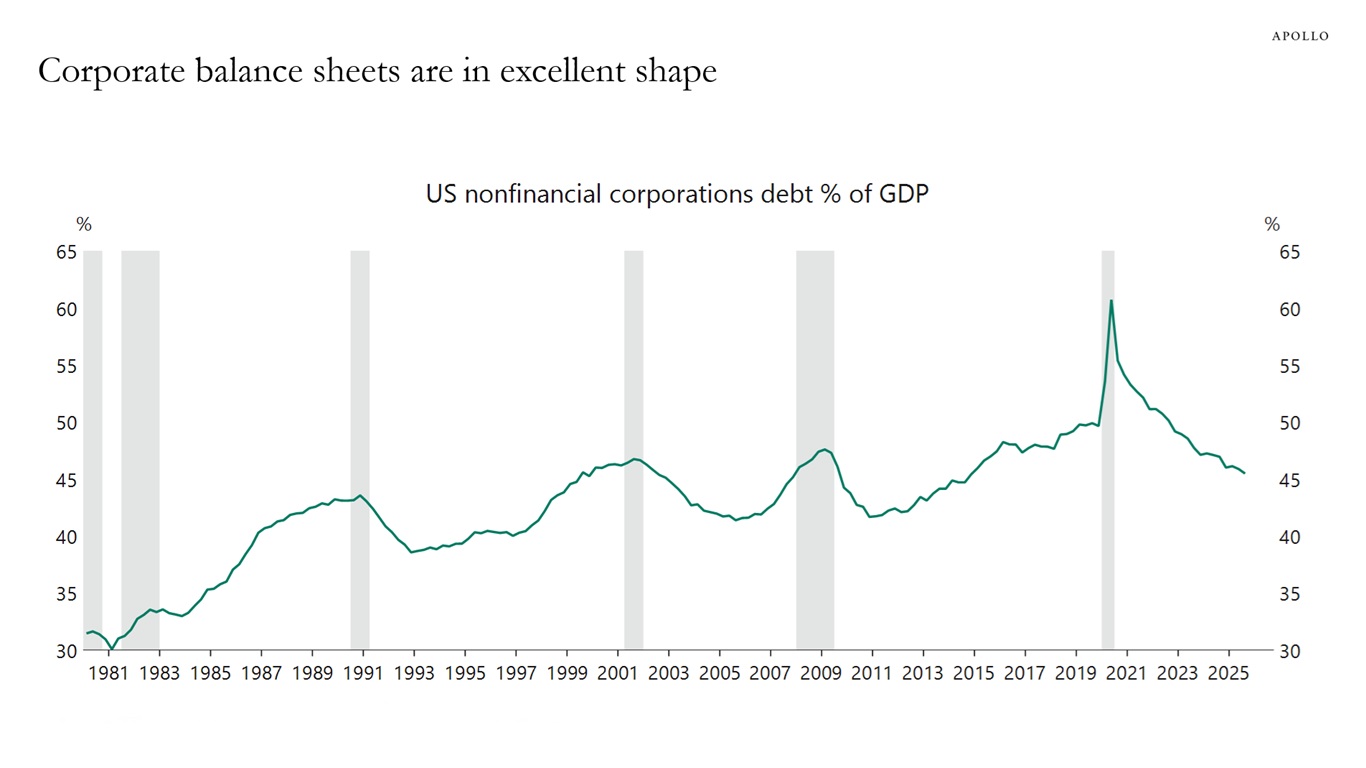
Sources: Federal Reserve, US Bureau of Economic Analysis (BEA), Macrobond, Apollo Chief Economist 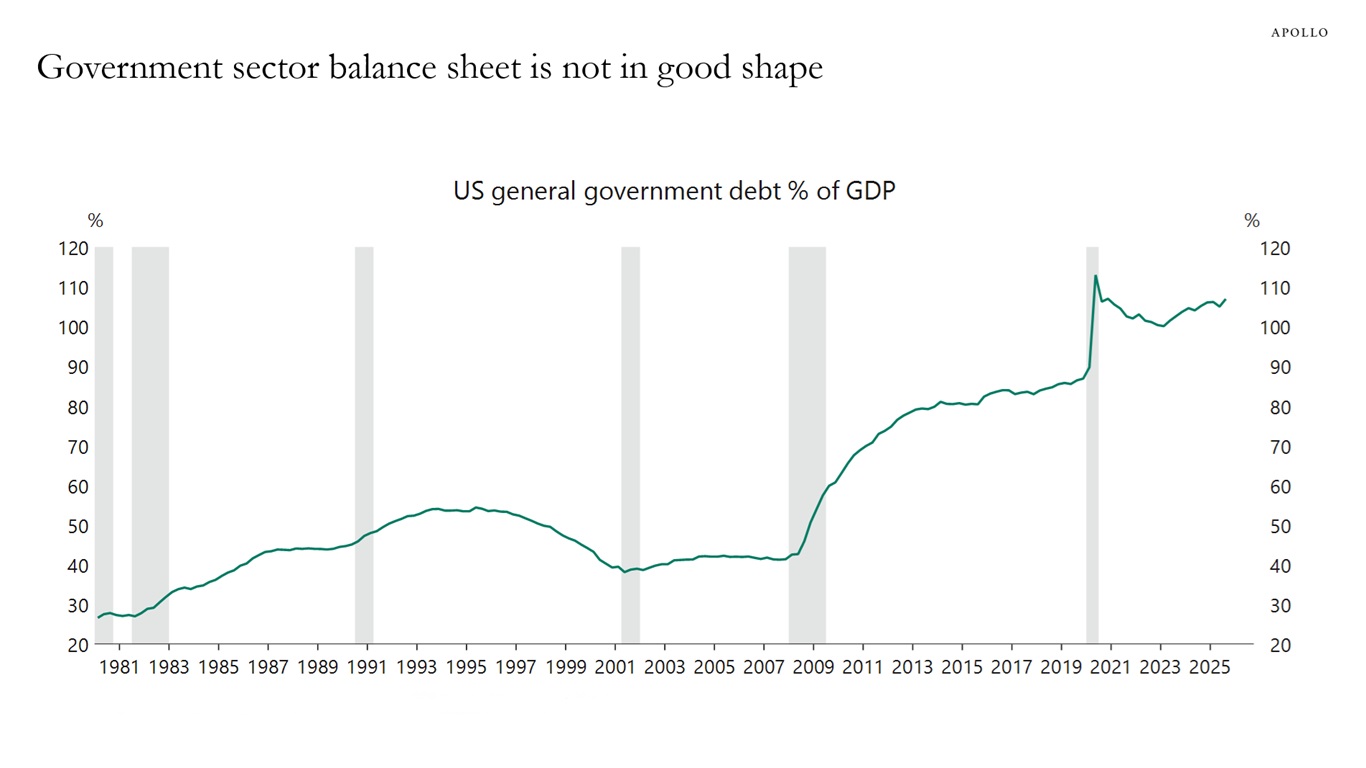
Sources: Federal Reserve, US Bureau of Economic Analysis (BEA), Macrobond, Apollo Chief Economist See important disclaimers at the bottom of the page.
-
A unicorn is a privately owned company valued at more than $1 billion, and over the past decade, the number of unicorns has increased from 114 to 857, see chart below.
With a growing number of privately owned large companies, today there is a bigger need than ever before for private debt and equity solutions for both performing and distressed firms.
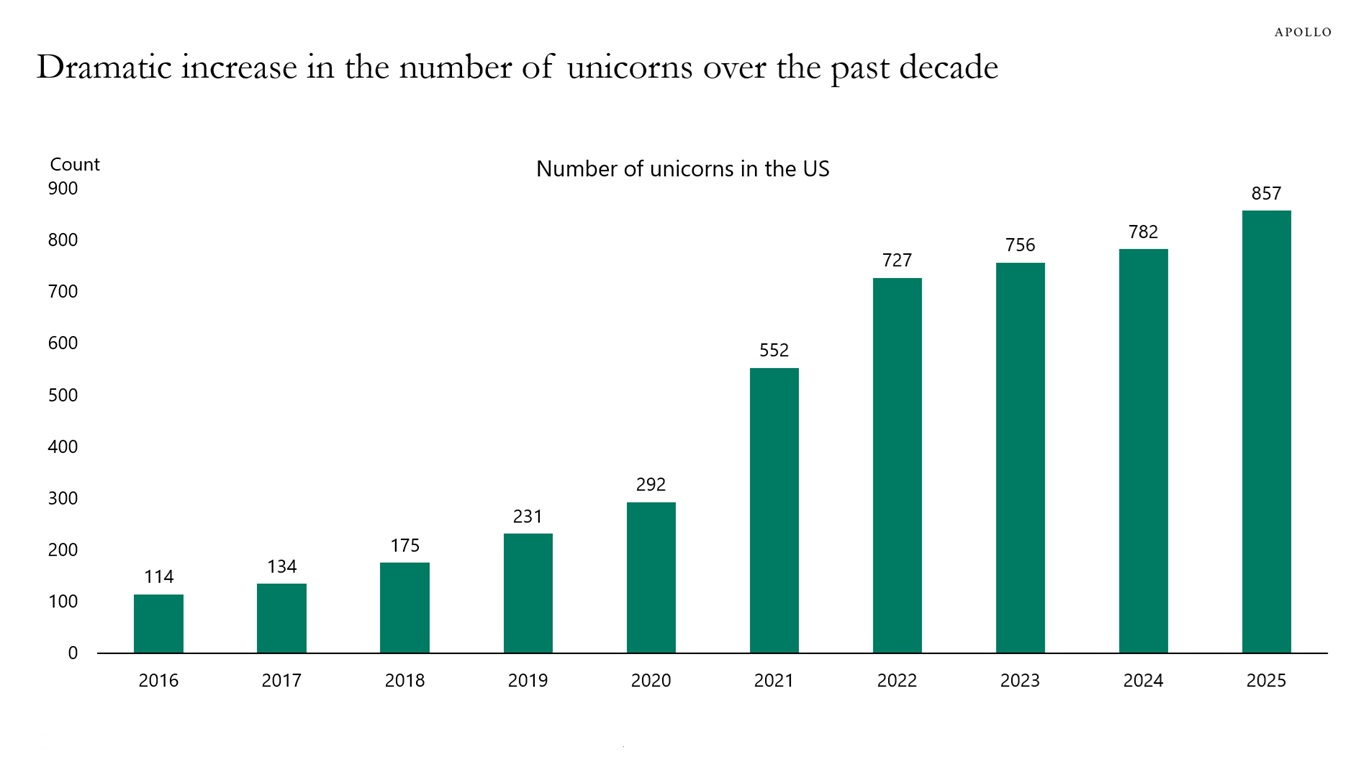
Note: The term unicorn describes startups that are privately held and valued at more than $1 billion. Sources: PitchBook, Apollo Chief Economist See important disclaimers at the bottom of the page.

This presentation may not be distributed, transmitted or otherwise communicated to others in whole or in part without the express consent of Apollo Global Management, Inc. (together with its subsidiaries, “Apollo”).
Apollo makes no representation or warranty, expressed or implied, with respect to the accuracy, reasonableness, or completeness of any of the statements made during this presentation, including, but not limited to, statements obtained from third parties. Opinions, estimates and projections constitute the current judgment of the speaker as of the date indicated. They do not necessarily reflect the views and opinions of Apollo and are subject to change at any time without notice. Apollo does not have any responsibility to update this presentation to account for such changes. There can be no assurance that any trends discussed during this presentation will continue.
Statements made throughout this presentation are not intended to provide, and should not be relied upon for, accounting, legal or tax advice and do not constitute an investment recommendation or investment advice. Investors should make an independent investigation of the information discussed during this presentation, including consulting their tax, legal, accounting or other advisors about such information. Apollo does not act for you and is not responsible for providing you with the protections afforded to its clients. This presentation does not constitute an offer to sell, or the solicitation of an offer to buy, any security, product or service, including interest in any investment product or fund or account managed or advised by Apollo.
Certain statements made throughout this presentation may be “forward-looking” in nature. Due to various risks and uncertainties, actual events or results may differ materially from those reflected or contemplated in such forward-looking information. As such, undue reliance should not be placed on such statements. Forward-looking statements may be identified by the use of terminology including, but not limited to, “may”, “will”, “should”, “expect”, “anticipate”, “target”, “project”, “estimate”, “intend”, “continue” or “believe” or the negatives thereof or other variations thereon or comparable terminology.