


Want it delivered daily to your inbox?
-
China’s business cycle used to be highly correlated with the US business cycle because of Chinese exports to the US.
But the business cycles in China and the US have decoupled for three reasons:
1) Chinese home prices are falling. US home prices are rising.
2) China’s working-age population is declining. The US working-age population is growing.
3) The US and Europe have imposed tariffs and want to produce more goods at home. This is negative for Chinese exports.
If US growth is about to slow down, then it will magnify the ongoing slowdown in China.
Our latest China chart book is available here.
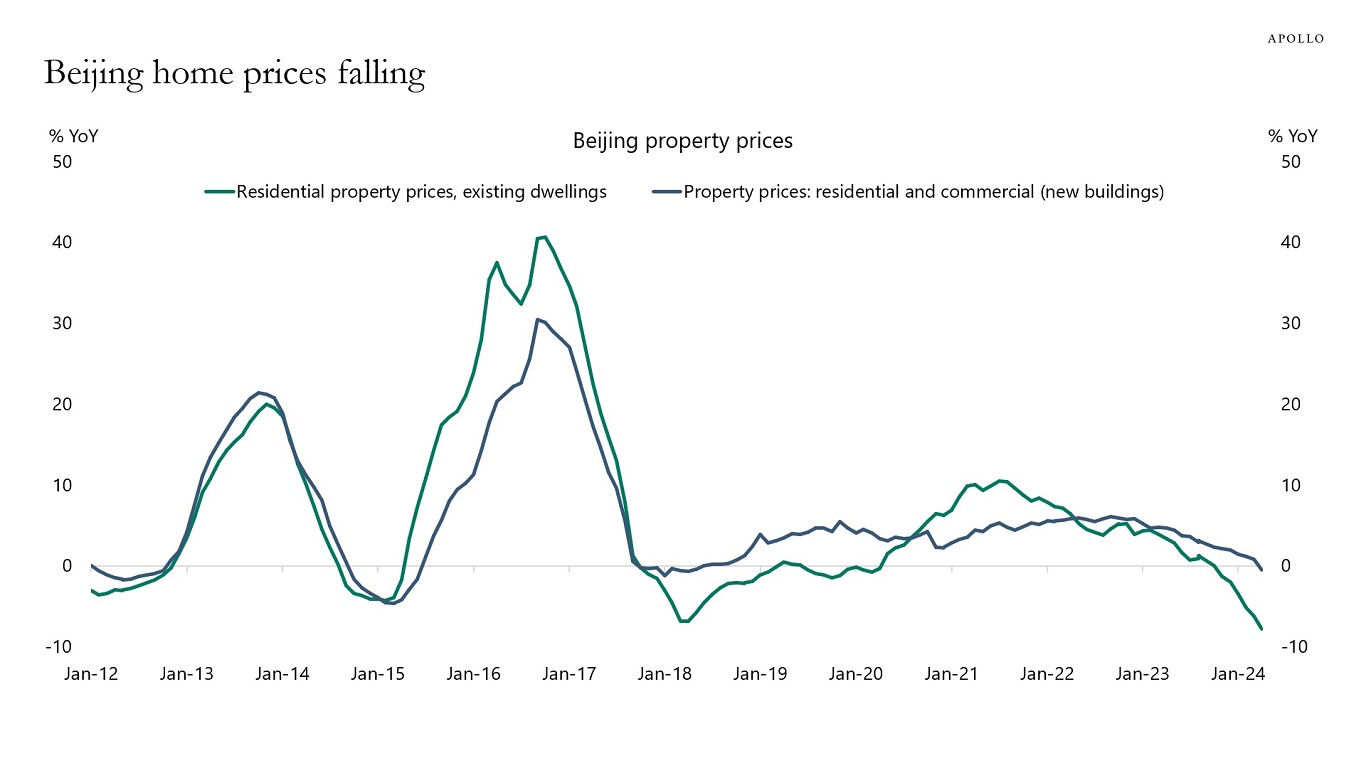
Source: BIS, Haver, Apollo Chief Economist 
Source: Bloomberg, Apollo Chief Economist 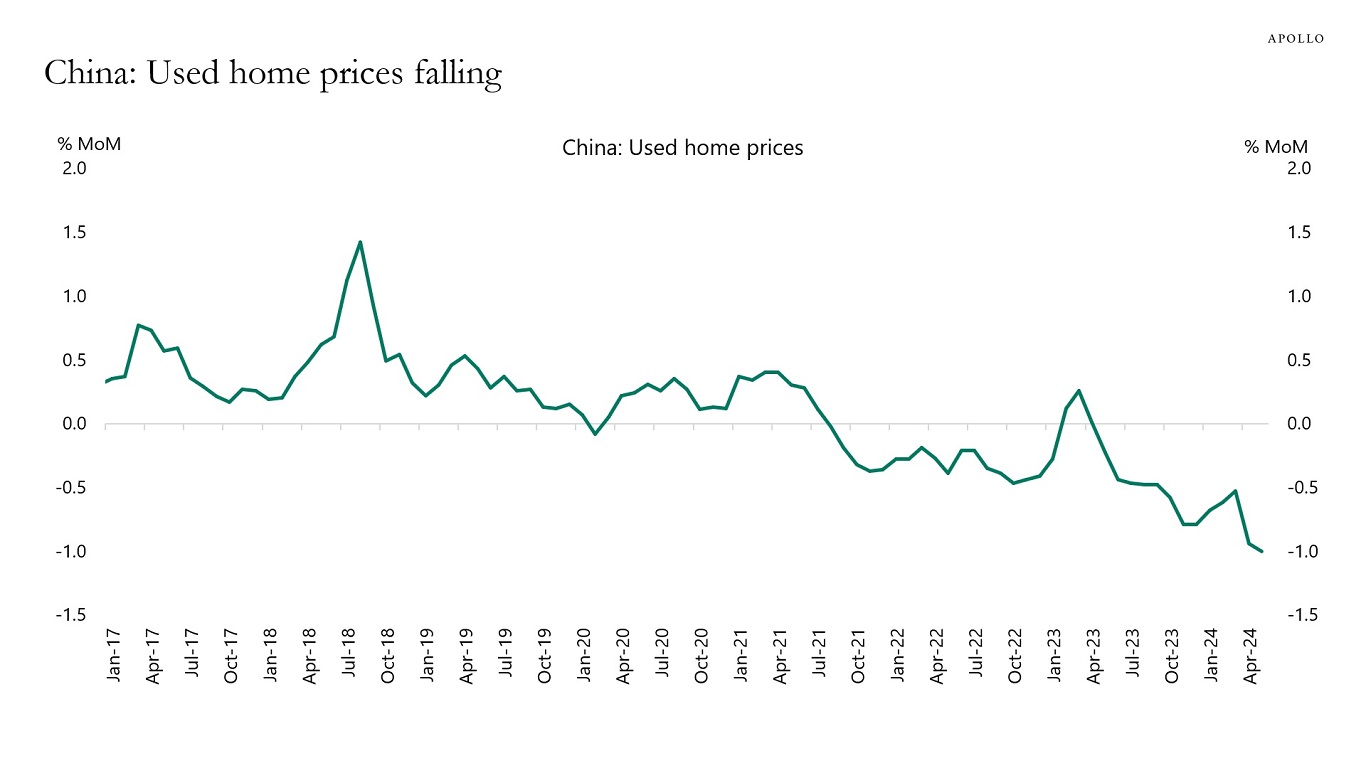
Source: Bloomberg, Apollo Chief Economist 
Source: Haver, Apollo Chief Economist. Data as of Q3 2023. 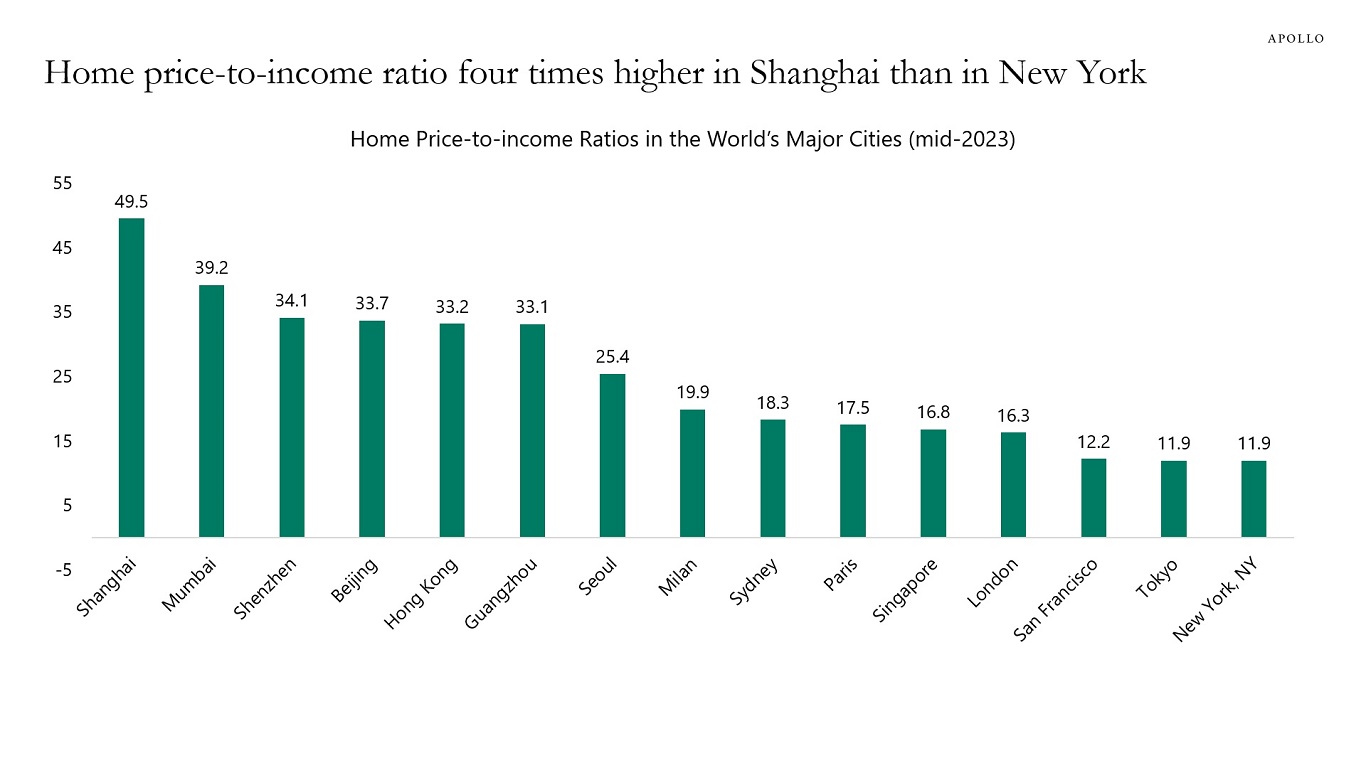
Source: Numbeo (https://www.numbeo.com/property-investment/rankings.jsp?title=2023-mid), Apollo Chief Economist. Note: Price to Income Ratio is the basic measure for apartment purchase affordability. It is generally calculated as the ratio of median apartment prices to median family disposable income, expressed as years of income. See important disclaimers at the bottom of the page.
-
Container freight rates are rising, and it currently costs $9,000 to transport a 40-foot container from Shanghai to New York. At the peak of Covid, the cost was $16,000, see the first chart below.
The sources for the rise in transportation costs are Suez crossings significantly below normal levels, disruptions at some Asian ports, and growth in demand due to restocking.
The rise in transportation costs is very specific to containers. Freight rates by truck, rail, and air have generally not increased by the same magnitude. Only the Baltic Capesize Index is trending significantly higher.
Most importantly, if the global economy was slowing down rapidly, then all transportation costs would be falling. That is not what we are seeing, which suggests that global growth continues to be fine.
Our updated supply chain chart book is available here.

Source: WCI, Bloomberg, Apollo Chief Economist 
Source: Portwatch, The IMF, Apollo Chief Economist 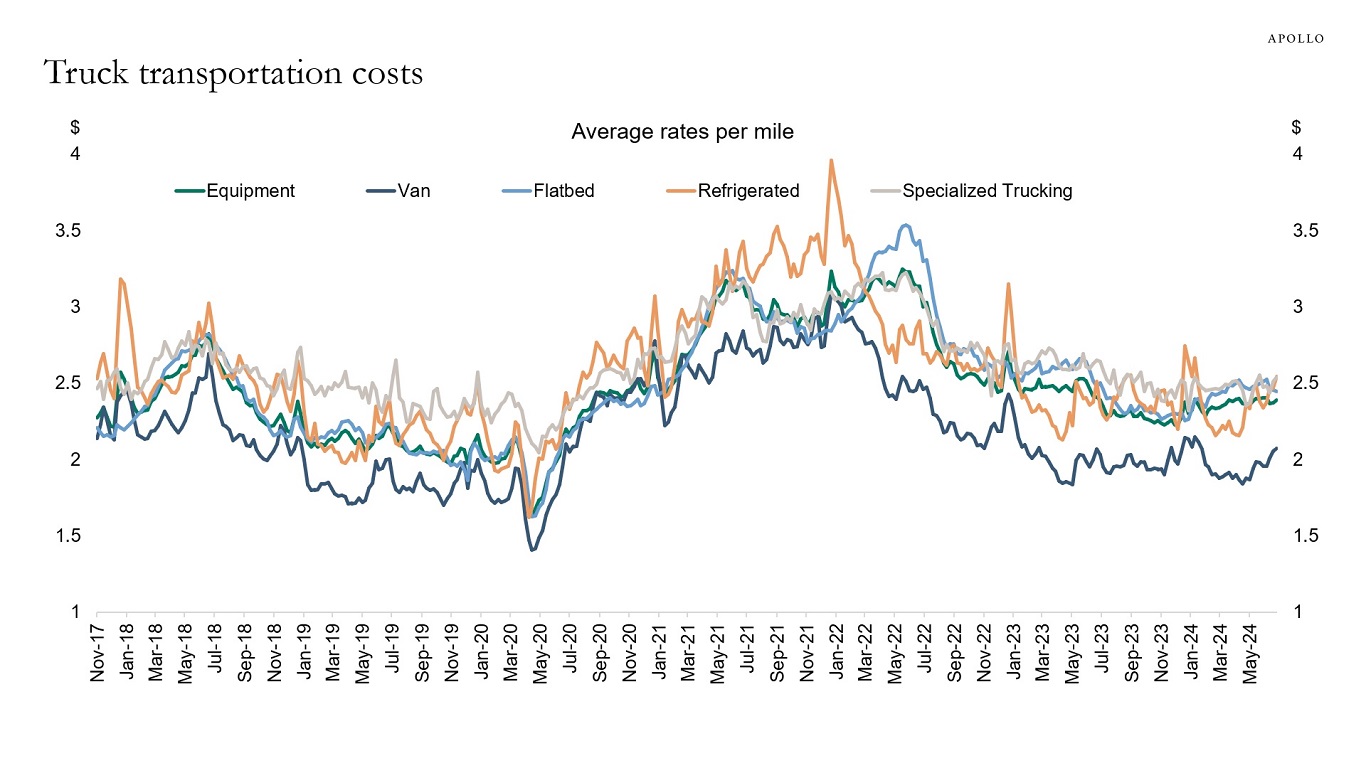
Source: Bloomberg, Apollo Chief Economist 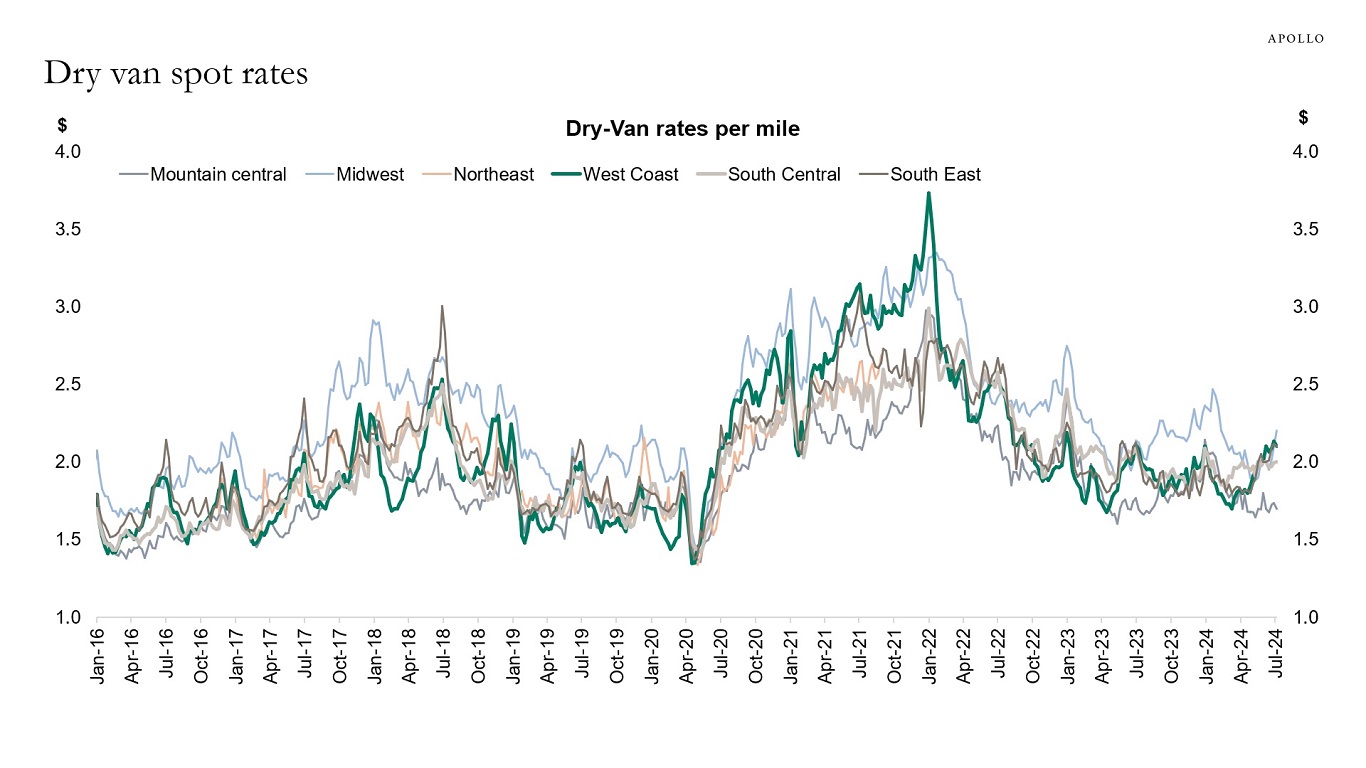
Source: Bloomberg, Apollo Chief Economist 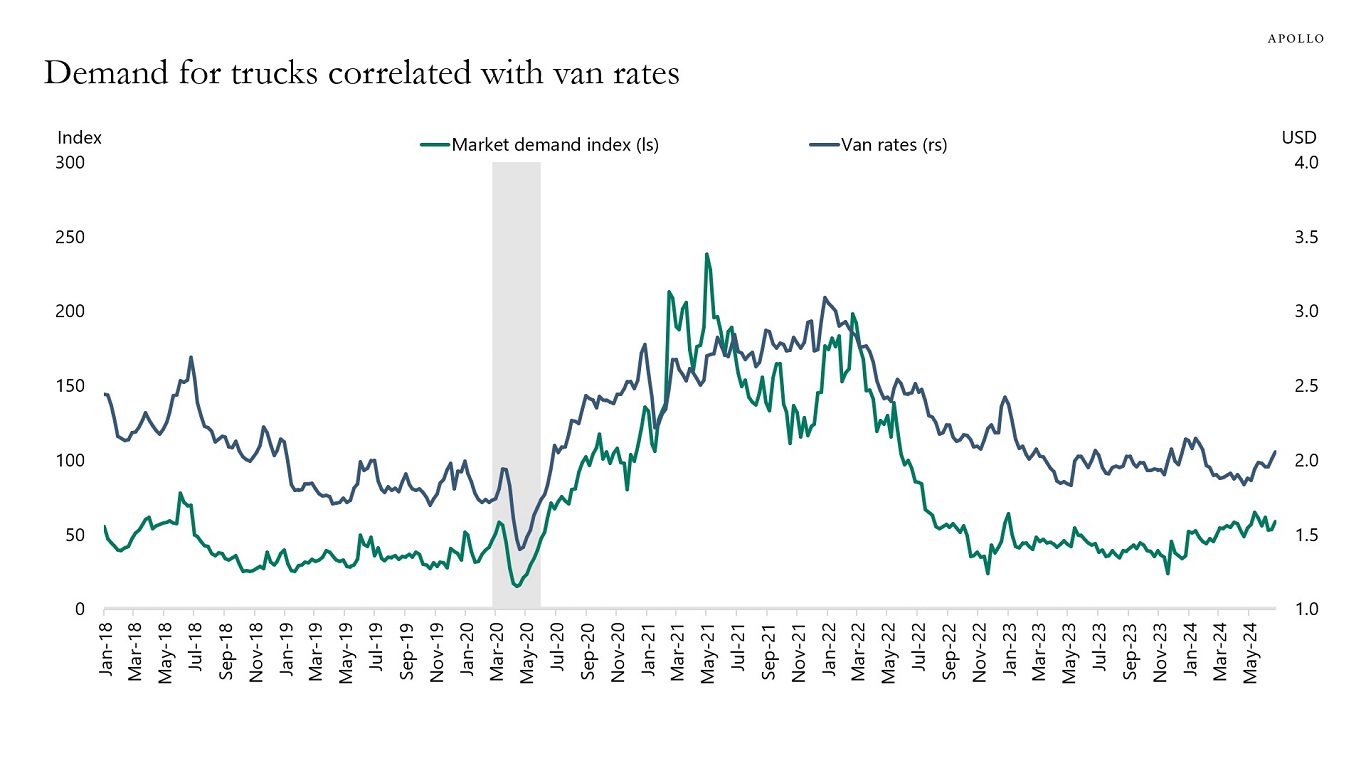
Source: Bloomberg, Apollo Chief Economist (Note: Market demand index is the ratio of loads over trucks and measures the relative truck demand; Van rates are measured in USD) 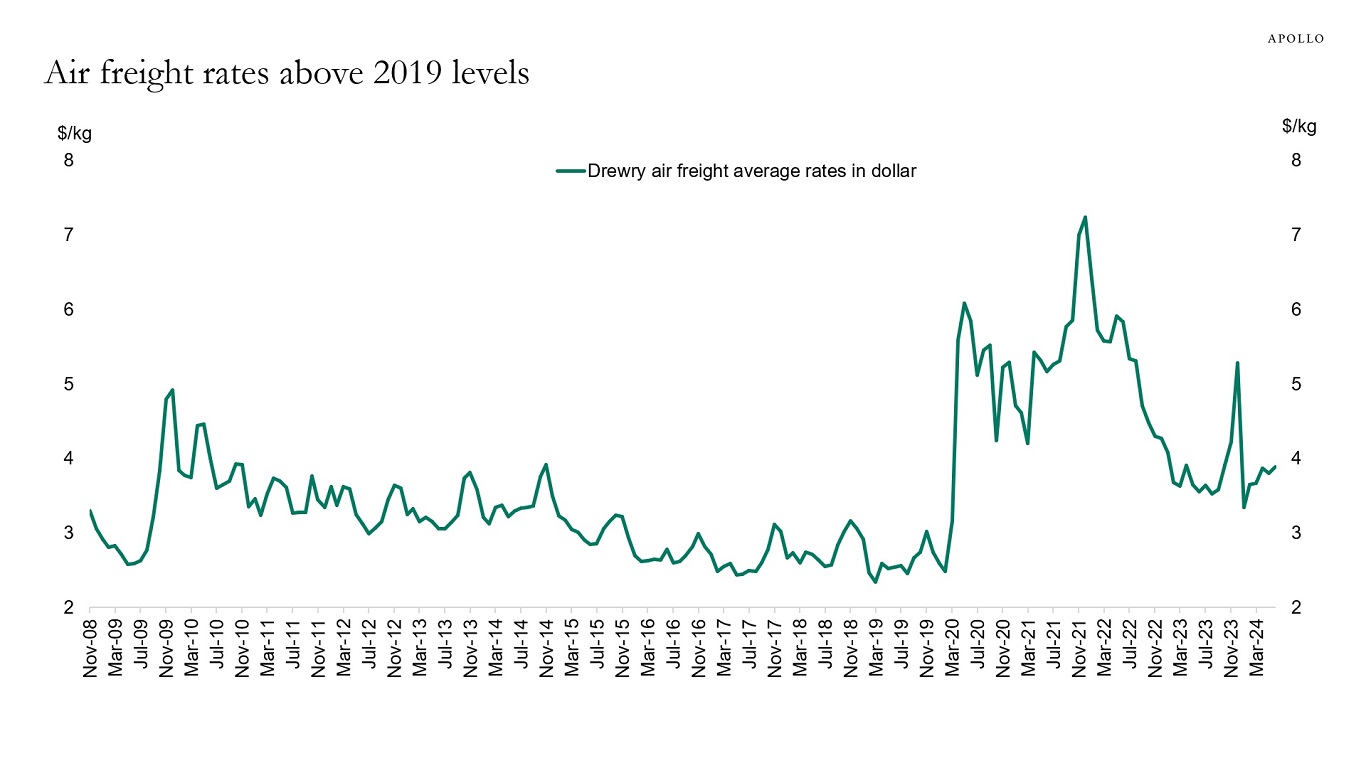
Source: Bloomberg, Apollo Chief Economist 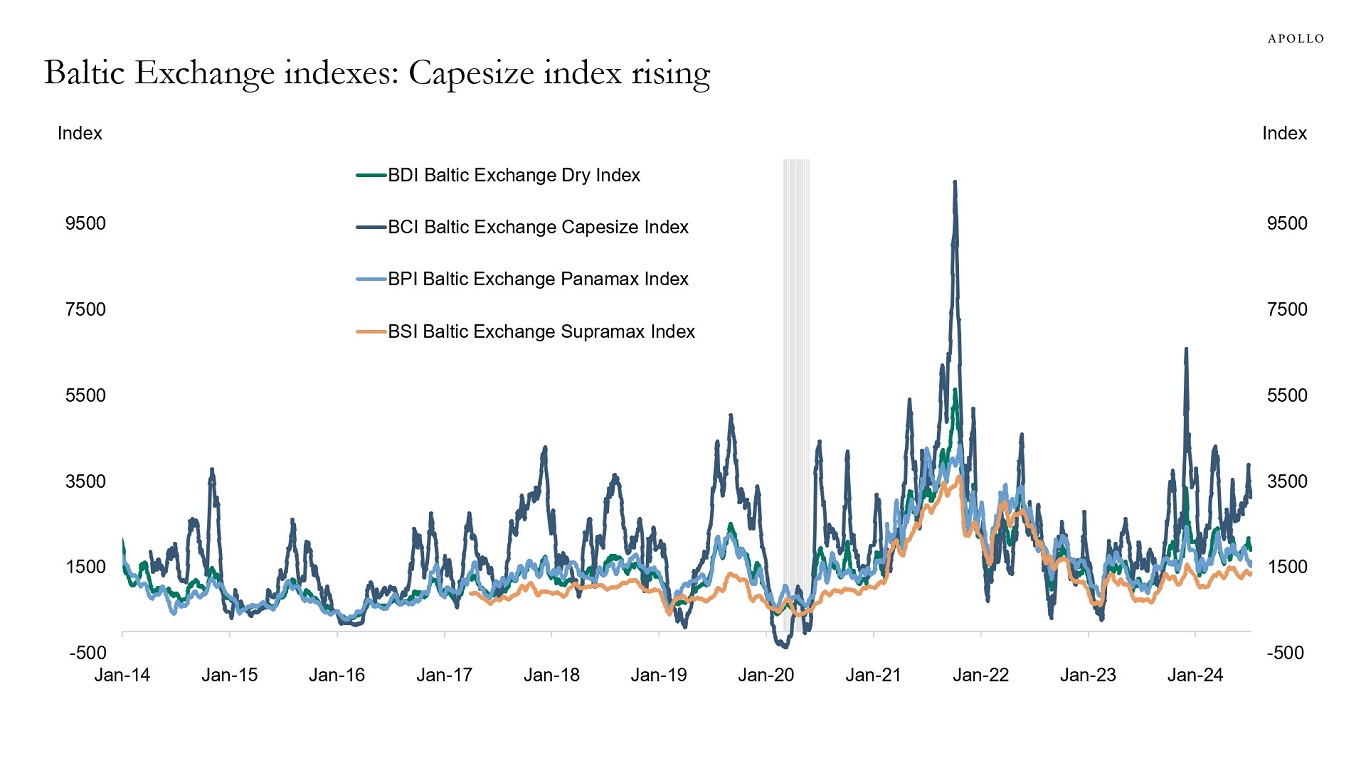
Source: Bloomberg, Apollo Chief Economist See important disclaimers at the bottom of the page.
-
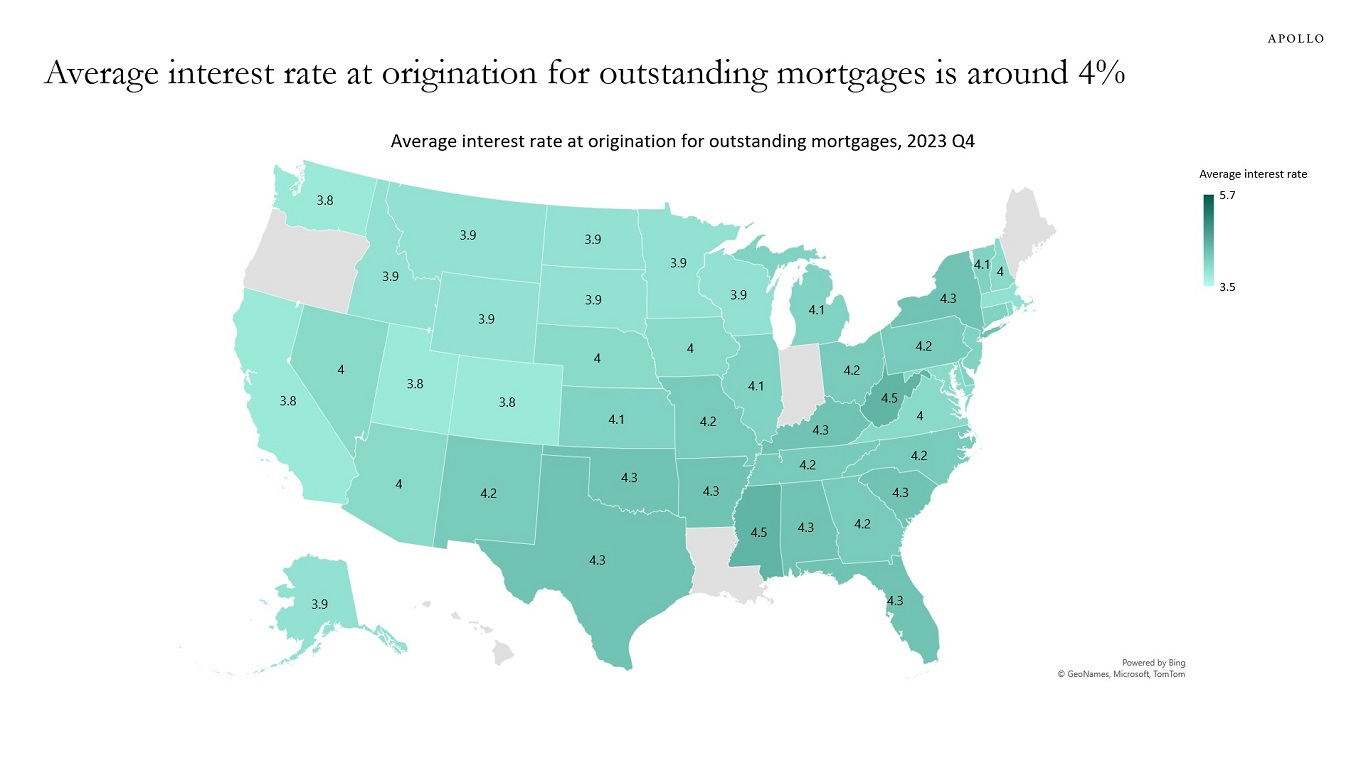
The average interest rate at origination for outstanding mortgages is currently around 4% in most states, see map below. With 30-year fixed mortgage rates currently above 7%, this map shows why Fed hikes over the past two years have had such a limited impact on the housing market and consumer spending. Similarly, most corporates have locked in low interest rates during the pandemic.
In addition, consumer spending continues to be boosted by significant wealth gains for households coming from the AI story driving the S&P 500 higher and households receiving decade-high levels of cash flow from fixed income, including private credit.
The bottom line is that easy financial conditions combined with locked-in interest rates for households and firms have made the transmission mechanism of monetary policy much weaker than expected.
In other words, the ongoing strength of the economy is due to easy financial conditions and locked-in low interest rates for the private sector.
See important disclaimers at the bottom of the page.
-
See important disclaimers at the bottom of the page.
-
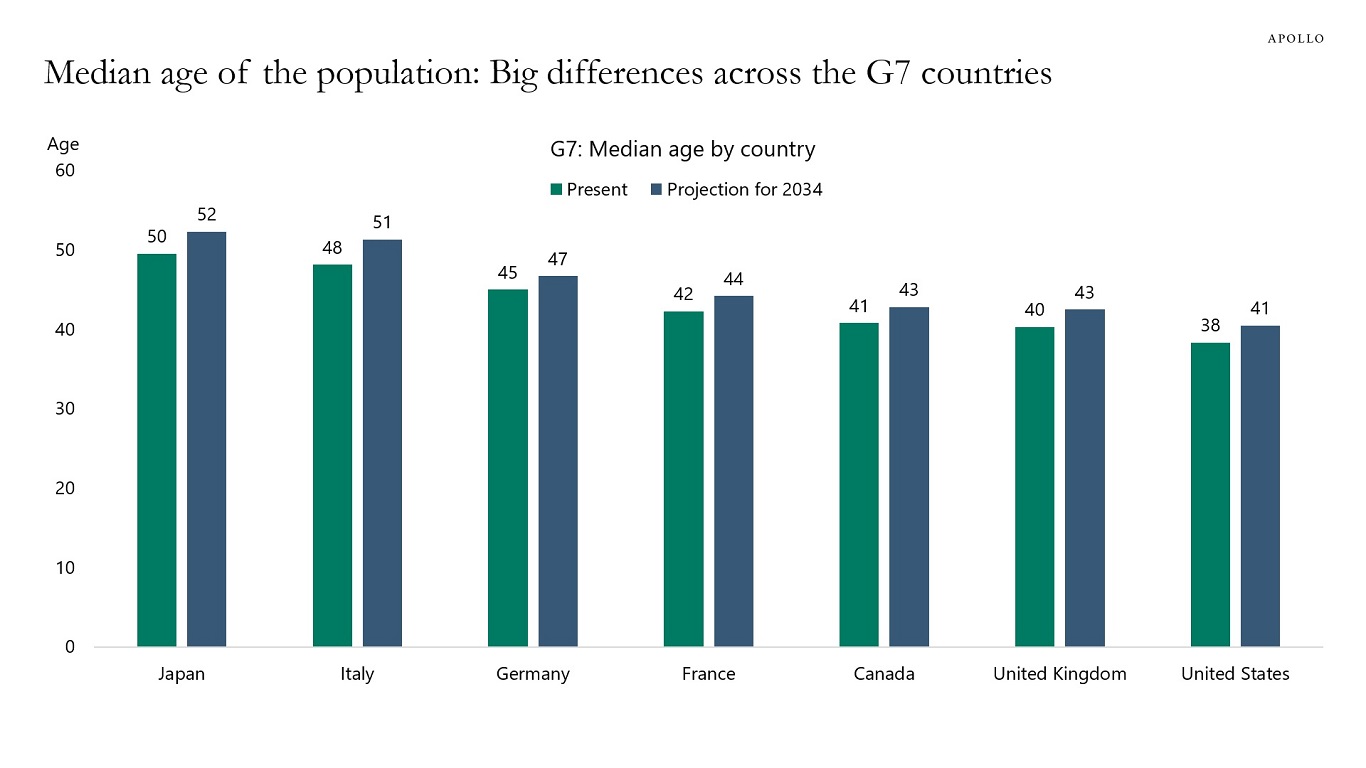
The median age of the US population is 38 years, while the median ages of the populations in Japan and Italy are 50 and 48 years, respectively, see chart below. The younger population in the US has significant implications for government spending, tax revenues, and economy-wide productivity.
Source: World Health Organization, United Nations, World Population Prospects (2022), Apollo Chief Economist See important disclaimers at the bottom of the page.
-
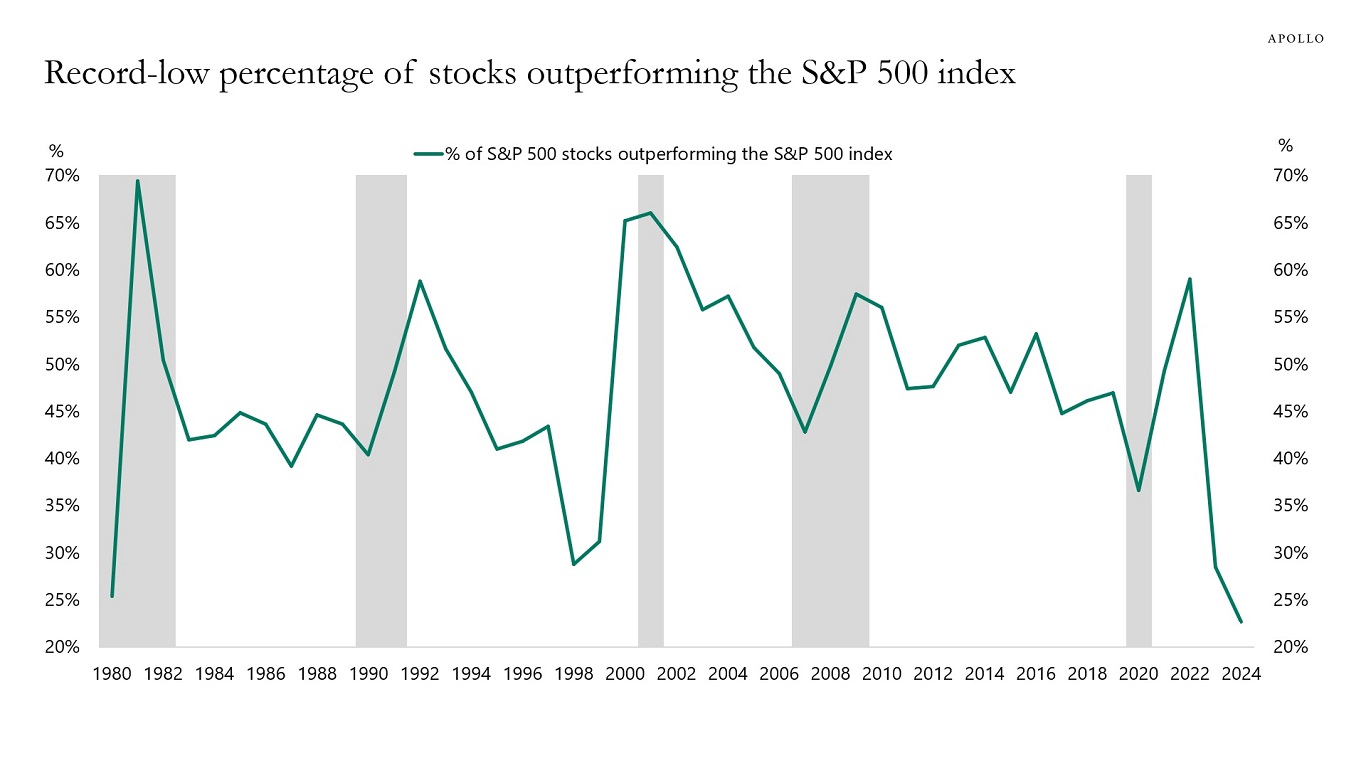
Another way to illustrate the extreme concentration in the S&P 500 is to look at the record-low percentage of component stocks outperforming the index, see chart below. This chart shows that stock picking in the S&P 500 essentially boils down to whether you like tech or not.
Source: Bloomberg, Apollo Chief Economist. Note: Annual data is from January 1 to December 31 for each year. The 2024 data is as of July 2, 2024 (year-to-date). See important disclaimers at the bottom of the page.
-
The homeownership rate has in recent years increased much more for younger households, see chart below.
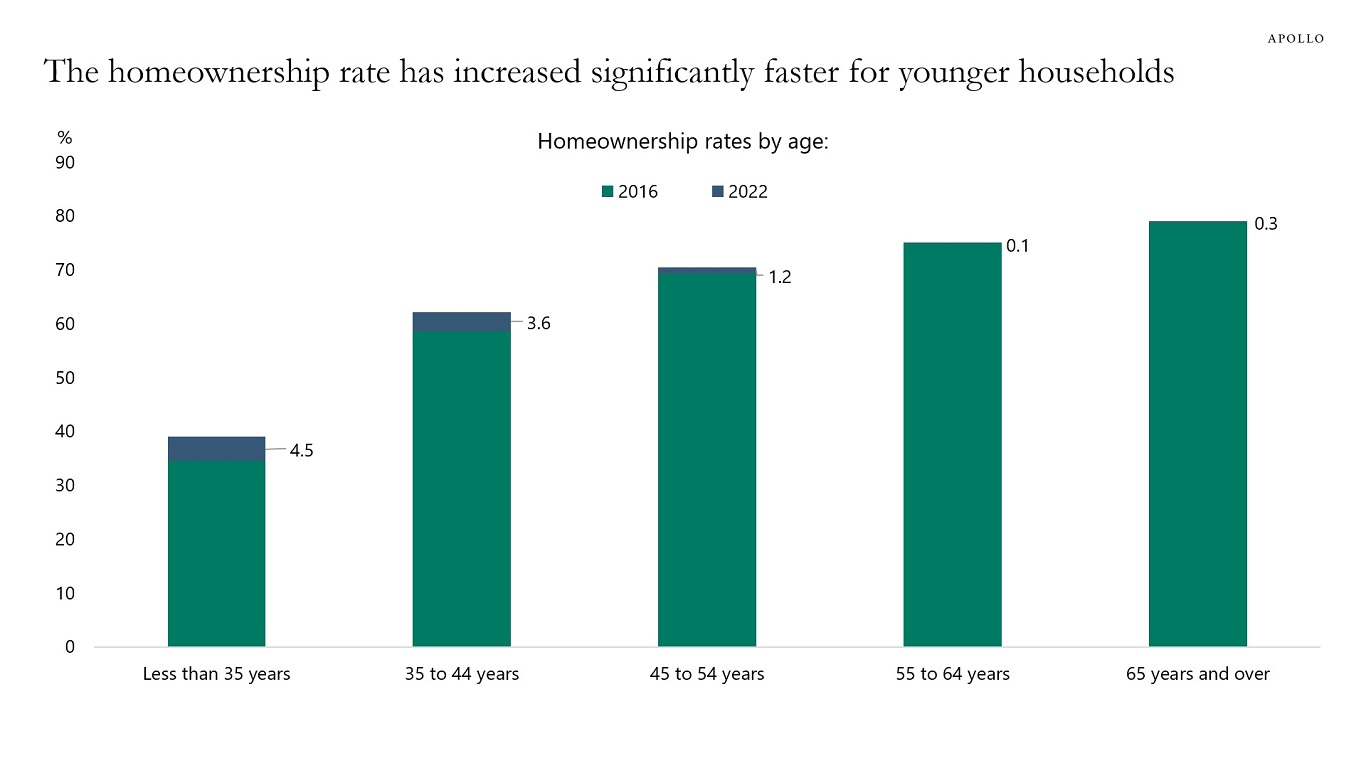
Source: US Census Bureau, Current Population Survey/Housing Vacancy survey, Apollo Chief Economist See important disclaimers at the bottom of the page.
-
In rates markets, there is a tug-of-war between a slowing economy arguing for lower rates versus the structural forces putting upside pressures on inflation and rates (i.e., deglobalization, energy transition, more restrictions on immigration, more defense spending, and significant fiscal challenges).
So far, 10s have been moving around one-to-one with Fed expectations, see chart below. But in recent weeks, a gap has opened up, suggesting that other factors, perhaps including the fiscal outlook, are beginning to play a role for long rates.
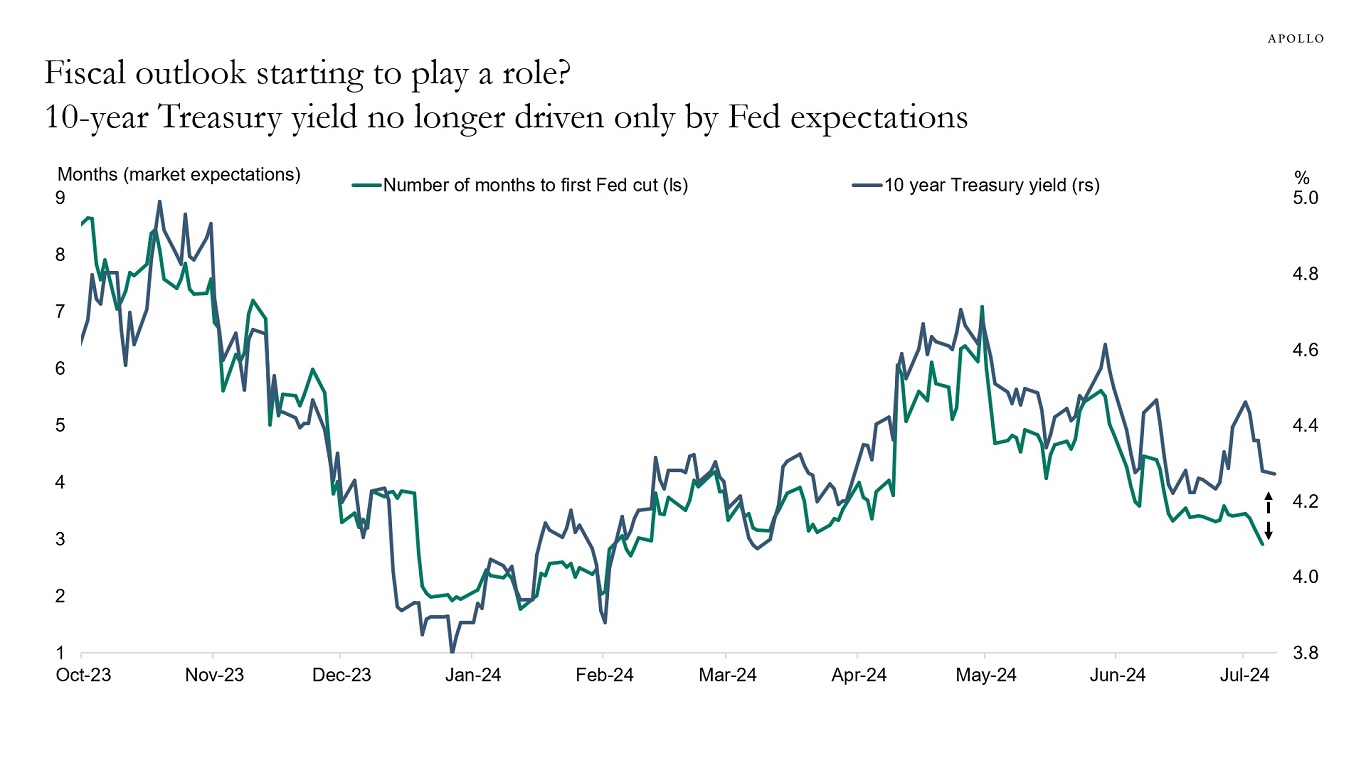
Source: Bloomberg, Apollo Chief Economist. Note: The indices used from Bloomberg are MSM1UT Index and GT10 Govt. See important disclaimers at the bottom of the page.
-
For the first time in more than 60 years, US energy production is now higher than US energy consumption, see chart below.
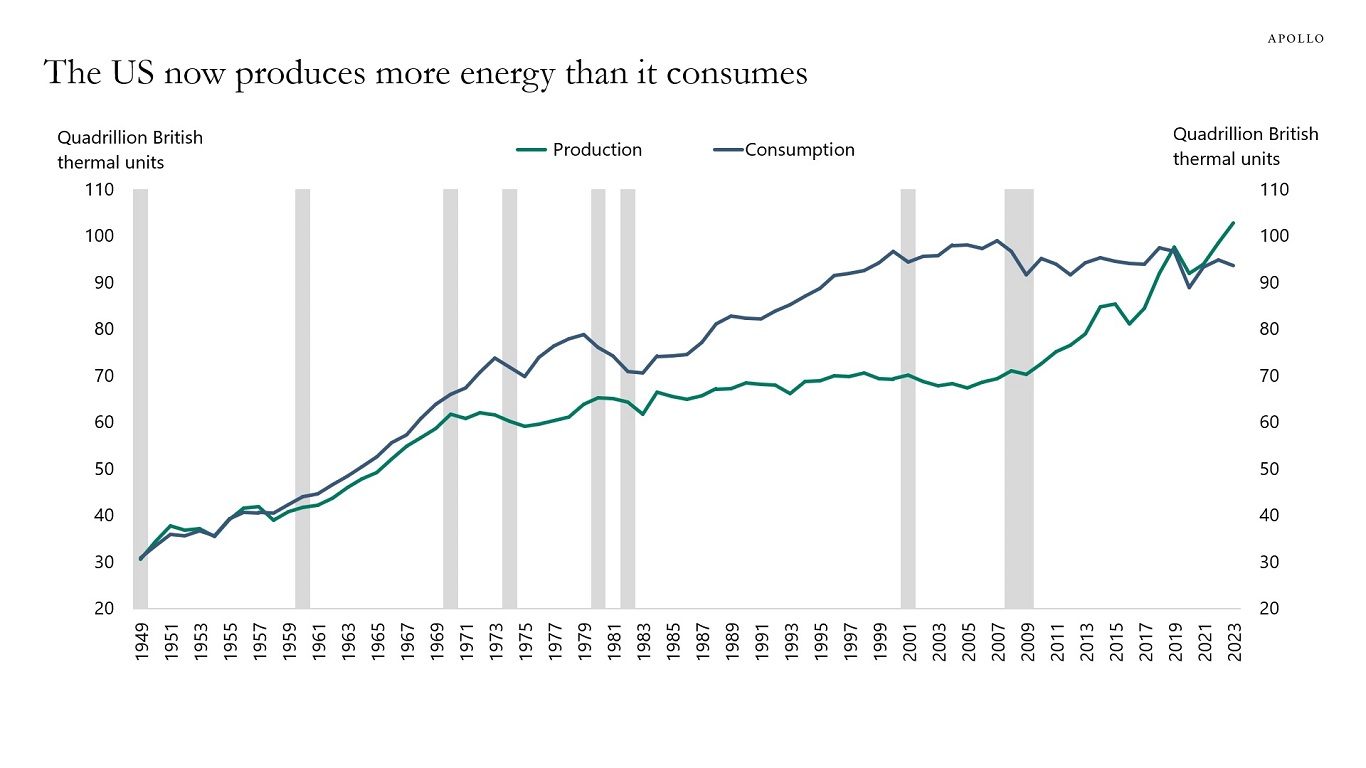
Note: Primary energy production and consumption. Source: US Energy Information Administration, Apollo Chief Economist See important disclaimers at the bottom of the page.
-
There are 2.3 million firms in the US with more than five employees. Investors and the media spend a disproportionate amount of time on a fraction of these, namely the S&P 500 companies (see chart below).
The bottom line is that the US economy consists mainly of privately owned firms—companies that need equity and debt financing to generate jobs and economic growth.

Source: Census, Apollo Chief Economist See important disclaimers at the bottom of the page.

This presentation may not be distributed, transmitted or otherwise communicated to others in whole or in part without the express consent of Apollo Global Management, Inc. (together with its subsidiaries, “Apollo”).
Apollo makes no representation or warranty, expressed or implied, with respect to the accuracy, reasonableness, or completeness of any of the statements made during this presentation, including, but not limited to, statements obtained from third parties. Opinions, estimates and projections constitute the current judgment of the speaker as of the date indicated. They do not necessarily reflect the views and opinions of Apollo and are subject to change at any time without notice. Apollo does not have any responsibility to update this presentation to account for such changes. There can be no assurance that any trends discussed during this presentation will continue.
Statements made throughout this presentation are not intended to provide, and should not be relied upon for, accounting, legal or tax advice and do not constitute an investment recommendation or investment advice. Investors should make an independent investigation of the information discussed during this presentation, including consulting their tax, legal, accounting or other advisors about such information. Apollo does not act for you and is not responsible for providing you with the protections afforded to its clients. This presentation does not constitute an offer to sell, or the solicitation of an offer to buy, any security, product or service, including interest in any investment product or fund or account managed or advised by Apollo.
Certain statements made throughout this presentation may be “forward-looking” in nature. Due to various risks and uncertainties, actual events or results may differ materially from those reflected or contemplated in such forward-looking information. As such, undue reliance should not be placed on such statements. Forward-looking statements may be identified by the use of terminology including, but not limited to, “may”, “will”, “should”, “expect”, “anticipate”, “target”, “project”, “estimate”, “intend”, “continue” or “believe” or the negatives thereof or other variations thereon or comparable terminology.