


The Daily Spark is moving to Apollo.com— read the latest from Torsten Slok here.
Want it delivered daily to your inbox?
-
The US Census Bureau conducts a biweekly survey of 1.2 million firms, and one question is whether a business has used AI tools such as machine learning, natural language processing, virtual agents or voice recognition to help produce goods or services in the past two weeks. Recent data by firm size shows that AI adoption has been declining among companies with more than 250 employees, see chart below.
The bottom line is that the biweekly Census data is starting to show a slowdown in AI adoption for large companies.
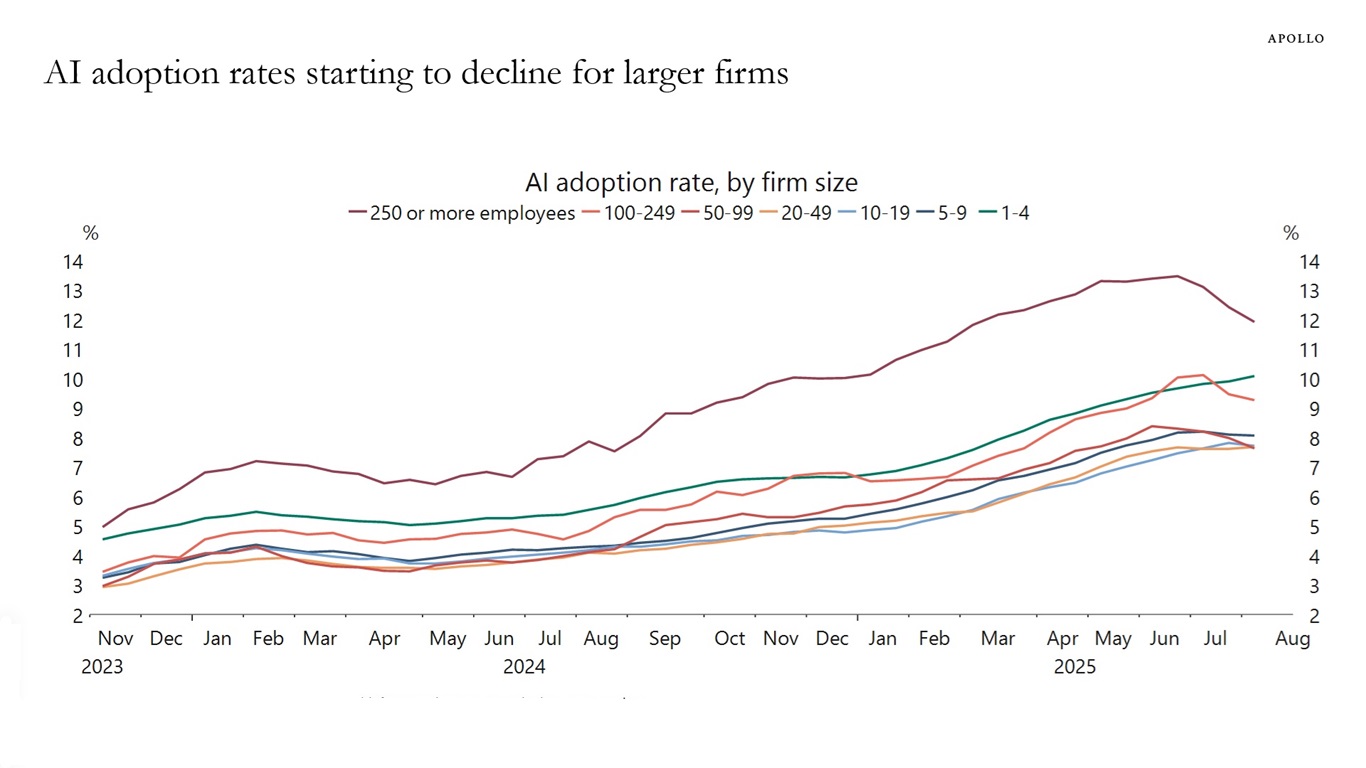
Note: Data is six-survey moving average. The survey is conducted biweekly. Sources: US Census Bureau, Macrobond, Apollo Chief Economist See important disclaimers at the bottom of the page.
-
Splitting employment growth into tariff-impacted sectors and sectors not directly impacted by tariffs shows that the slowdown in job growth is broad-based, and job growth in tariff-impacted sectors is now negative, see chart below.
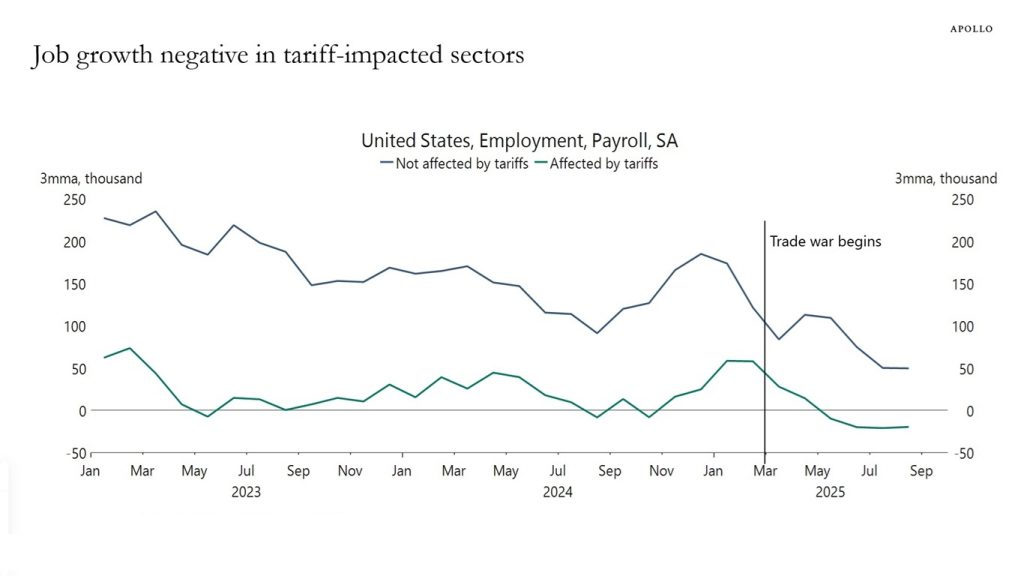
Note: Sectors impacted by tariffs include manufacturing, mining and logging, construction, wholesales trade, retail trade, transportation and warehousing. Sources: US Bureau of Labor Statistics (BLS), Macrobond, Apollo Chief Economist See important disclaimers at the bottom of the page.
-
One important reason why growth is structurally lower in Europe is that the European financial system is less developed.
Importantly, securitization accounts for 50% of GDP in the US and 7% in Europe, see also here.
Securitization lowers the costs of borrowing for consumers and firms, enhances credit availability, distributes risk and creates new investment opportunities for investors.
The bottom line is that expanding the securitization market in Europe would unlock significant GDP growth and benefit European consumers, firms and retirees.
For more discussion, see here and here.

Note: US is the sum of ABS and agency and nonagency MBS. Europe includes EU, UK and Switzerland. Sources: SIFMA, AFME, Apollo Chief Economist See important disclaimers at the bottom of the page.
-
Demand for housing is slowing because of high home prices, high mortgage rates and declining immigration, see charts below.
Housing supply is steady because existing homeowners are reluctant to sell their homes, since they’re locked into lower mortgage rates and don’t want to take on higher ones. Housing supply of new homes is rising, see again charts below.
The bottom line is that there is downward pressure on home prices coming from falling demand and rising supply.

Sources: National Association of Home Builders, Macrobond, Apollo Chief Economist 
Note: Calculation of monthly payment using the 30-year purchase loan application size and the 30-year effective rate. Sources: Bloomberg L.P., Apollo Chief Economist 
Sources: University of Michigan, National Association of Home Builders, Macrobond, Apollo Chief Economist 
Note: Household formation estimates for 2025 and 2026 are based on projected natural population growth and legal immigration. We assume unauthorized immigration drops to zero under potential Trump policy scenario. To reflect this, we use natural population growth plus 65% total net migration—based on CBO estimates and Migration Policy Institute’s estimates of 0.9 million rise in unauthorized immigrants in 2023—divided by the average US household size. Sources: Census Bureau, Haver, Apollo Chief Economist 
Note: Based on transactions in the 12 months ending March of each year. Sources: National Association of Realtors (NAR), Apollo Chief Economist 
Sources: US Census Bureau, Macrobond, Apollo Chief Economist 
Sources: NAR, US Census Bureau, Macrobond, Apollo Chief Economist 
Sources: US Census Bureau, Macrobond, Apollo Chief Economist See important disclaimers at the bottom of the page.
-
Sentiment indicators for consumers and firms are pointing to a weaker employment report for August.
First, consumer sentiment about the outlook for the labor market has historically been a leading indicator for job growth. Using the historical relationship to predict the August employment report suggests that nonfarm payrolls on Friday could come in lower than the 90,000 expected by the consensus, see the first chart below.
Second, small businesses saying that they are experiencing poor sales has also been a leading indicator for the unemployment rate, and the current reading suggests the unemployment rate could rise over the coming months, see the second chart.
The bottom line is that sentiment indicators are suggesting that the labor market will continue to weaken.

Note: University of Michigan’s expected change in unemployment during the next year August numbers are preliminary estimates. Sources: US Bureau of Labor Statistics (BLS), University of Michigan, Macrobond, Apollo Chief Economist 
Sources: National Federation of Independent Business, US Bureau of Labor Statistics (BLS), Macrobond, Apollo Chief Economist See important disclaimers at the bottom of the page.
-
Sales by European companies in the US are about eight times bigger than US goods imports from Europe, see the first chart.
Similarly, US companies’ sales in Europe are dramatically higher than European goods imports from the US, see the second chart.
The bottom line is that the US and European economies are not only linked via goods trade but also via sales of European companies in the US and sales of US companies in Europe.

Data as of 2022. Sources: US Bureau of Economic Analysis (BEA), Macrobond, Apollo Chief Economist 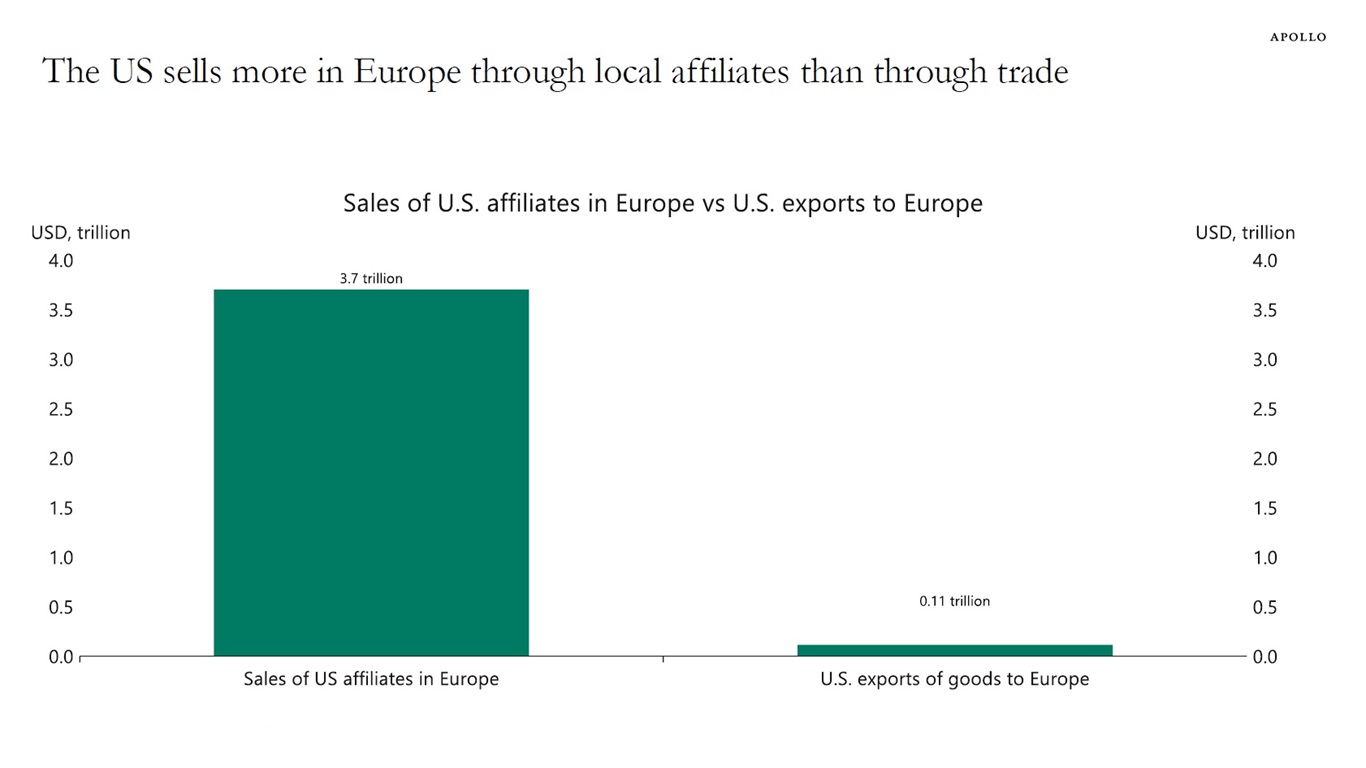
Data as of 2022. Sources: US Bureau of Economic Analysis (BEA), Macrobond, Apollo Chief Economist See important disclaimers at the bottom of the page.
-
The price of steaks is rising rapidly. Live cattle prices have nearly doubled over the past five years and are at all-time highs, largely due to the US cattle herd being at its smallest size in decades, driven by years of drought and high feed costs, see chart below.

Sources: Bloomberg, Macrobond, Apollo Chief Economist See important disclaimers at the bottom of the page.
-
There is upside pressure on inflation and inflation expectations from tariffs, dollar depreciation and growing disagreement on the FOMC about how much weight to put on rising inflation relative to slowing employment.
The risks are rising that we could see another “inflation mountain” emerge over the coming months, see chart below.

Sources: BLS, Bloomberg, Apollo Chief Economist See important disclaimers at the bottom of the page.
-
The chart below shows quoted bid-ask spreads for public investment grade credit as a function of bond-level spread volatility. Both on-the-run and off-the-run bonds see higher transaction costs as spreads move, but the increase is far more pronounced for off-the-run bonds. This helps to explain why volumes remain depressed even in volatile periods.
The bottom line is that liquidity in public and private credit is converging, and in some cases where private credit is included in ETFs, private credit may even be more liquid than some segments of public credit.
For more discussion see also here.

Note: Data as of December 2024. Liquid bonds defined as issued in <1y, $1bn+ deal size. Illiquid bonds issued >2y, <$900mn in size. Sources: TRACE, Barclays, Apollo Analysts, Apollo Chief Economist See important disclaimers at the bottom of the page.
-
The yield on Italian long-term government debt could, by the end of this year, be lower than the yield on France’s government debt, see chart below.

Sources: Macrobond, Apollo Chief Economist See important disclaimers at the bottom of the page.

This presentation may not be distributed, transmitted or otherwise communicated to others in whole or in part without the express consent of Apollo Global Management, Inc. (together with its subsidiaries, “Apollo”).
Apollo makes no representation or warranty, expressed or implied, with respect to the accuracy, reasonableness, or completeness of any of the statements made during this presentation, including, but not limited to, statements obtained from third parties. Opinions, estimates and projections constitute the current judgment of the speaker as of the date indicated. They do not necessarily reflect the views and opinions of Apollo and are subject to change at any time without notice. Apollo does not have any responsibility to update this presentation to account for such changes. There can be no assurance that any trends discussed during this presentation will continue.
Statements made throughout this presentation are not intended to provide, and should not be relied upon for, accounting, legal or tax advice and do not constitute an investment recommendation or investment advice. Investors should make an independent investigation of the information discussed during this presentation, including consulting their tax, legal, accounting or other advisors about such information. Apollo does not act for you and is not responsible for providing you with the protections afforded to its clients. This presentation does not constitute an offer to sell, or the solicitation of an offer to buy, any security, product or service, including interest in any investment product or fund or account managed or advised by Apollo.
Certain statements made throughout this presentation may be “forward-looking” in nature. Due to various risks and uncertainties, actual events or results may differ materially from those reflected or contemplated in such forward-looking information. As such, undue reliance should not be placed on such statements. Forward-looking statements may be identified by the use of terminology including, but not limited to, “may”, “will”, “should”, “expect”, “anticipate”, “target”, “project”, “estimate”, “intend”, “continue” or “believe” or the negatives thereof or other variations thereon or comparable terminology.