


The Daily Spark is moving to Apollo.com— read the latest from Torsten Slok here.
Want it delivered daily to your inbox?
-
When the Fed raises interest rates, the idea from the FOMC is for investors to take less risk and make it more attractive to move money into safer fixed income.
With this backdrop, the convergence in yield levels across debt and equity markets is remarkable, see chart below.
Not only is the yield level in fixed income higher than it has been for many years, but the S&P 500 forward earnings yield and similar implied yield levels in equities have been coming down, see chart below.
The bottom line is that fixed income remains more attractive than the implied yield levels in public equity markets at the moment.
Put differently, risk is mispriced and investors buying the S&P 500 today are not rewarded for the risks they are taking.

Sources: Nareit, Bloomberg, Apollo Chief Economist See important disclaimers at the bottom of the page.
-
The spread on the high yield index is currently trading at around 300 basis points, but the distribution inside the index is very skewed, with more than half of the bonds in the index trading at less than 200 basis points, and 13% of the index trading at more than 500 basis points, see chart below. For more discussion of opportunities in credit see here.

Note: Index used is LF98TRUU Index. Sources: Bloomberg, Apollo Chief Economist See important disclaimers at the bottom of the page.
-
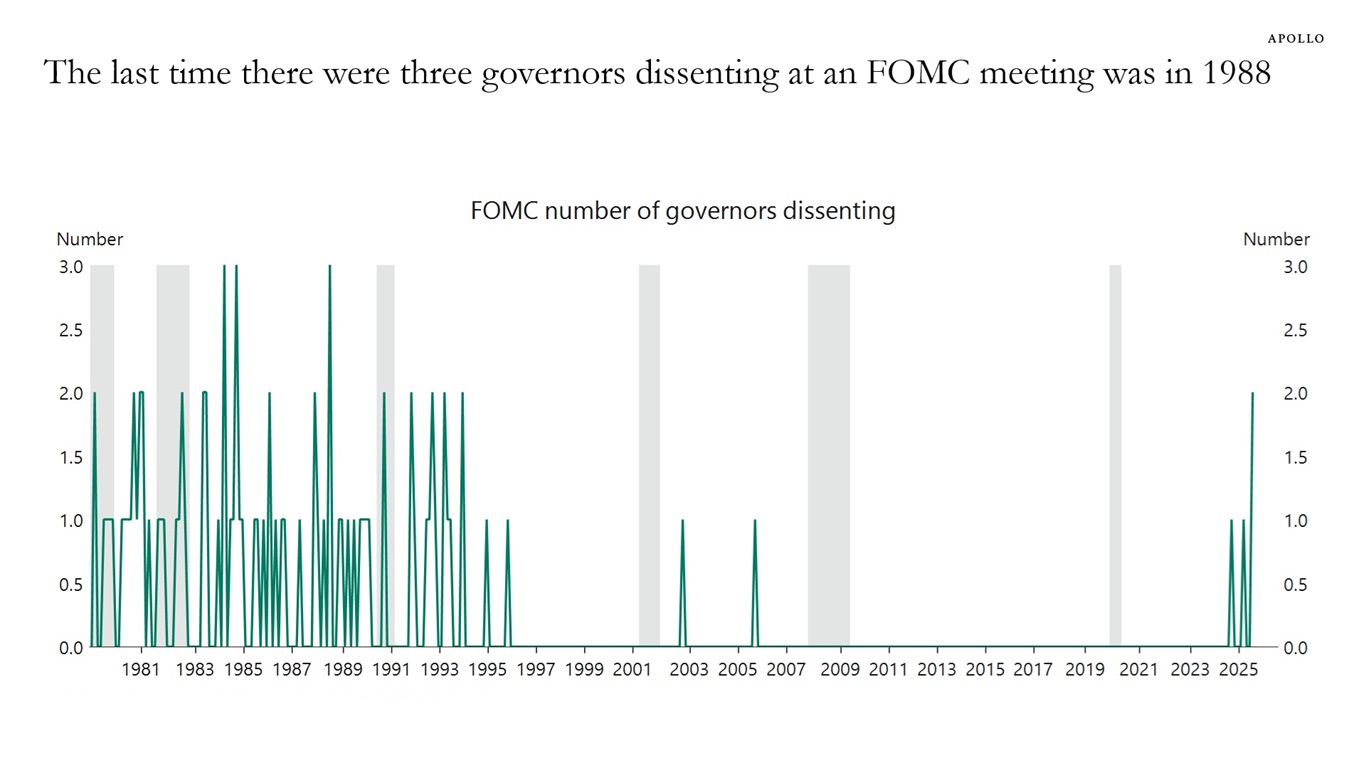
The chart below shows that the last time there were three governors dissenting at an FOMC meeting was in 1988.
On the one hand, dissents can enhance the Fed’s credibility by promoting transparency.
On the other hand, frequent or widespread dissents can be perceived as a sign of internal division or weak leadership.
Academic papers find that dissents have a negative impact on stock prices, and that the lack of clarity in FOMC decisions can lead to increased financial market volatility as investors must price in a broader range of potential policy outcomes. Papers also find that disagreement among FOMC members puts upward pressure on inflation expectations.
For more discussion, see linked materials below.
1. Dissent in Monetary Policy Decisions: Effects, Channels and Implications
2. The Effect of FOMC Votes on Financial Markets
3. Inflation Disagreement Weakens the Power of Monetary Policy
Sources: Federal Reserve Bank of St. Louis, Macrobond, Apollo Chief Economist See important disclaimers at the bottom of the page.
-
There are emerging signs of weakness in parts of discretionary spending in recent weeks—see chart below—which shows slowing year-over-year growth in consumer spending on motor vehicles and parts, sporting goods, bookstores, clothing, and furniture—sectors that are impacted by tariffs. Our updated chart book with daily data for consumer spending is available here.

Sources: US Bloomberg Second Measure Consumer Spend, Macrobond, Apollo Chief Economist See important disclaimers at the bottom of the page.
-
The charts below compare the stock performance of Tractor Supply and Apple, Domino’s Pizza and Google, and Old Dominion and Amazon.
The bottom line is that fancy tech stocks are getting so much attention, and investors spend a disproportionate amount of time discussing their growth strategies and new products. But numerous other stocks and investment strategies can deliver better and more stable returns with fewer sleepless nights.
Many people enjoy the adrenaline rush that comes with investing in the latest shiny toy, but for investors looking for steady and stable returns, boring is often a better strategy than fancy.

Sources: Bloomberg, Macrobond, Apollo Chief Economist 
Sources: Bloomberg, Macrobond, Apollo Chief Economist 
Sources: Bloomberg, Macrobond, Apollo Chief Economist See important disclaimers at the bottom of the page.
-
With the S&P 500 and credit spreads near record levels, it is clear that there is a lot of confidence in the US economy.
In fact, two pieces of evidence suggest that foreign investors are very excited about the US outlook.
1) US 10-year interest rates are going up during New York trading hours and down outside of New York trading hours, see the first chart below. Simply put, this shows that domestic investors are sellers of US government debt and foreign investors are buyers. Unsurprisingly, foreigners like the higher yields they get in the US, including in private credit.
2) While foreigners were selling US assets in April after Liberation Day, they have come back as big buyers of US assets in May and June, see the second chart. In other words, the “sell America” trade was basically only in April.
The bottom line is that the US is the most dynamic economy in the world with some of the most attractive investment opportunities, and the two charts below show that foreign investors agree.
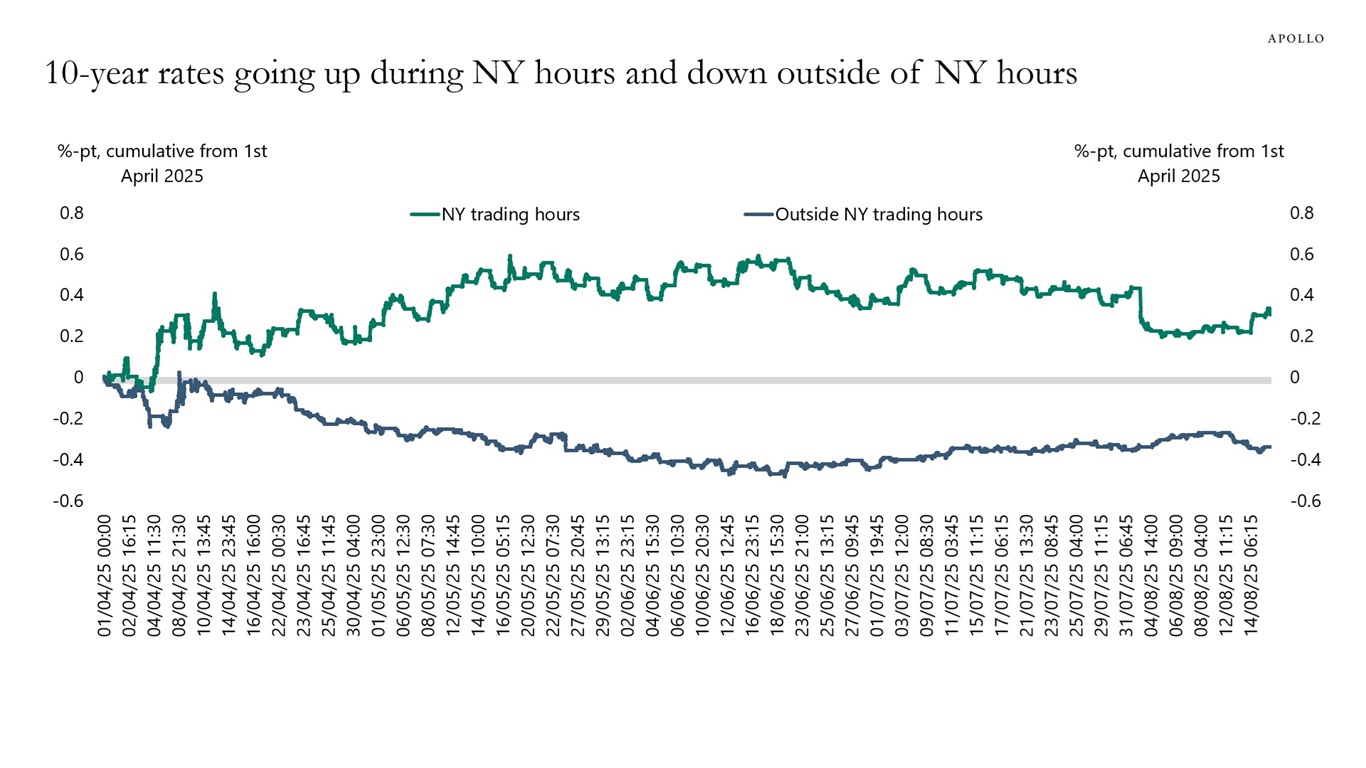
Note: New York trading hours are 8 am to 5 pm. Sources: Bloomberg, Apollo Chief Economist 
Sources: US Department of Treasury, Macrobond, Apollo Chief Economist See important disclaimers at the bottom of the page.
-
Goods inflation is rising because of tariffs and the depreciation of the dollar, see the first chart below.
There are also signs that service sector inflation is about to move higher, see the second chart below.
What is critical in Fed Chair Powell’s speech today is how confident he is that inflation is moving down toward the Fed’s 2% inflation target.

Sources: US Bureau of Labor Statistics (BLS), Macrobond, Apollo Chief Economist 
Sources: Institute for Supply Chain Management (ISM), US Bureau of Labor Statistics (BLS), Macrobond, Apollo Chief Economist See important disclaimers at the bottom of the page.
-
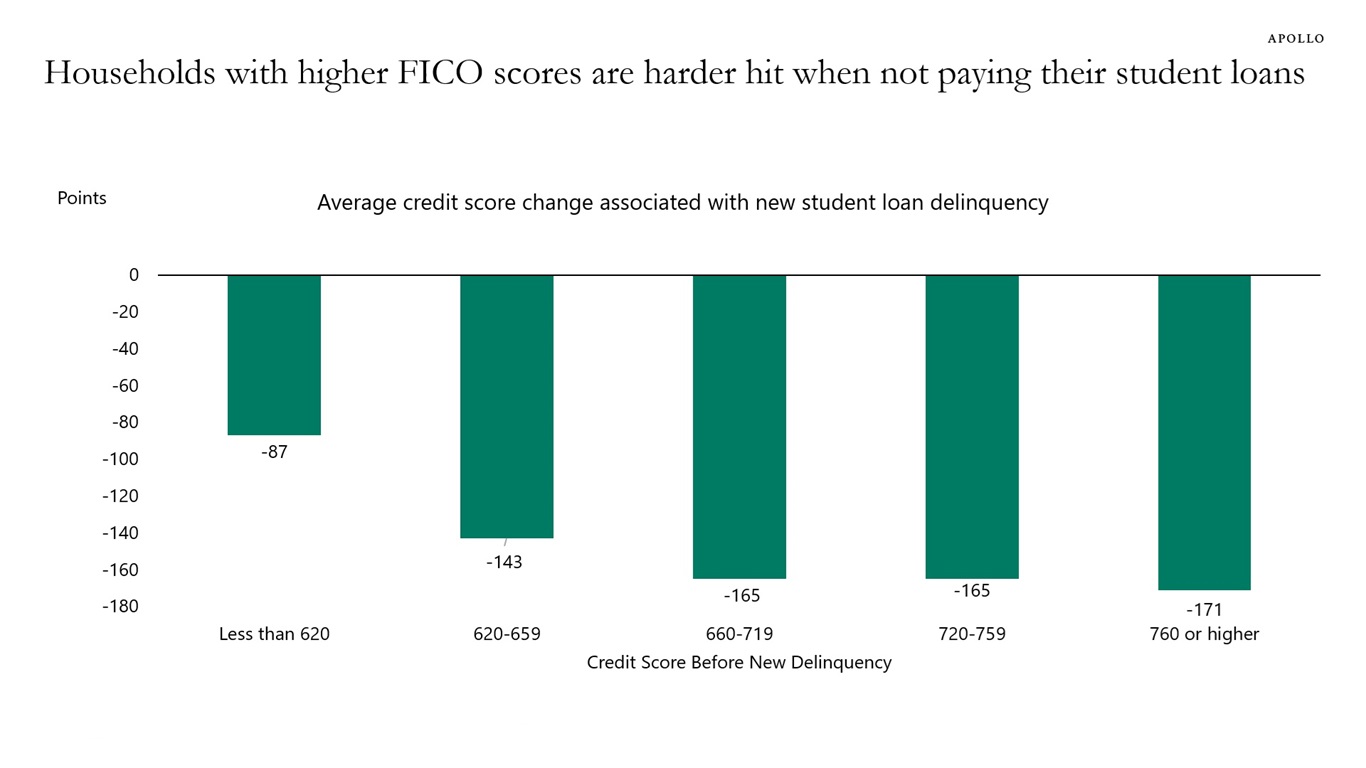
When households stop paying their student loans, their credit scores will go down. The chart below shows that for households with a FICO score higher than 760, the average credit score change associated with a new student loan delinquency is a decline of 171 points.
Forty-five million people have a student loan, and about 11 million, or 25%, are either in default or more than 90 days delinquent.
The bottom line is that the US consumer is facing headwinds from student loan payments restarting, see also here.
Sources: Credit Score Impacts from Past Due Student Loan Payments – Liberty Street Economics, Apollo Chief Economist See important disclaimers at the bottom of the page.
-
Consumer spending is under downward pressure from slowing job growth, student loan payments restarting and deportations lowering the number of consumers.
To carefully monitor these headwinds, we have put together this chart book with daily data for consumer spending on discretionary spending/essentials and consumer spending impacted by tariffs/not impacted by tariffs.
We will update and publish this chart book once a week going forward.

Sources: US Bloomberg Second Measure Consumer Spending, Macrobond, Apollo Chief Economist See important disclaimers at the bottom of the page.
-
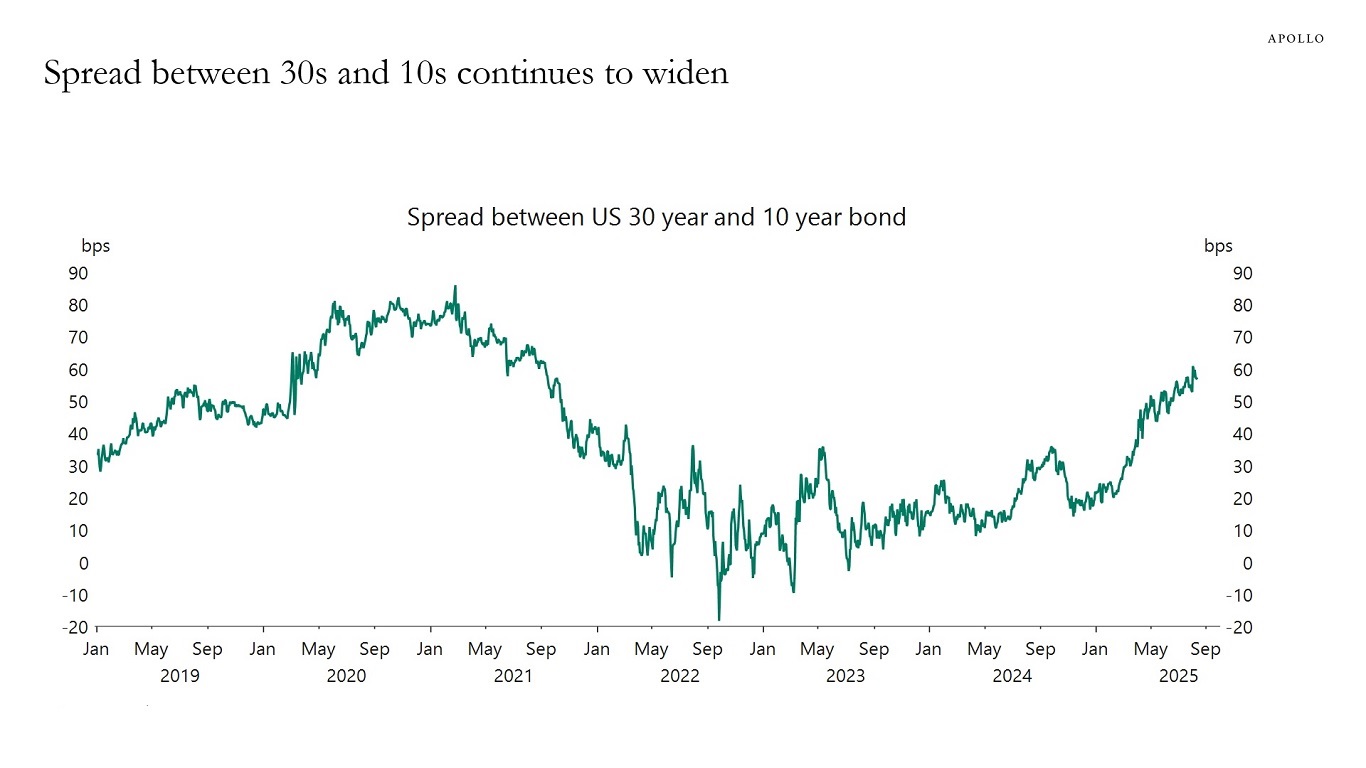
The US yield curve has started steepening, not only 2s10s but also 10s30s, see the first chart below.
There are three reasons why this is happening:
1. The Fed is cutting rates.
2. If the market thinks the Fed is cutting for political reasons, it puts upward pressure on inflation expectations and ultimately long rates, which also steepens the curve, see the second chart.
3. Growing Treasury issuance is putting upward pressure on long rates, see the third chart.
If Fed Chair Powell, in his Jackson Hole speech on Friday, is going to signal less commitment to the Fed’s 2% inflation target, the curve will steepen further.
We have put together a chart book looking at this topic, including some of the recent weakness in Treasury auctions. It is available here.
Sources: Bloomberg, Macrobond, Apollo Chief Economist 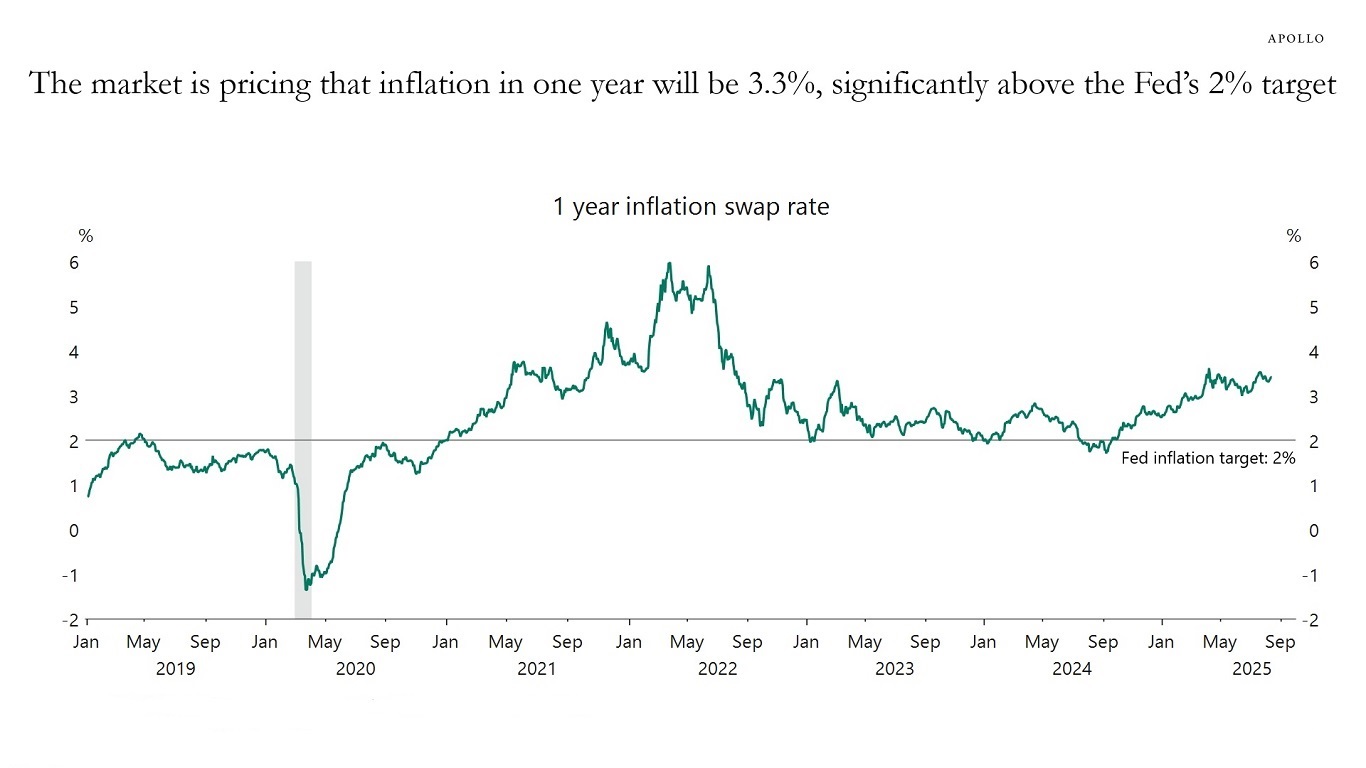
Note: Ticker used USSWIT1 Currency. Sources: Bloomberg, Macrobond, Apollo Chief Economist 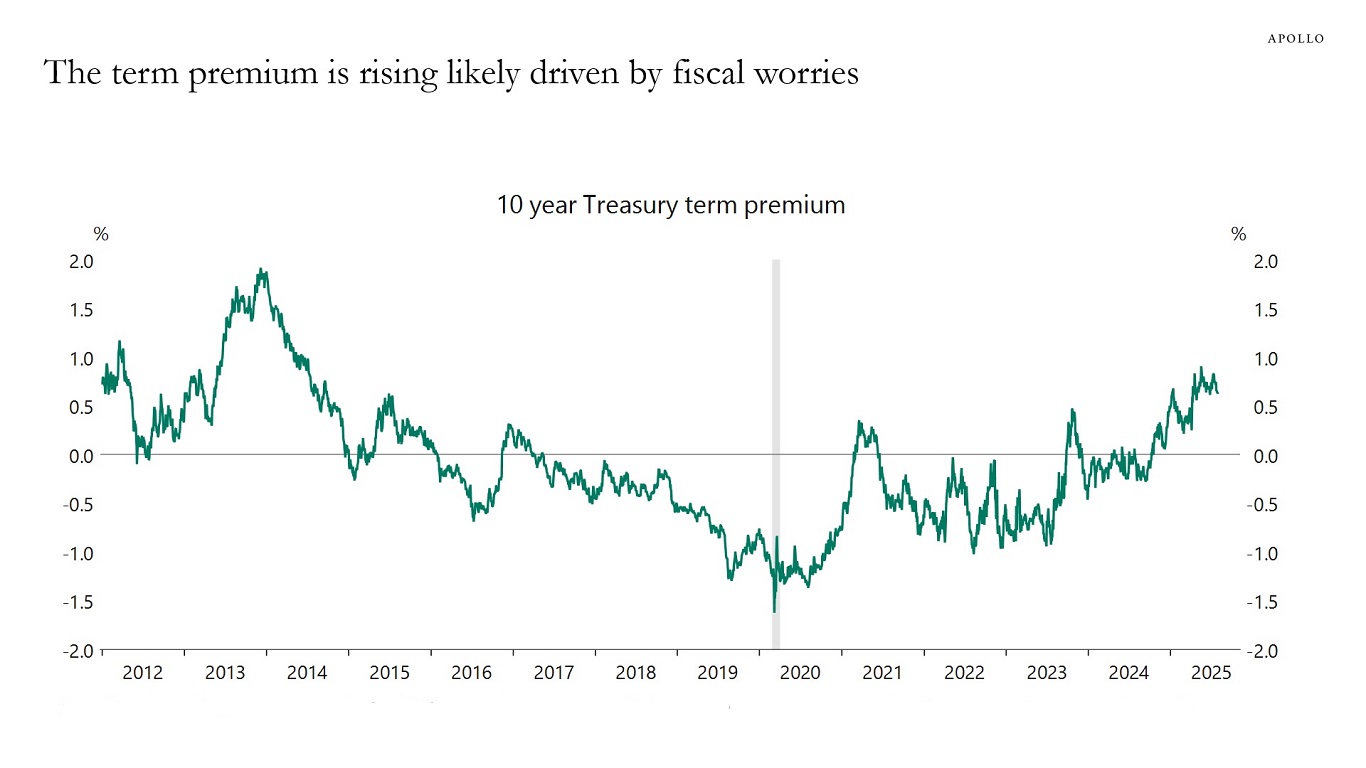
Note: The NY Fed measure for the term premium is based on a five-factor, no-arbitrage term structure model. Sources: Federal Reserve Bank of New York, Macrobond, Apollo Chief Economist 
See important disclaimers at the bottom of the page.

This presentation may not be distributed, transmitted or otherwise communicated to others in whole or in part without the express consent of Apollo Global Management, Inc. (together with its subsidiaries, “Apollo”).
Apollo makes no representation or warranty, expressed or implied, with respect to the accuracy, reasonableness, or completeness of any of the statements made during this presentation, including, but not limited to, statements obtained from third parties. Opinions, estimates and projections constitute the current judgment of the speaker as of the date indicated. They do not necessarily reflect the views and opinions of Apollo and are subject to change at any time without notice. Apollo does not have any responsibility to update this presentation to account for such changes. There can be no assurance that any trends discussed during this presentation will continue.
Statements made throughout this presentation are not intended to provide, and should not be relied upon for, accounting, legal or tax advice and do not constitute an investment recommendation or investment advice. Investors should make an independent investigation of the information discussed during this presentation, including consulting their tax, legal, accounting or other advisors about such information. Apollo does not act for you and is not responsible for providing you with the protections afforded to its clients. This presentation does not constitute an offer to sell, or the solicitation of an offer to buy, any security, product or service, including interest in any investment product or fund or account managed or advised by Apollo.
Certain statements made throughout this presentation may be “forward-looking” in nature. Due to various risks and uncertainties, actual events or results may differ materially from those reflected or contemplated in such forward-looking information. As such, undue reliance should not be placed on such statements. Forward-looking statements may be identified by the use of terminology including, but not limited to, “may”, “will”, “should”, “expect”, “anticipate”, “target”, “project”, “estimate”, “intend”, “continue” or “believe” or the negatives thereof or other variations thereon or comparable terminology.