


The Daily Spark is moving to Apollo.com— read the latest from Torsten Slok here.
Want it delivered daily to your inbox?
-
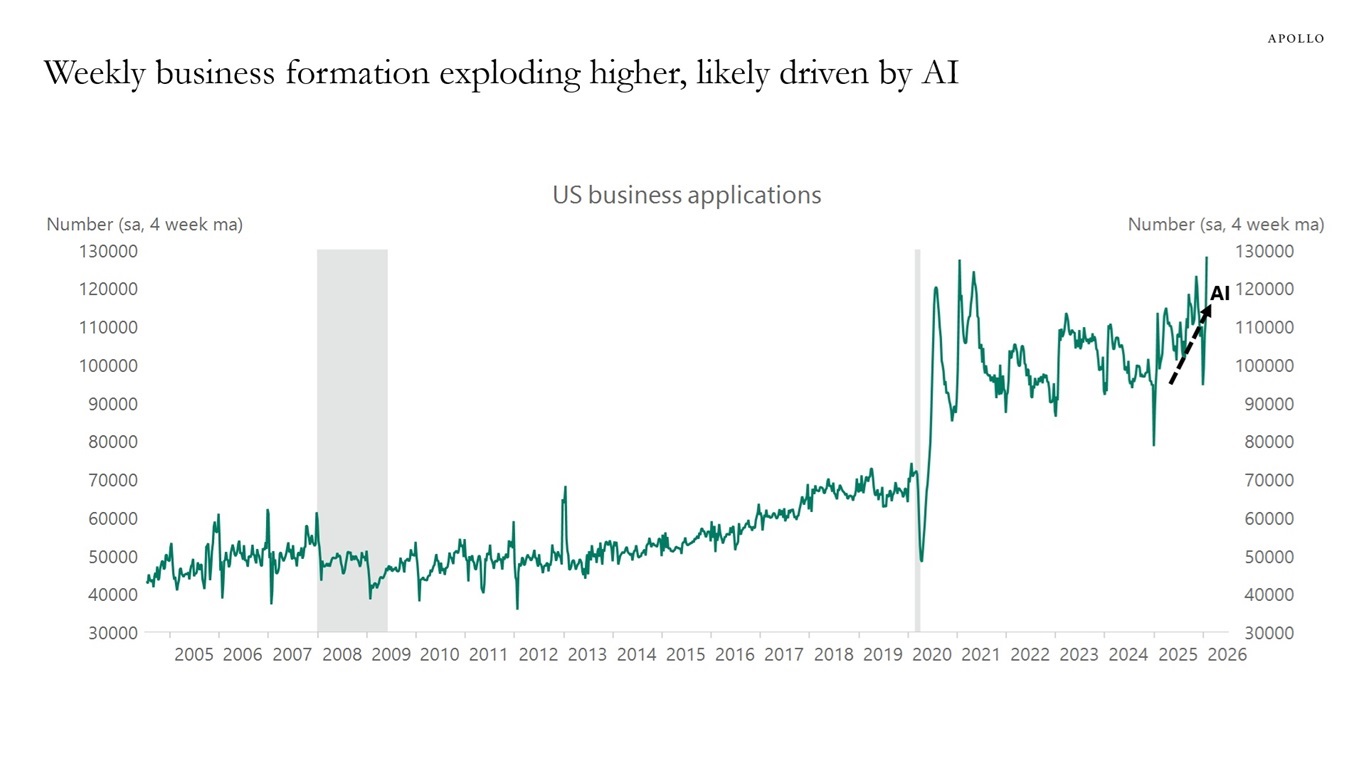
The surge in new US business formation is being fueled by AI and large language models that are dramatically reducing the cost and complexity of launching a company, see chart below. As these firms scale, they will create jobs, underscoring that AI is likely to strengthen, not disrupt, the US labor market.
Sources: US Census Bureau, Macrobond, Apollo Chief Economist See important disclaimers at the bottom of the page.
-
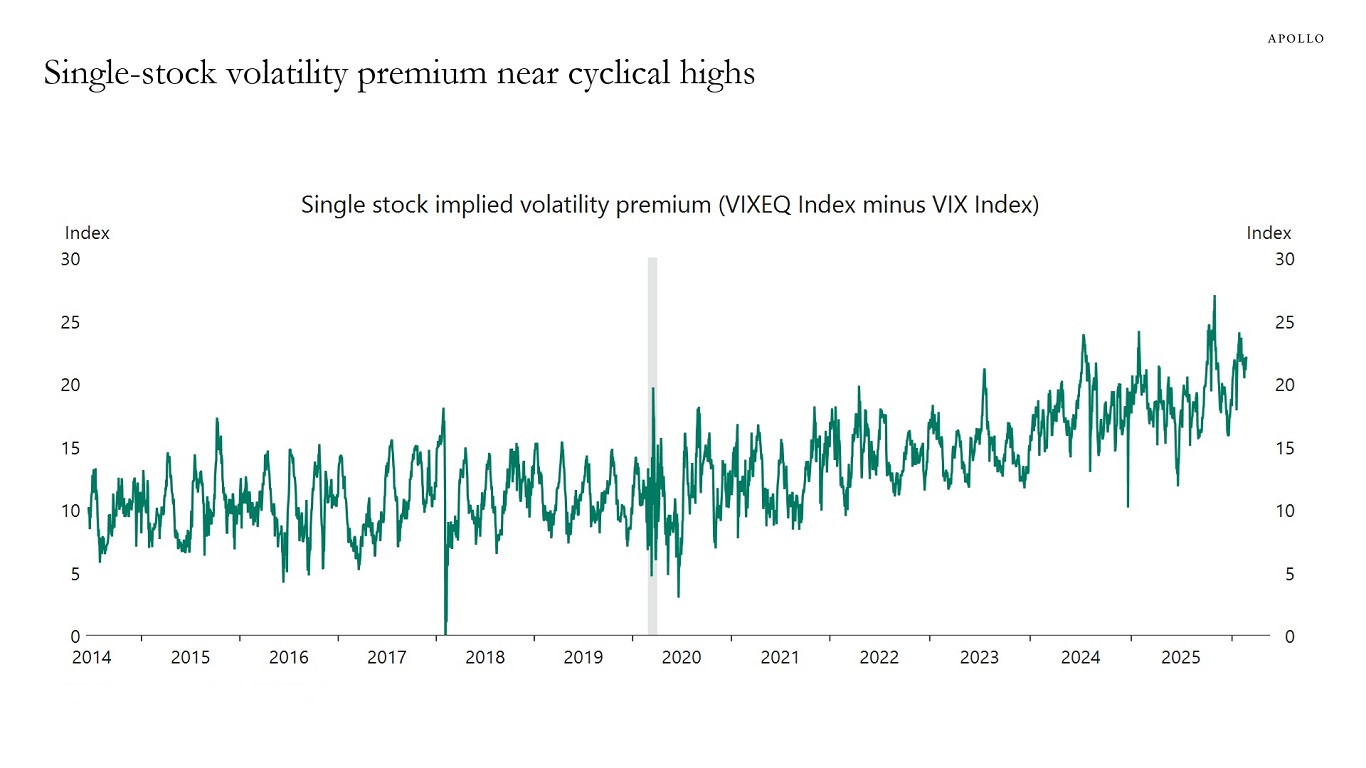
Single-stock implied volatility continues to trade at a historically wide premium to index volatility, reflecting structurally lower implied correlation and persistent demand for idiosyncratic protection. Investors appear less concerned about macro shocks and more focused on widening dispersion between winners and losers in an increasingly concentrated equity market grappling with the implications of AI.
Sources: Bloomberg, Macrobond, Apollo Chief Economist See important disclaimers at the bottom of the page.
-
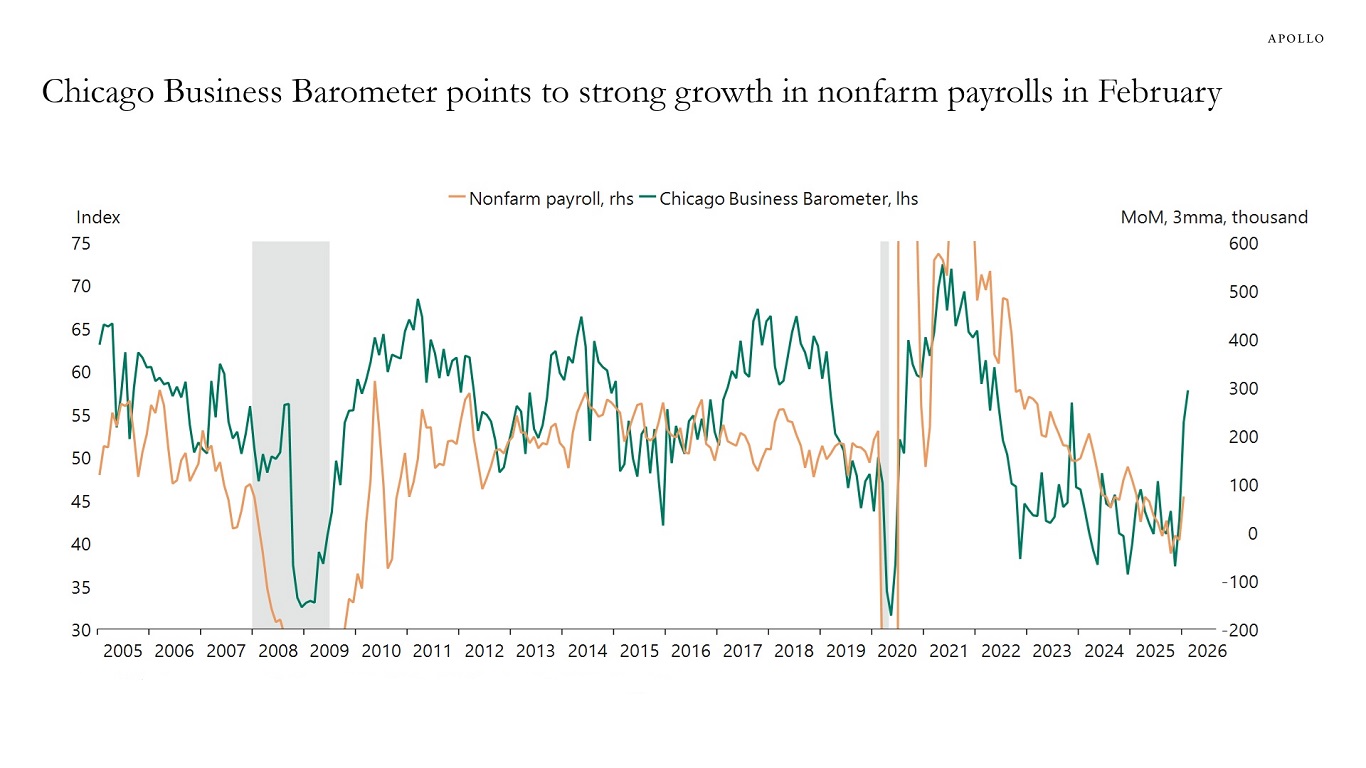
The Chicago Business Barometer for February showed strong improvements across production, employment, new orders and deliveries, see chart below. Perhaps we are underestimating the positive effects of the One Big Beautiful Bill, which took effect on January 1. The CBO estimates that it will boost GDP growth by 0.9% in 2026, and the chart below suggests that nonfarm payrolls in February could be significantly stronger than the 58,000 currently expected by consensus.
Sources: Market News International, US Bureau of Labor Statistics (BLS), Macrobond, Apollo Chief Economist See important disclaimers at the bottom of the page.
-
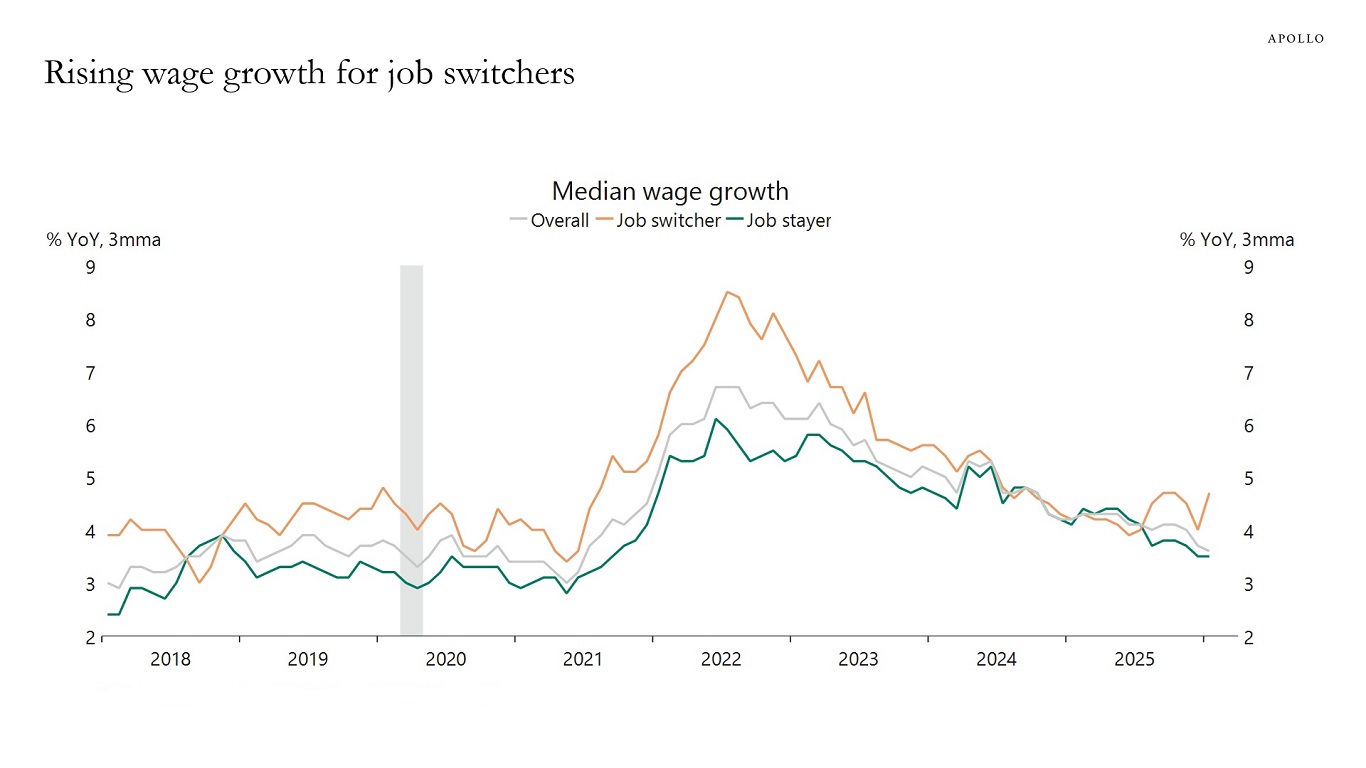
With low immigration and strong tailwinds to growth from AI spending, the industrial renaissance and the One Big Beautifull Bill, it is not a surprise that wage growth is rising for job switchers, see chart below.
Sources: Federal Reserve Bank of Atlanta, Macrobond, Apollo Chief Economist See important disclaimers at the bottom of the page.
-
The Strait of Hormuz is a key chokepoint for global oil trade, making any disruption an immediate risk to energy prices and macro outcomes. Our chart book, available here, examines energy demand and supply, as well as the significance of the Strait of Hormuz.
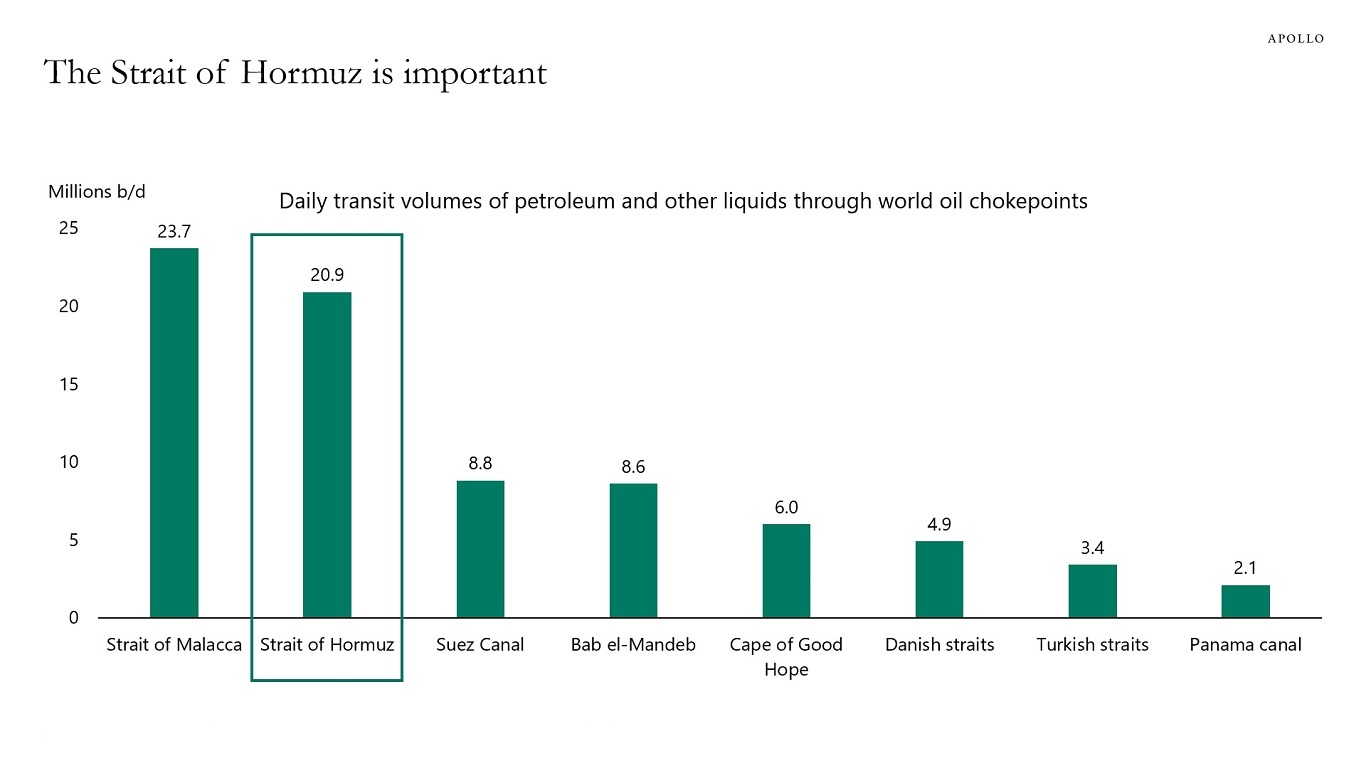
Sources: US Energy Information Administration (EIA) analysis, based on Vortexa tanker tracking and Panama Canal, Apollo Chief Economist 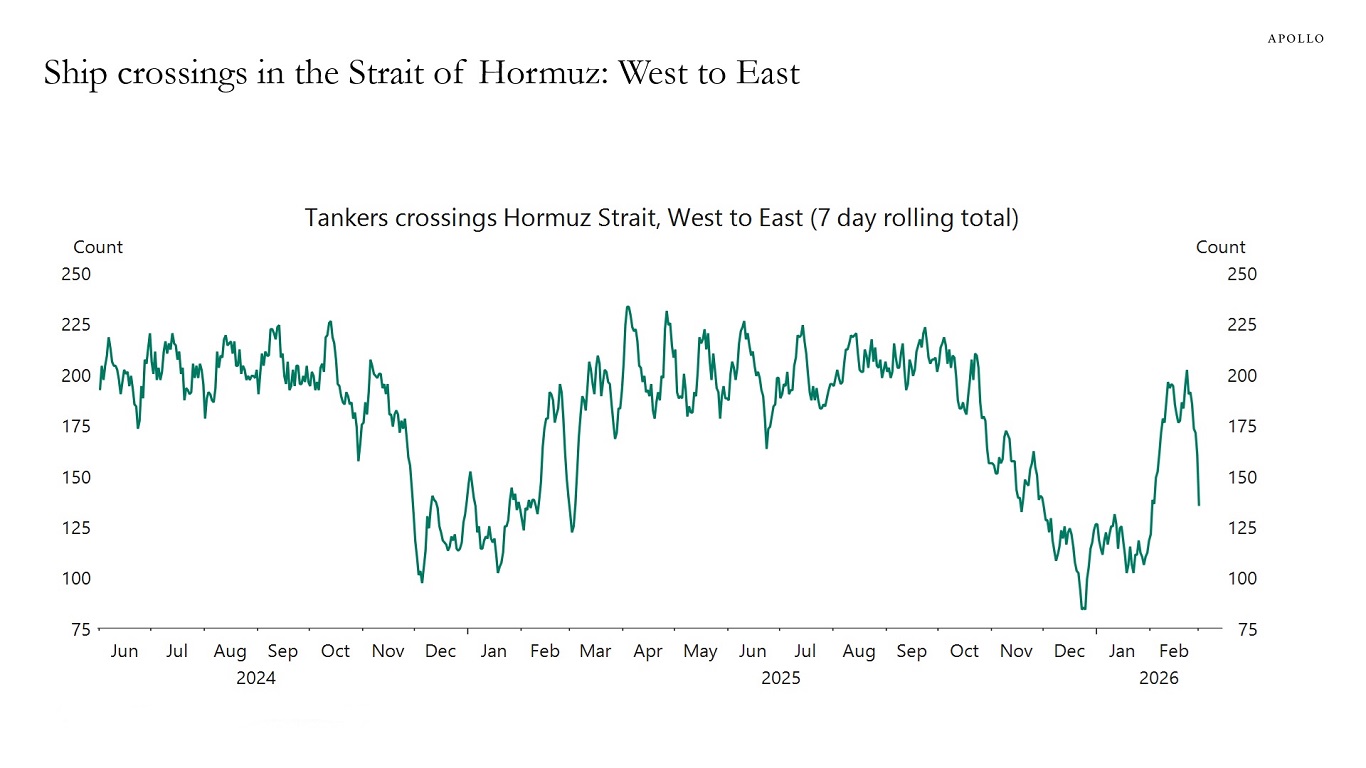
Sources: Bloomberg, Macrobond, Apollo Chief Economist 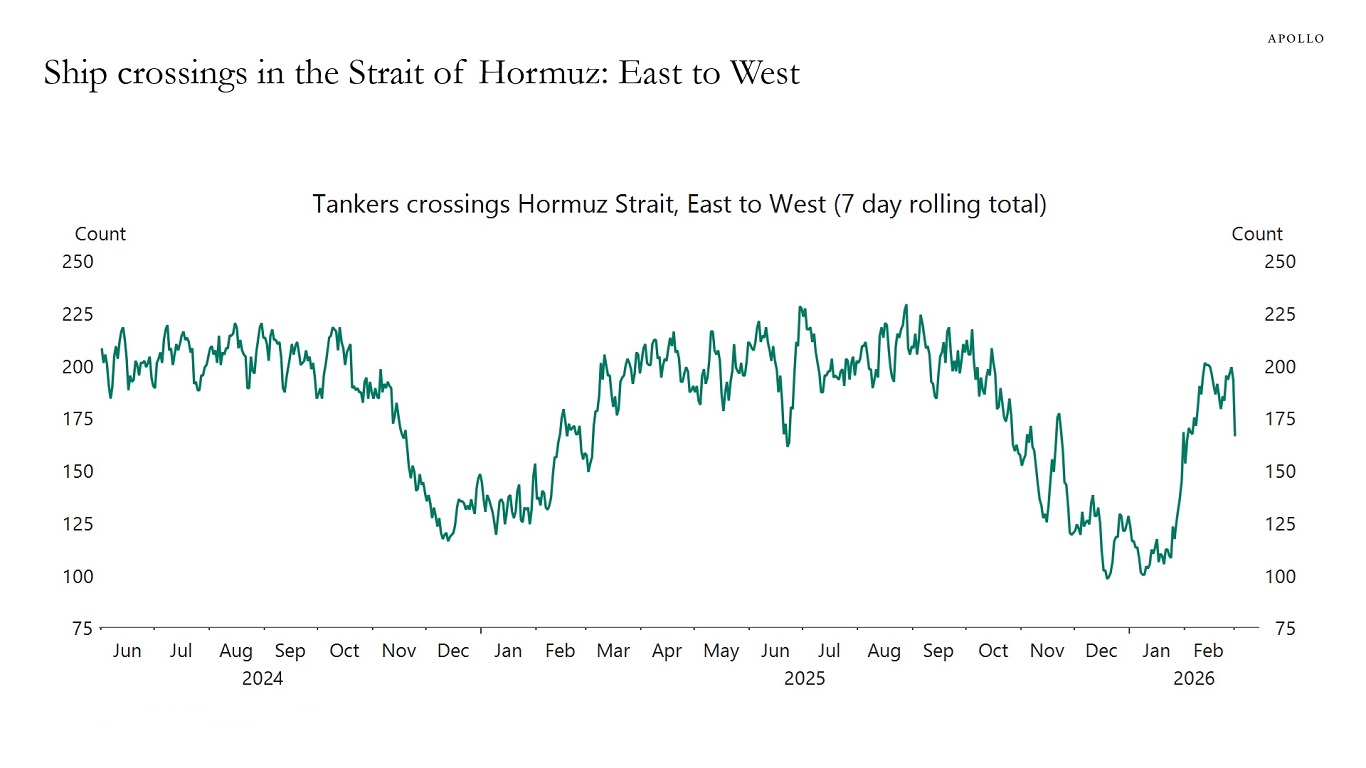
Sources: Bloomberg, Macrobond, Apollo Chief Economist 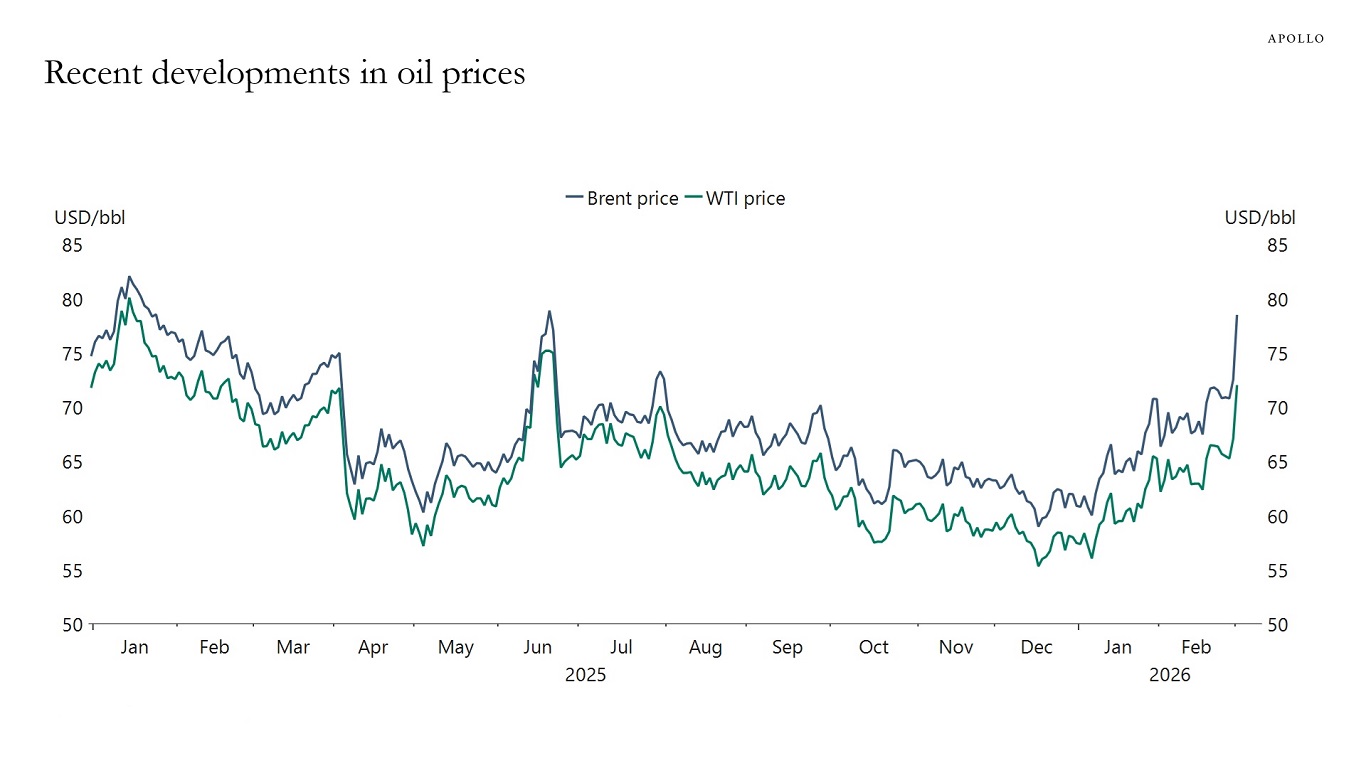
Sources: Bloomberg, Macrobond, Apollo Chief Economist 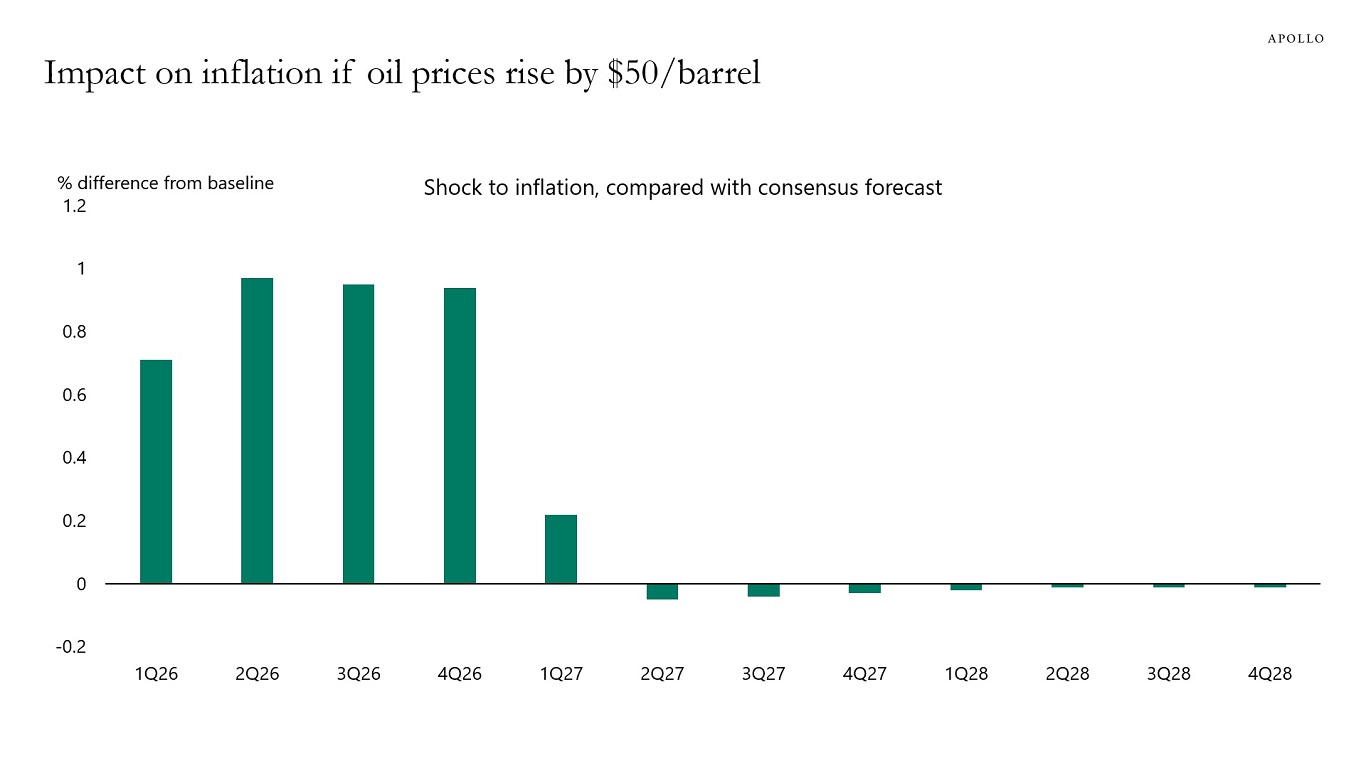
Note: Assumptions: If oil prices rise by $50/bbl in 1Q26. Sources: Bloomberg SHOK model, Apollo Chief Economist See important disclaimers at the bottom of the page.
-
Foreign demand for US assets remains very strong, see chart below.
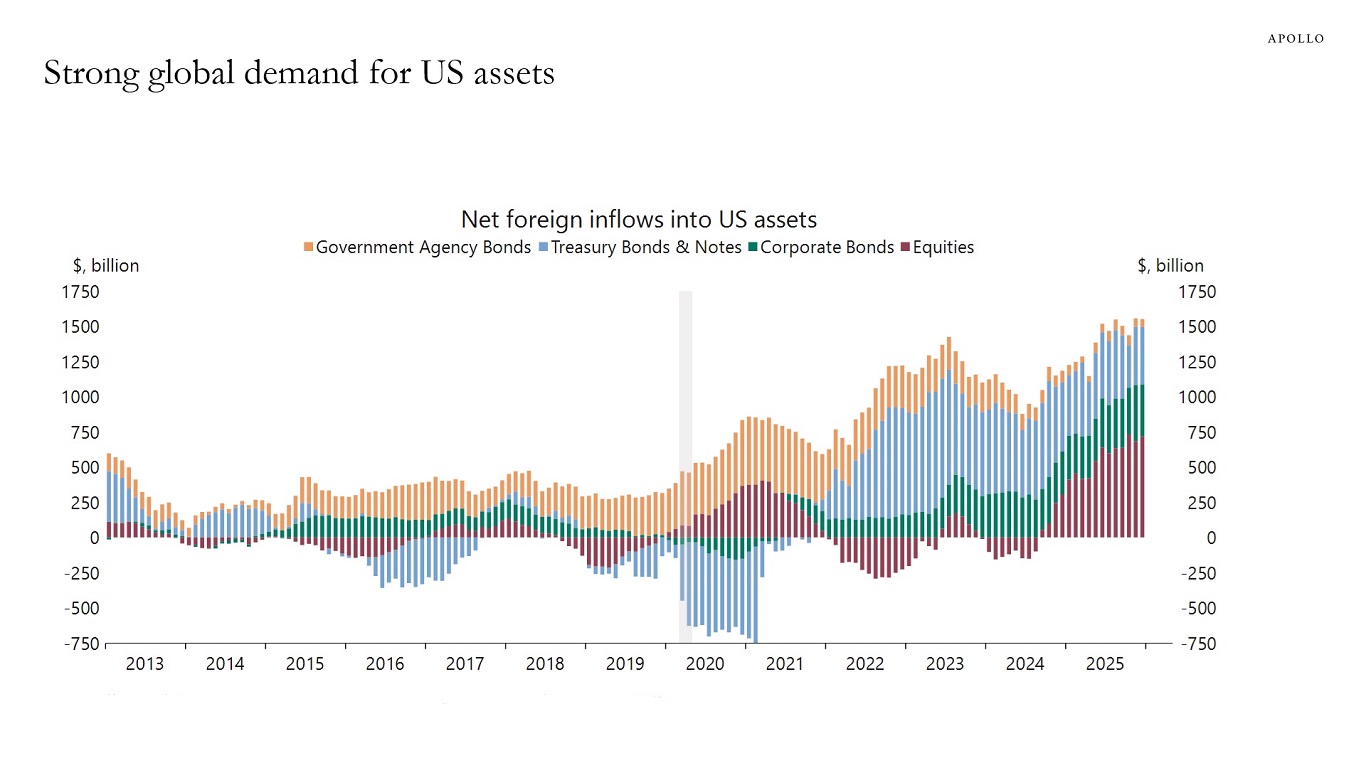
Note: Data is a 12-month rolling sum. Sources: US Department of Treasury, Macrobond, Apollo Chief Economist See important disclaimers at the bottom of the page.
-
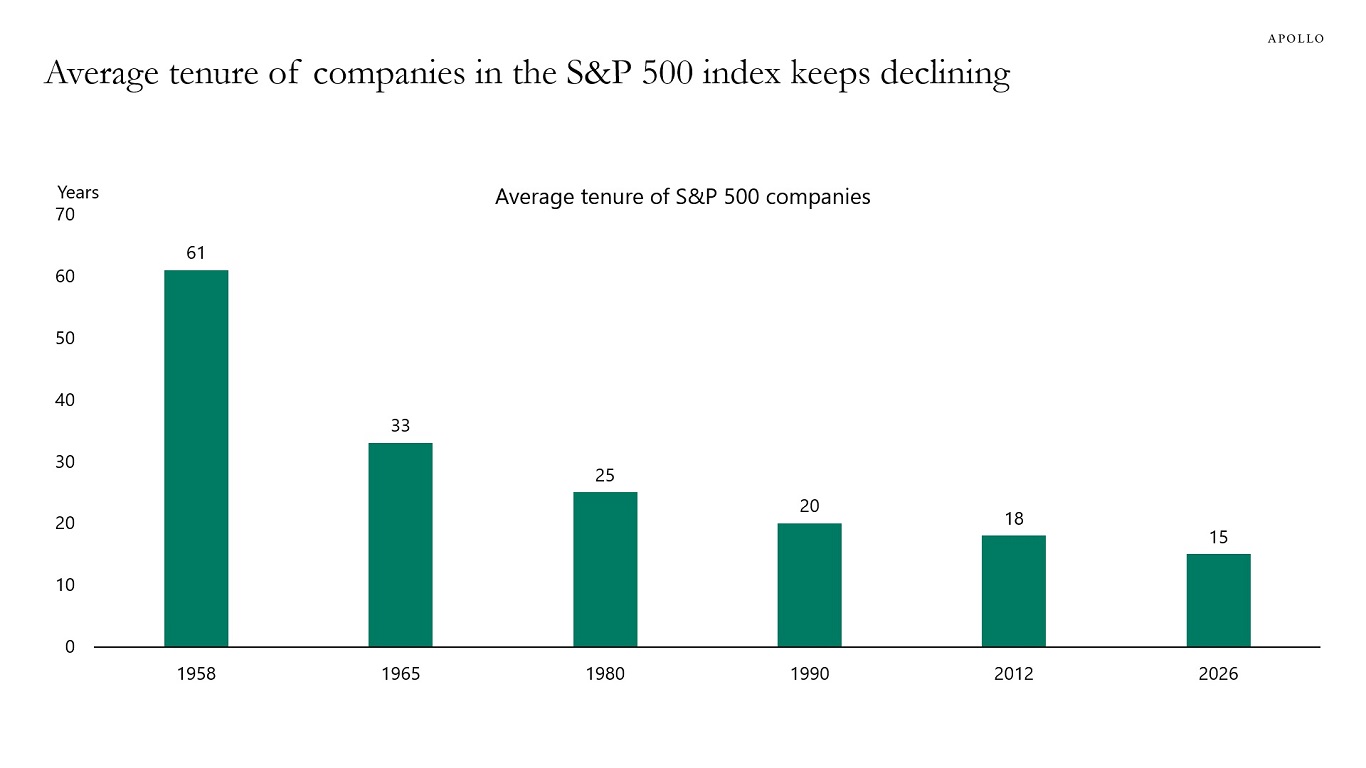
The average number of years a company remains in the S&P 500 index keeps declining.
Several factors are driving the faster churn in the index:
1. Creative destruction operates more rapidly, shortening the typical time a company remains large and competitive enough to stay in the S&P 500.
2. Technological innovation (IT, internet, AI, cloud, mobile) creates new business models that scale quickly and displace incumbents before they can adapt.
3. M&A and private equity activity more regularly remove large firms from public markets via buyouts or mergers.
The bottom line is that companies in the S&P 500 stay successful for shorter and shorter periods.
Sources: Creative Destruction Whips Through Corporate America, Corporate Longevity: Turbulence Ahead for Large Organizations – Executive Briefing, 2021 Corporate Longevity Forecast | Innosight, Apollo Chief Economist See important disclaimers at the bottom of the page.
-
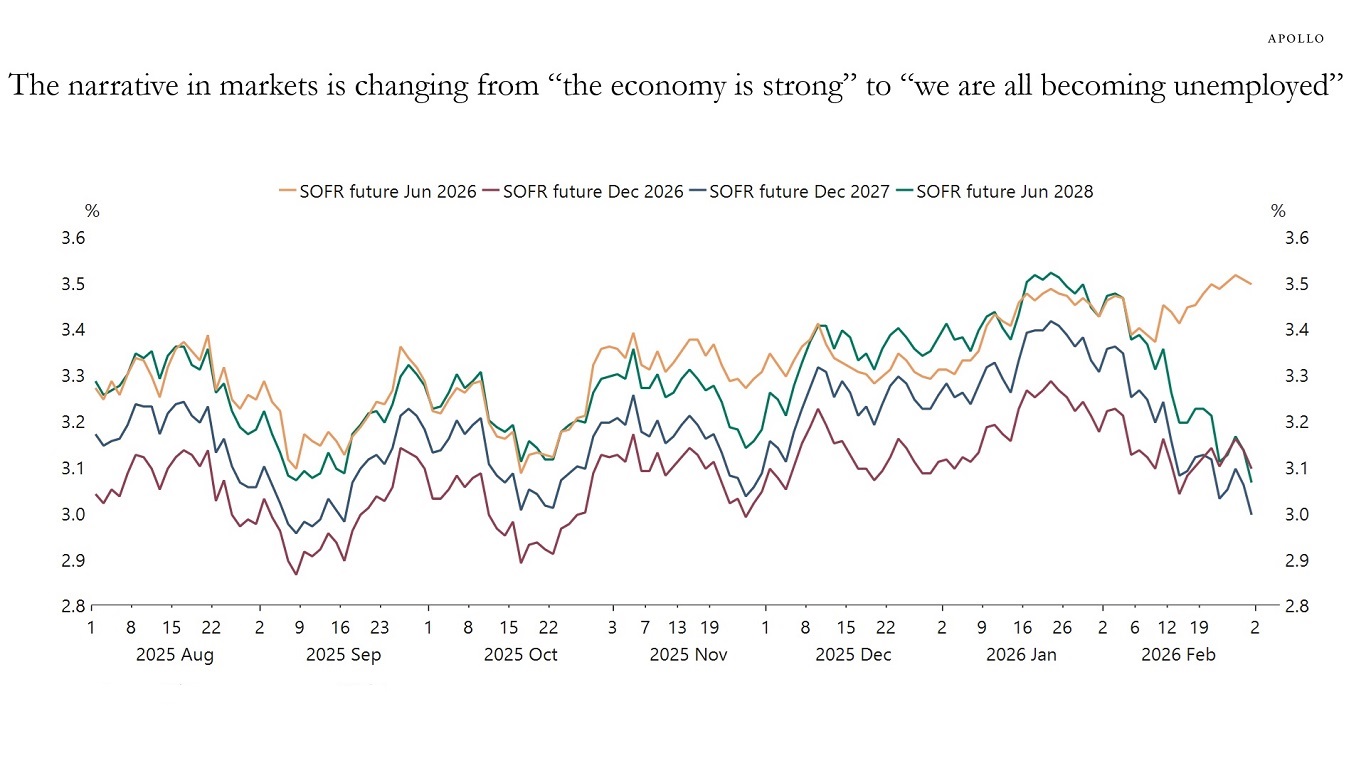
The dramatic change in recent weeks in the narrative in markets from “the economy is strong” to “we are all becoming unemployed” is truly remarkable.
AI expectations are no longer just disrupting the equity market, with sectors such as software under pressure.
AI expectations have also sparked a macro conversation about a coming rise in the unemployment rate, despite no change in the underlying incoming economic story of a strong US economy driven by AI spending, the industrial renaissance and the One Big Beautiful Bill.
The bottom line is that rates investors are now pricing in rapid AI adoption that will push the unemployment rate higher and warrant many more Fed cuts by December 2026, see chart below.
In other words, markets are starting to believe the techno-optimists’ view of the world, rather than the more measured Fed and economist view.
I think the techno-optimists are wrong about the macro impact, and AI adoption is going to take much longer than the 12-18 months they talk about, and the overall impact on productivity will be much more muted.
Put differently, looking ahead to December 2026, the risk of an overheating economy remains larger than the risk of the unemployment rate going to 10%.
Sources: Bloomberg, Macrobond, Apollo Chief Economist See important disclaimers at the bottom of the page.
-
The average daily US equity market turnover now exceeds $1 trillion, driven by higher retail participation, more high-frequency trading and recent tech-sector volatility, see chart below.
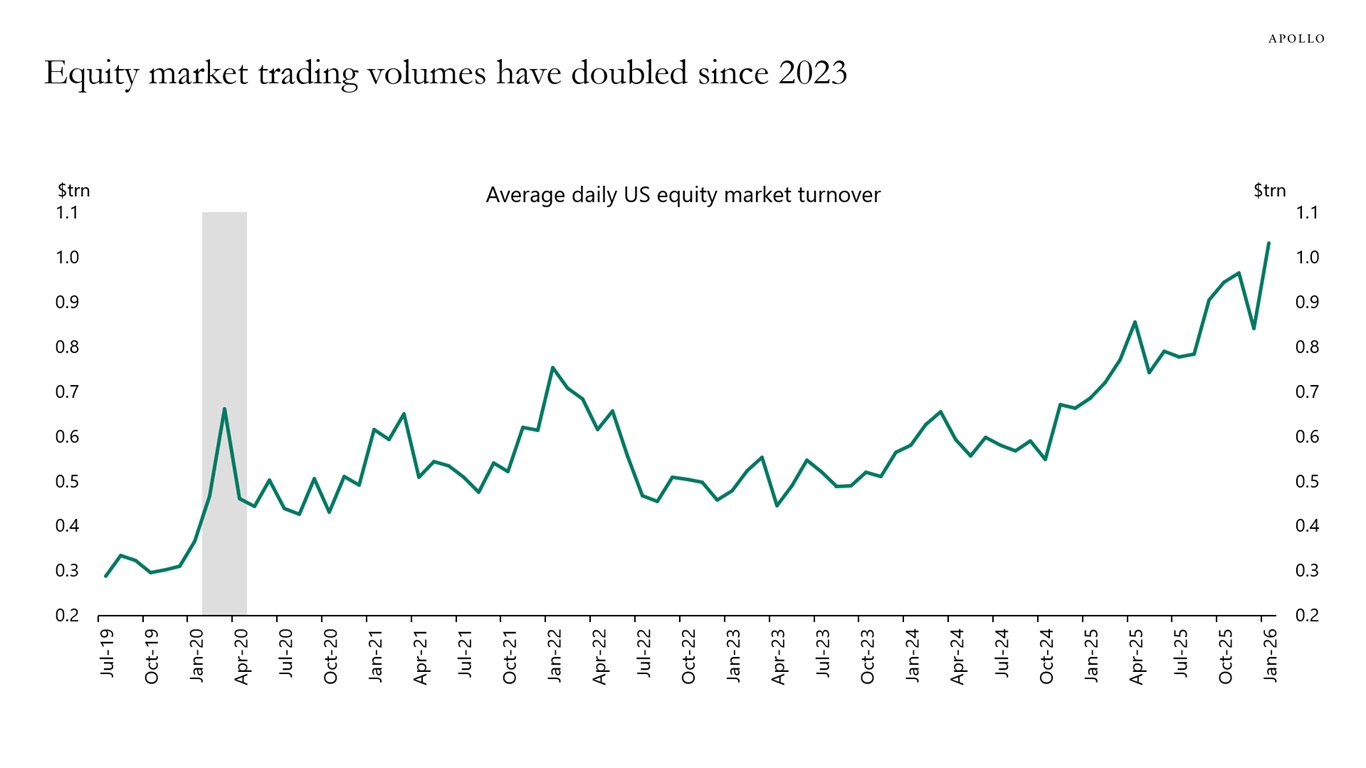
Sources: Bloomberg, Apollo Chief Economist See important disclaimers at the bottom of the page.
-
Economic research institutions have identified sectors and occupations that are likely to be vulnerable to AI, see for example here, here and here.
But employment declines in AI-exposed industries since 2022 are being overattributed to ChatGPT, see the first chart below.
Since late 2022, those same industries have also been hit by three major overlapping shocks: Fed tightening, trade-war uncertainty and a meaningful slowdown in immigration-driven labor supply.
The bottom line is that a large share of the AI-sensitive sectors of the economy is also rate, trade or immigration-sensitive, see the second chart.
Hence, the slowdown in employment in AI-exposed sectors is likely driven by some combination of all these factors rather than only AI.
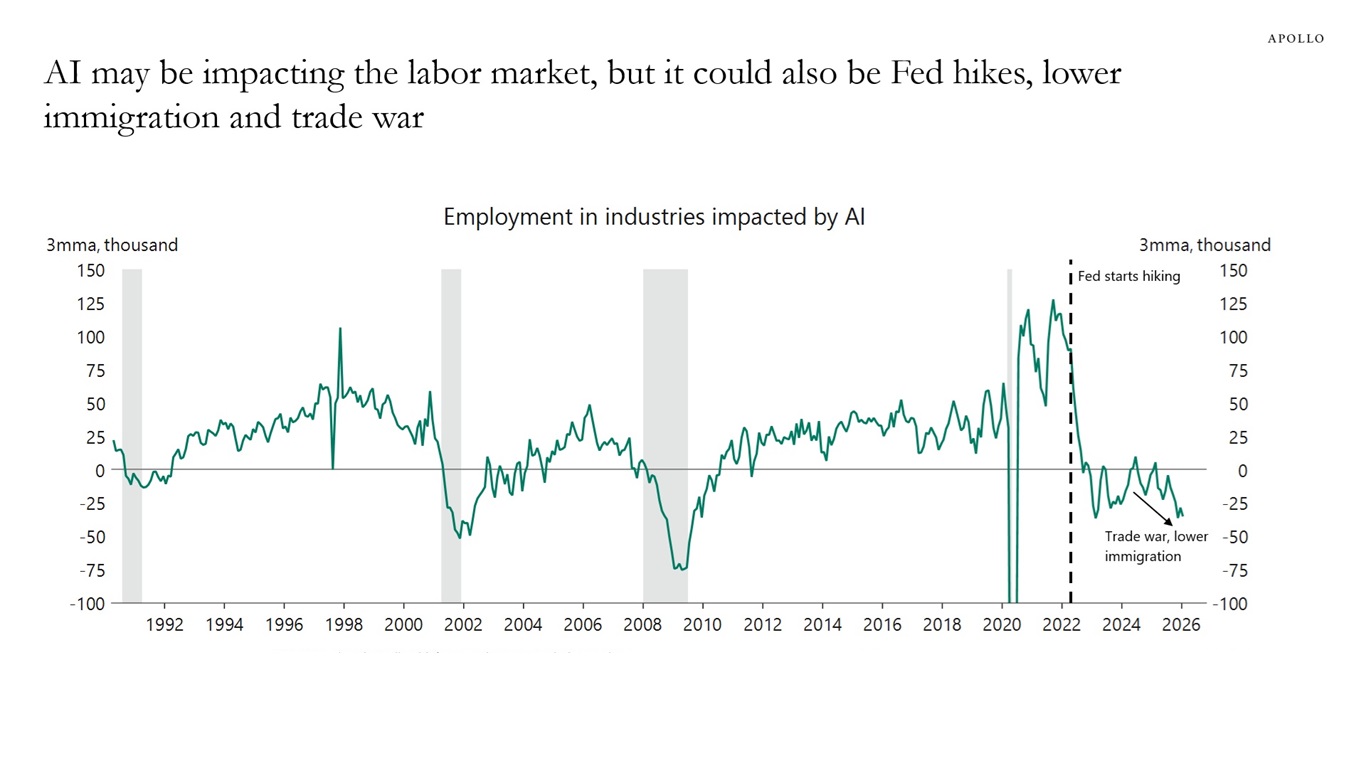
Note: Includes employment in professional & business services, office & administrative services, accounting & book keeping, legal services, computer systems design, public relations, publishing, broadcasting, data processing & hosting, credit intermediation, insurance, warehousing & storage, couriers & messengers, transportation support services, telecommunications, medical & diagnostic laboratories and motion picture & sound recording industries. Sources: US Bureau of Labor Statistics (BLS), Macrobond, Apollo Chief Economist 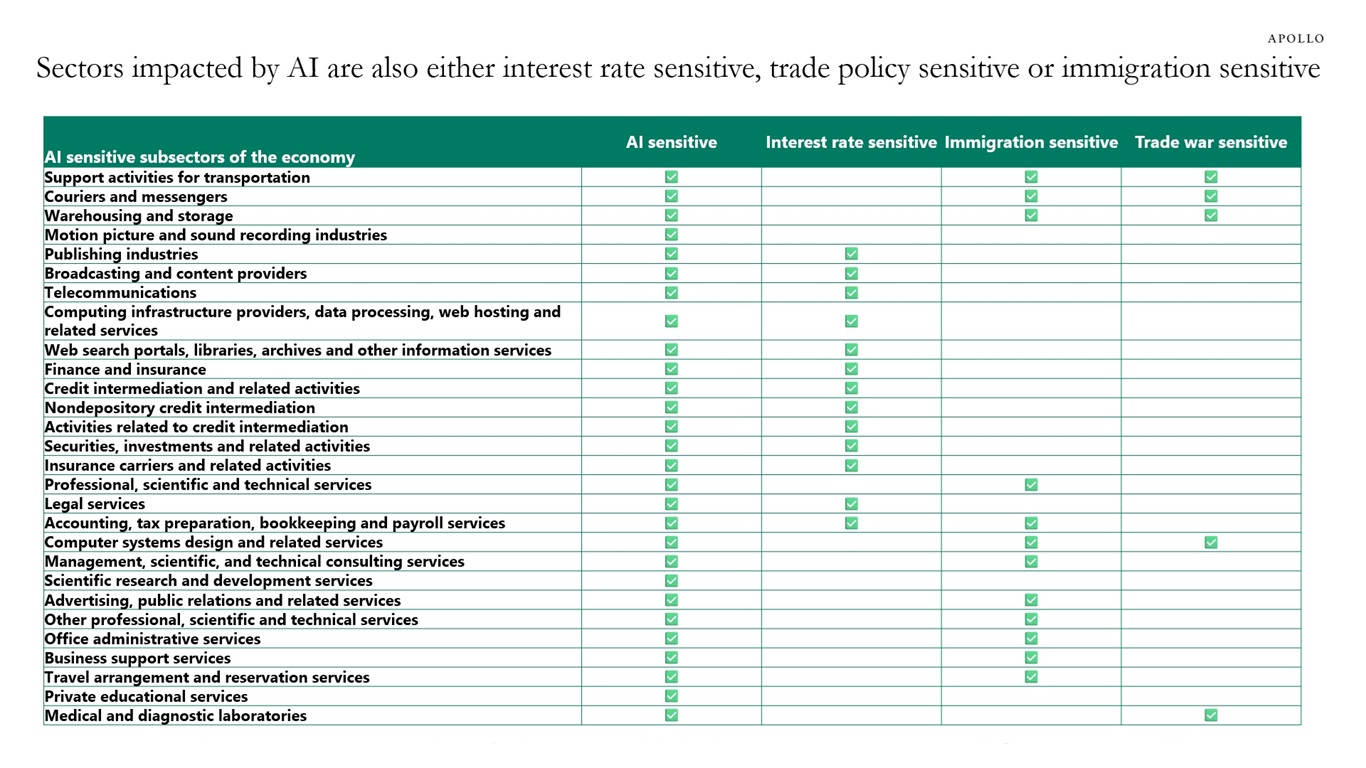
Source: Apollo Chief Economist, Fed: Educational Exposure to Generative Artificial Intelligence, https://www.federalreserve.gov/econres/notes/feds-notes/educational-exposure-to-generative-artificial-intelligence-20250226.html, February 2025 See important disclaimers at the bottom of the page.

This presentation may not be distributed, transmitted or otherwise communicated to others in whole or in part without the express consent of Apollo Global Management, Inc. (together with its subsidiaries, “Apollo”).
Apollo makes no representation or warranty, expressed or implied, with respect to the accuracy, reasonableness, or completeness of any of the statements made during this presentation, including, but not limited to, statements obtained from third parties. Opinions, estimates and projections constitute the current judgment of the speaker as of the date indicated. They do not necessarily reflect the views and opinions of Apollo and are subject to change at any time without notice. Apollo does not have any responsibility to update this presentation to account for such changes. There can be no assurance that any trends discussed during this presentation will continue.
Statements made throughout this presentation are not intended to provide, and should not be relied upon for, accounting, legal or tax advice and do not constitute an investment recommendation or investment advice. Investors should make an independent investigation of the information discussed during this presentation, including consulting their tax, legal, accounting or other advisors about such information. Apollo does not act for you and is not responsible for providing you with the protections afforded to its clients. This presentation does not constitute an offer to sell, or the solicitation of an offer to buy, any security, product or service, including interest in any investment product or fund or account managed or advised by Apollo.
Certain statements made throughout this presentation may be “forward-looking” in nature. Due to various risks and uncertainties, actual events or results may differ materially from those reflected or contemplated in such forward-looking information. As such, undue reliance should not be placed on such statements. Forward-looking statements may be identified by the use of terminology including, but not limited to, “may”, “will”, “should”, “expect”, “anticipate”, “target”, “project”, “estimate”, “intend”, “continue” or “believe” or the negatives thereof or other variations thereon or comparable terminology.