


Want it delivered daily to your inbox?
-
The number of people going to Broadway shows has been rising faster than normal in recent weeks, likely driven by the strong labor market and strong household gains in financial wealth and housing wealth.
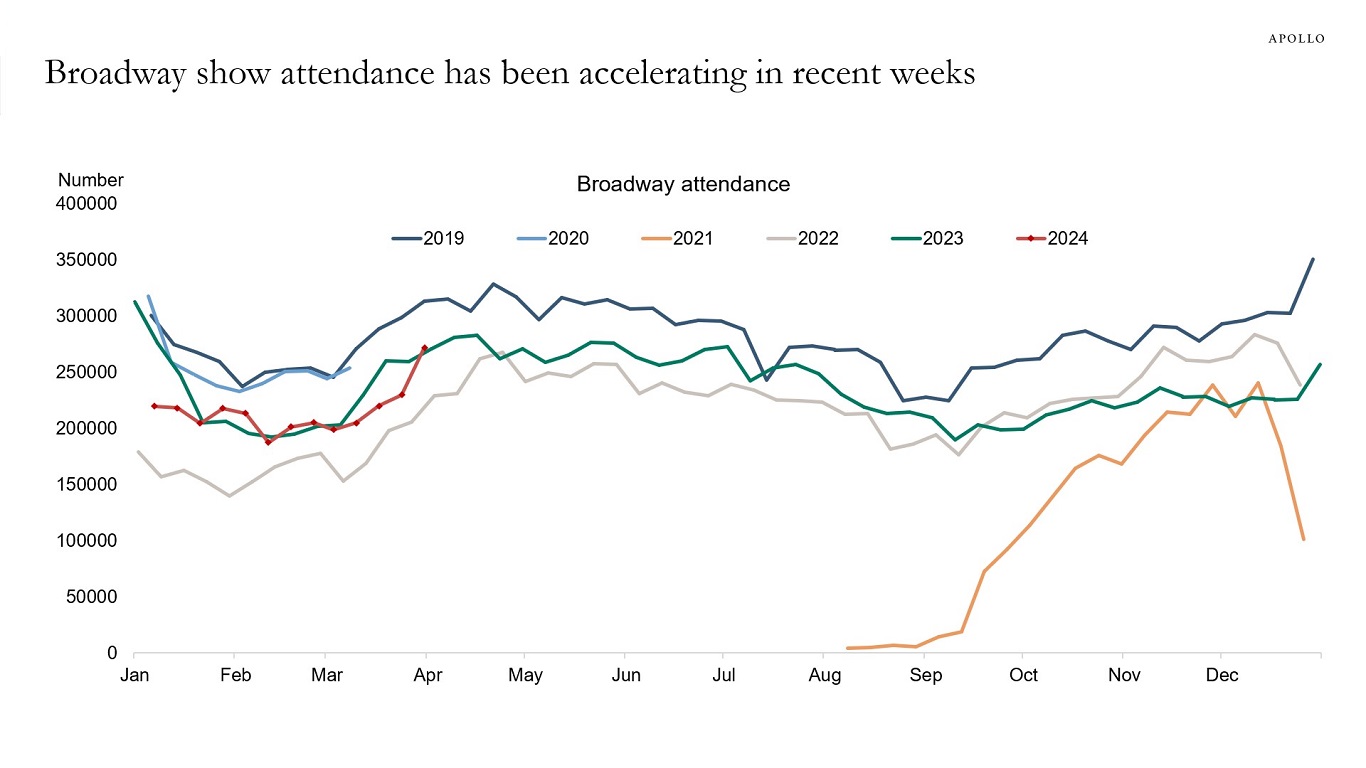
Source: Internet Broadway Database, Apollo Chief Economist See important disclaimers at the bottom of the page.
-
Looking at the average age of highways, streets, and power facilities, US infrastructure has never been in worse shape than it is at the moment, see chart below.
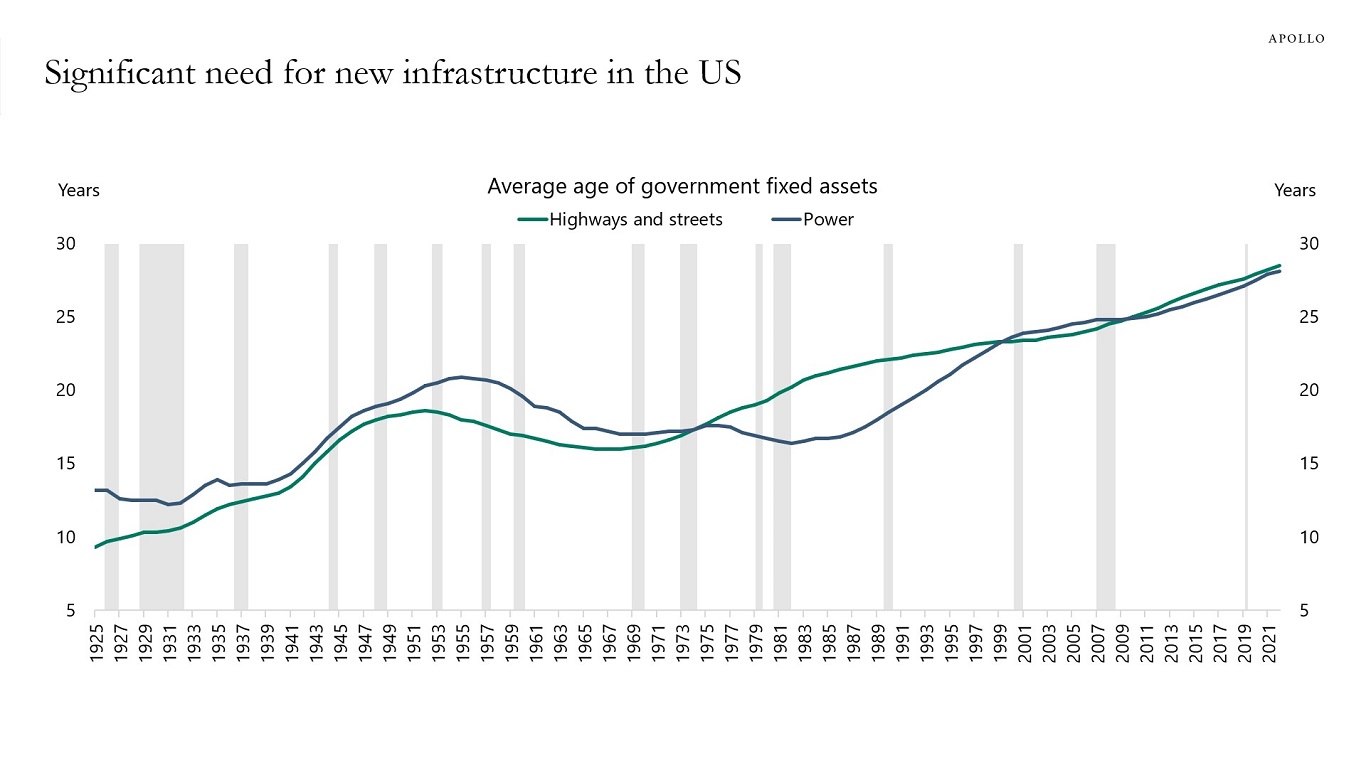
Source: BEA, Apollo Chief Economist See important disclaimers at the bottom of the page.
-
In 2023 it was all about the Magnificent Seven. Then it was the Fabulous Four. But now it is turning out that the story is actually a lot more complicated, see charts below.
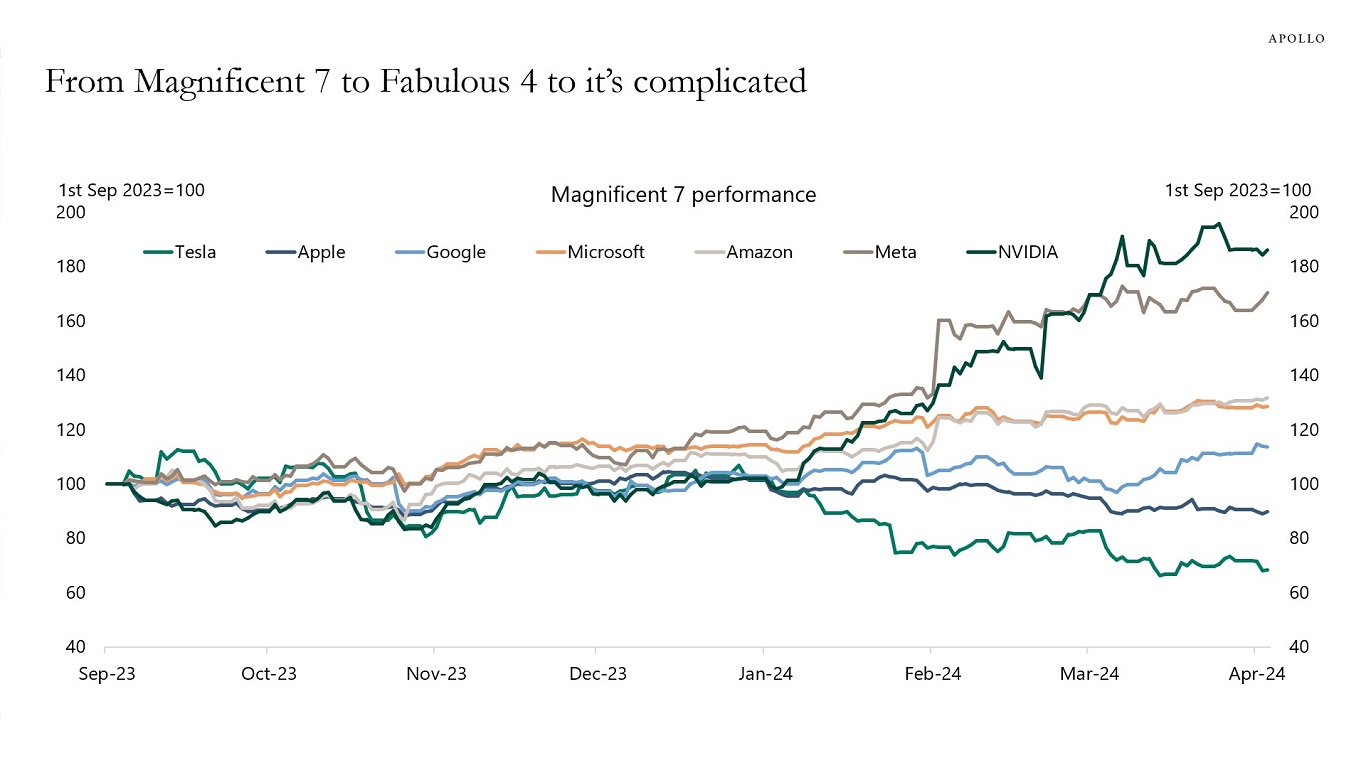
Source: Bloomberg, Apollo Chief Economist 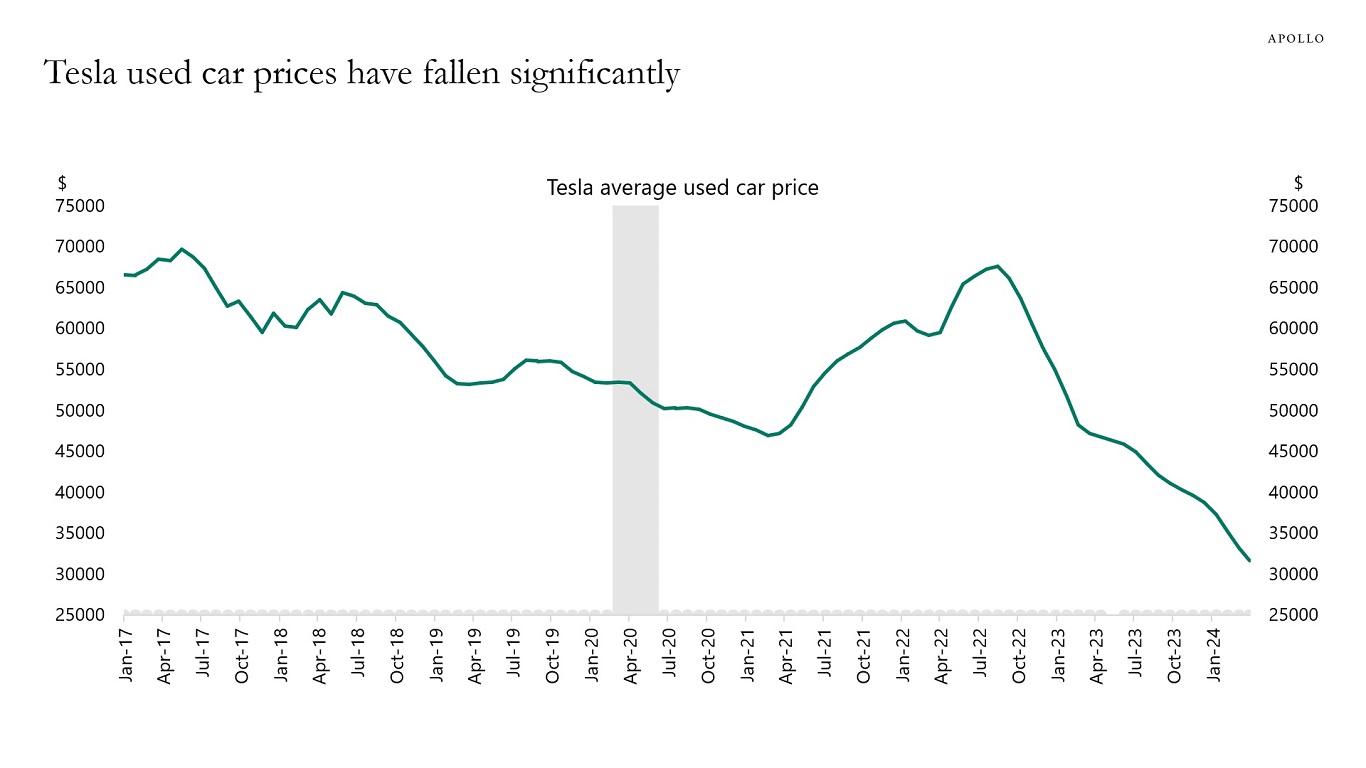
Source: Cargurus.com, Apollo Chief Economist See important disclaimers at the bottom of the page.
-
After the Fed started raising rates in March 2022, coverage ratios began to move lower, see chart below, and after the Fed turned dovish at the November 2023 FOMC meeting, coverage ratios have started to rebound.
The bottom line is that the strong economy and strong earnings combined with very easy financial conditions are helping companies manage their balance sheets, including high debt levels.
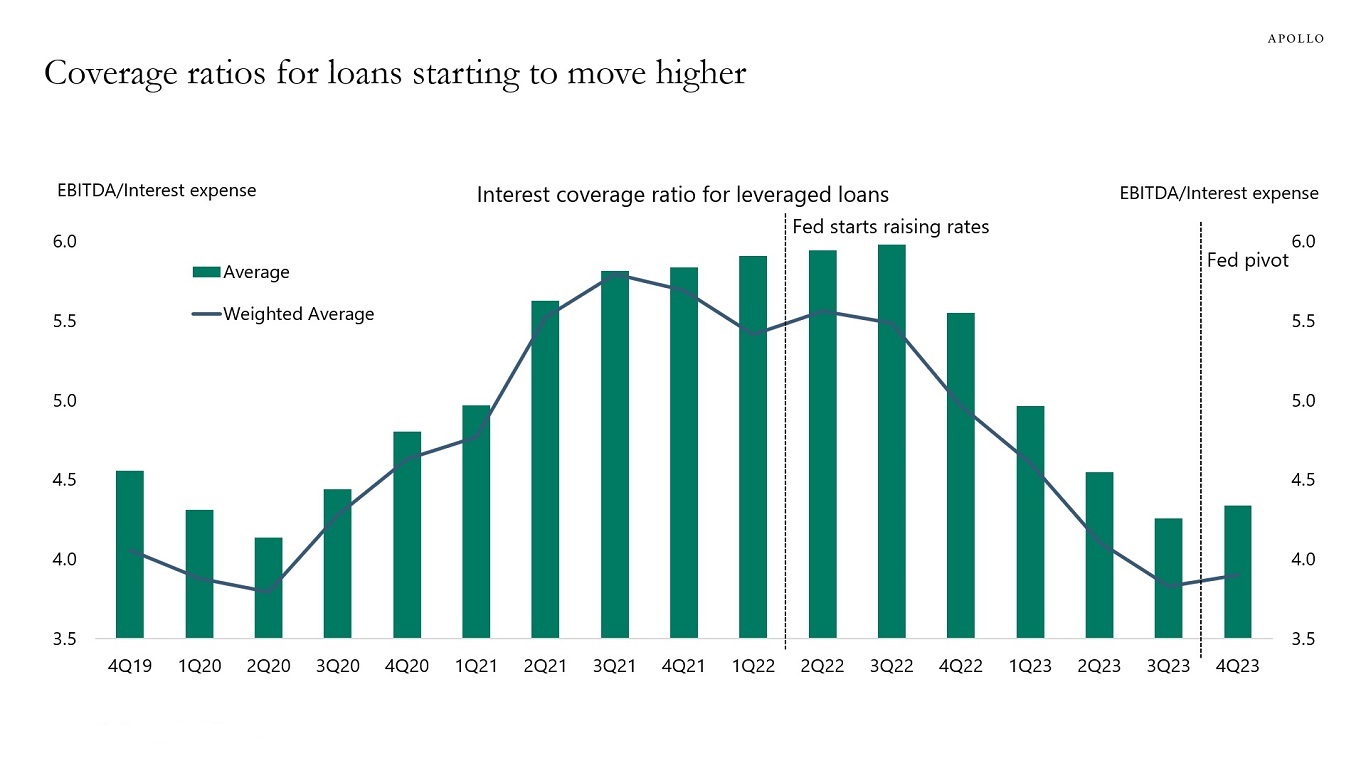
Source: Pitchbook LCD, Apollo Chief Economist See important disclaimers at the bottom of the page.
-
After the 2008 financial crisis, one out of 20 homes for sale was a new home. Today, one out of three homes for sale is a new home, see chart below.
The source of the current low inventory of existing homes for sale is the lock-in effect, as homeowners with low mortgage rates are unwilling to sell their homes and buy a new one at a much higher mortgage rate.
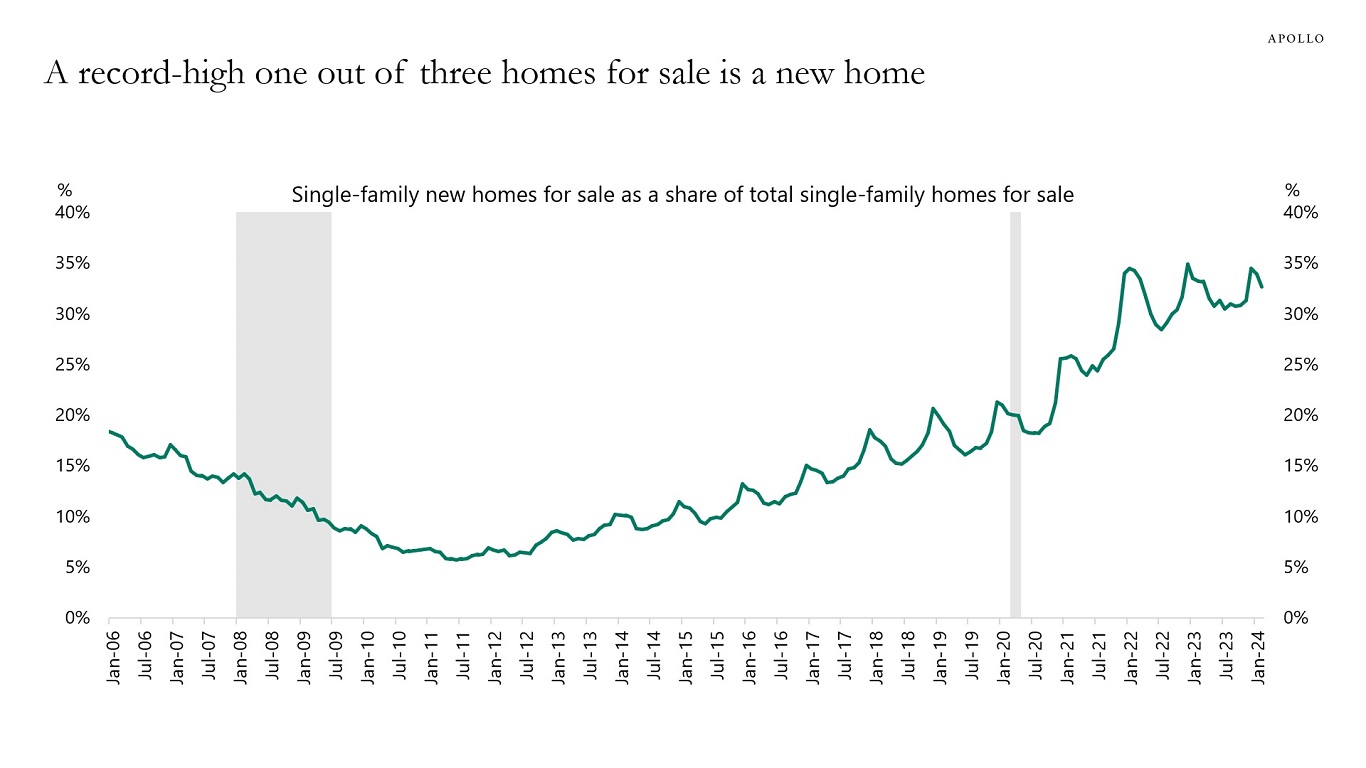
Source: NAR, Census, Haver Analytics, Apollo Chief Economist See important disclaimers at the bottom of the page.
-
The Fed’s estimate of where interest rates will be in the long run has started to move higher, likely driven by the muted response of the economy so far to Fed hikes and by structural changes in deglobalization, energy transition, and defense spending.
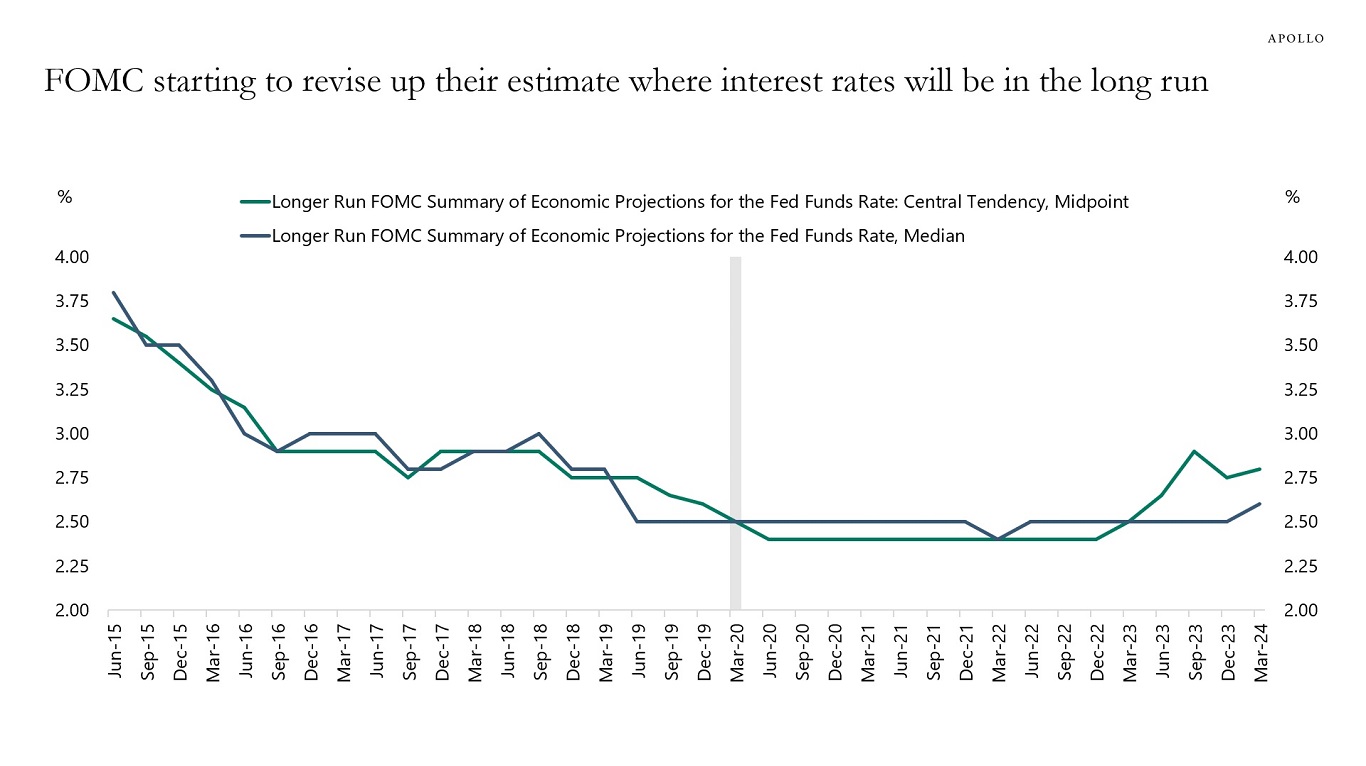
Source: FOMC, St. Louis Fed, Apollo Chief Economist See important disclaimers at the bottom of the page.
-
The median size of new single-family homes peaked at 2,473 square feet in 2016.
Today, the size of new homes being built is 2,237 square feet, see chart below.
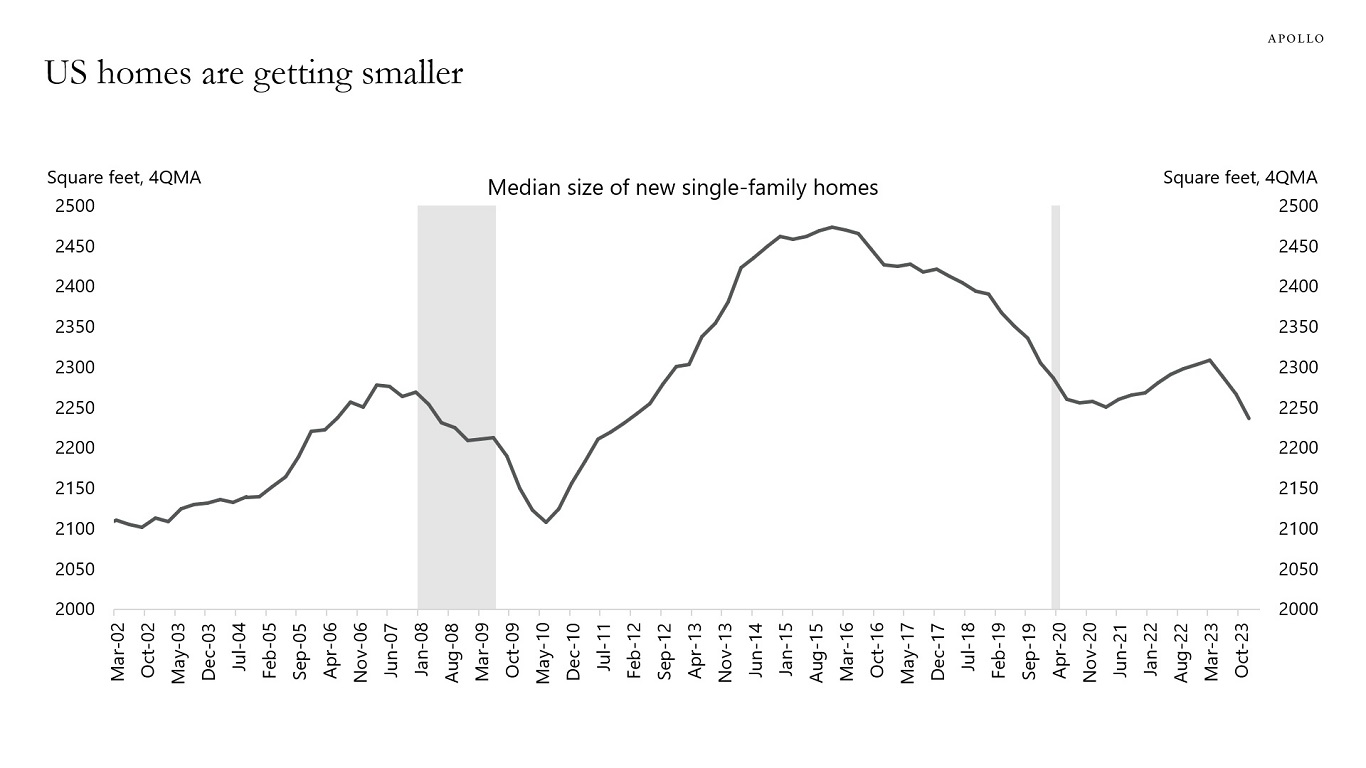
Source: Census Bureau, Haver Analytics, Apollo Chief Economist See important disclaimers at the bottom of the page.
-
After the Fed started raising rates in March 2022, the labor market started softening, with households saying that it was harder to find a job. This changed after the Fed pivot, see the first chart below.
Since December 2023, households have said that it is easier to find a job, reflecting a rebound in corporate confidence, see the second chart.
The bottom line is that the improvement we have seen in the labor market in January and February is real. Combined with low jobless claims, nonfarm payrolls are likely to surprise to the upside again in March.
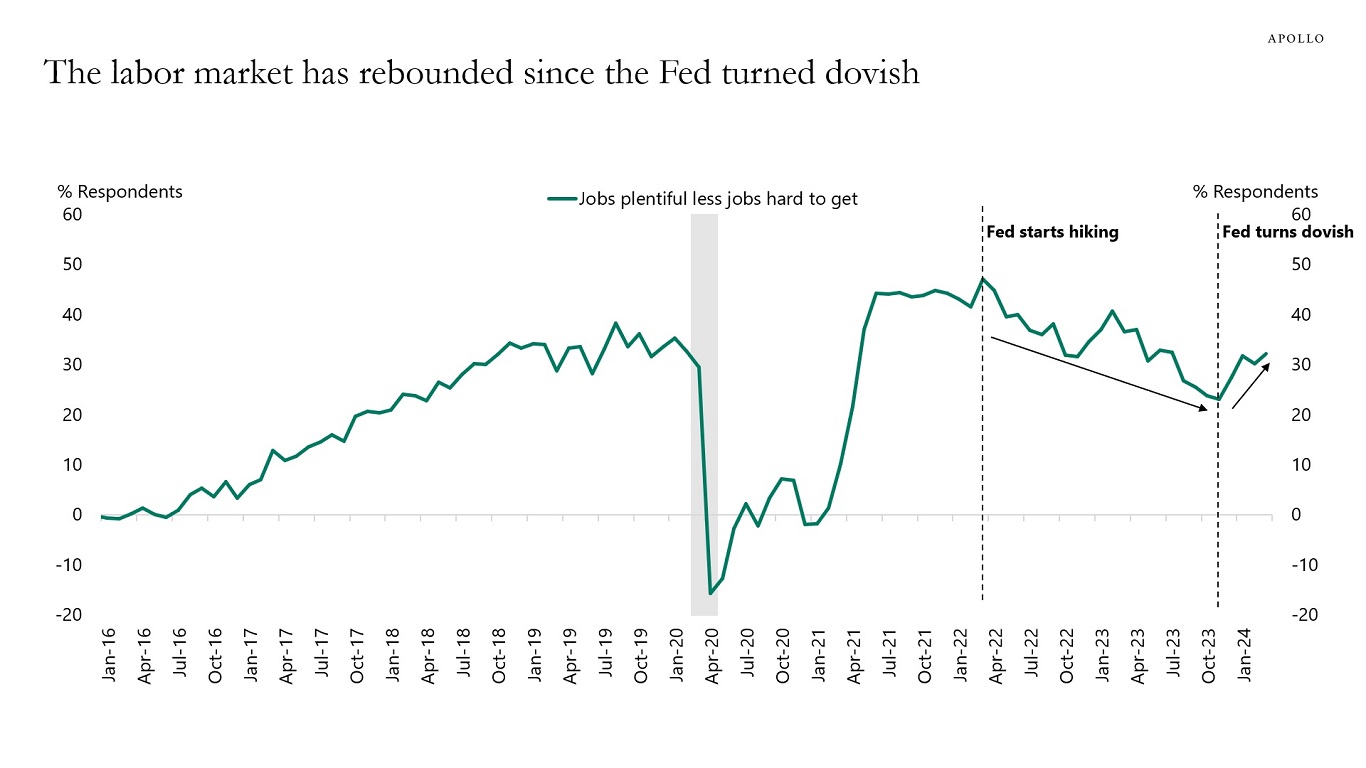
Source: Conference Board, Haver Analytics, Apollo Chief Economist 
Source: National Association for Business Economics, Haver Analytics, Apollo Chief Economist See important disclaimers at the bottom of the page.
-
Cocoa prices have tripled over the past six months, driven by extreme weather in West Africa, crop disease, and associated panic buying, see chart below.
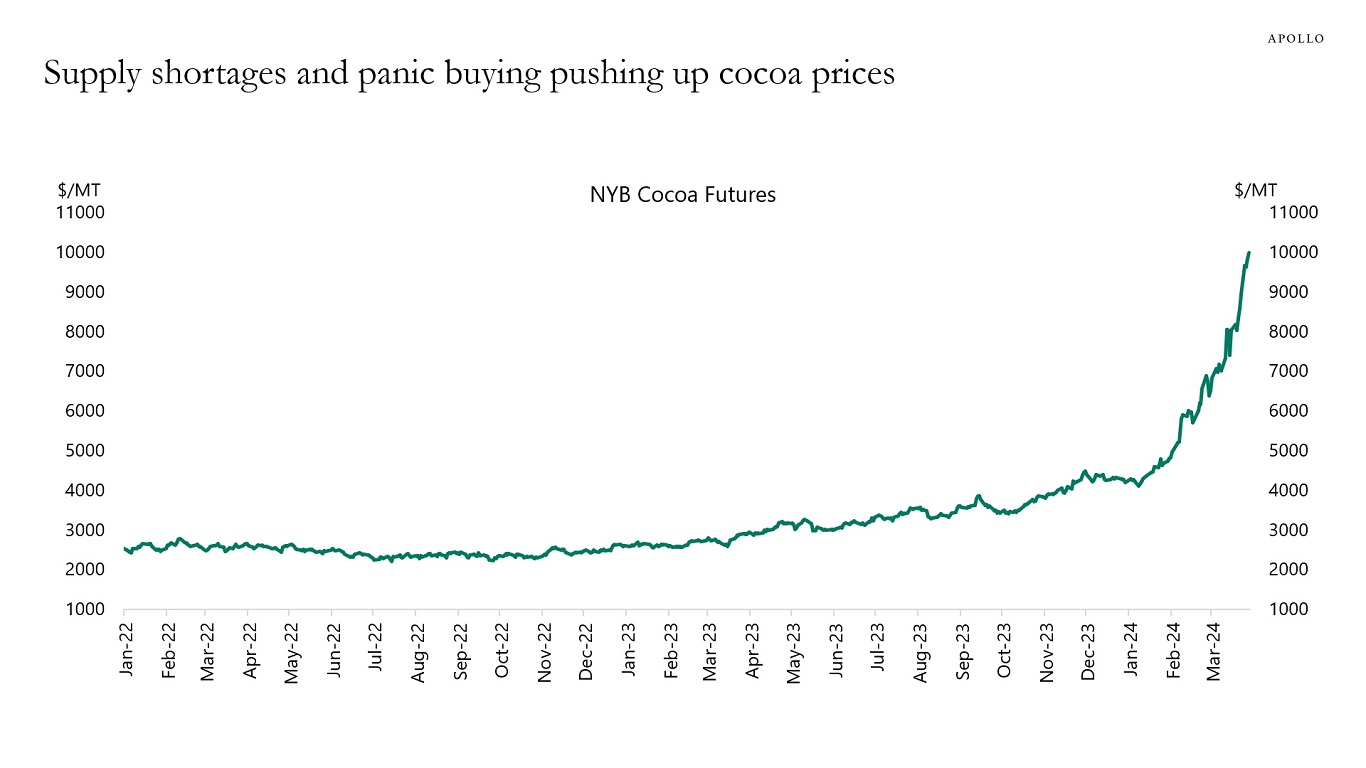
Source: Bloomberg, Apollo Chief Economist See important disclaimers at the bottom of the page.
-
Normally, when a firm goes bankrupt, you imagine a liquidation where all employees are fired and all assets are sold. But this is not what is happening at the moment. A record-high 70% of US bankruptcy filings this year have been reorganizations, see chart below.
High stock prices and tight credit spreads help companies reorganize instead of liquidating. Combined with the wealth effect of easy financial conditions on consumers, it is harder for the Fed to get inflation under control when financial conditions continue to ease. Put differently, easy financial conditions dampen the traditional transmission mechanism of monetary policy.
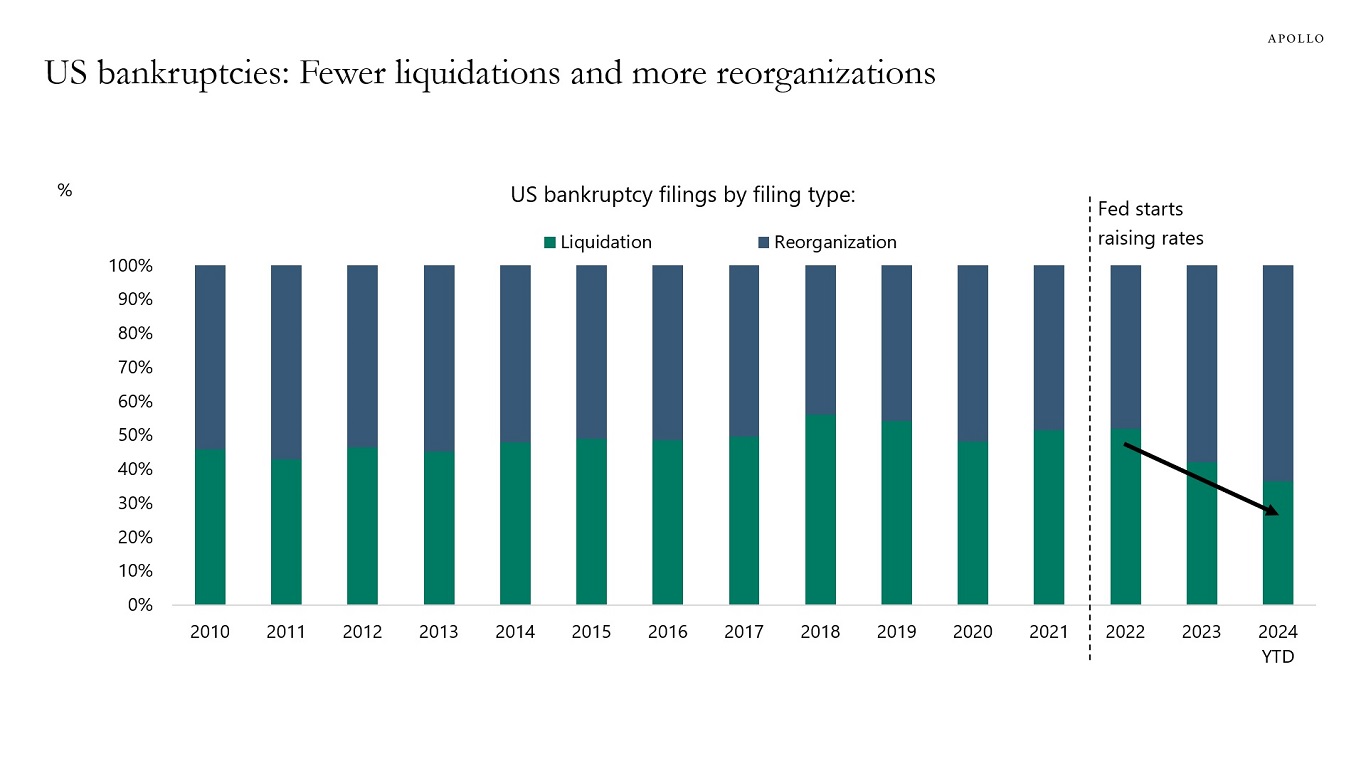
Source: S&P Capital IQ, Apollo Chief Economist. Note: Data till March 14, 2024. Bankruptcy figures include public companies or private companies with public debt with a minimum of $2 million in assets or liabilities at the time of filing, in addition to private companies with at least $10 million in assets or liabilities. Chapter 11 liquidation and Chapter 7 bankruptcy filings are categorized as liquidation and other Chapter 11 bankruptcy filings as reorganization. See important disclaimers at the bottom of the page.

This presentation may not be distributed, transmitted or otherwise communicated to others in whole or in part without the express consent of Apollo Global Management, Inc. (together with its subsidiaries, “Apollo”).
Apollo makes no representation or warranty, expressed or implied, with respect to the accuracy, reasonableness, or completeness of any of the statements made during this presentation, including, but not limited to, statements obtained from third parties. Opinions, estimates and projections constitute the current judgment of the speaker as of the date indicated. They do not necessarily reflect the views and opinions of Apollo and are subject to change at any time without notice. Apollo does not have any responsibility to update this presentation to account for such changes. There can be no assurance that any trends discussed during this presentation will continue.
Statements made throughout this presentation are not intended to provide, and should not be relied upon for, accounting, legal or tax advice and do not constitute an investment recommendation or investment advice. Investors should make an independent investigation of the information discussed during this presentation, including consulting their tax, legal, accounting or other advisors about such information. Apollo does not act for you and is not responsible for providing you with the protections afforded to its clients. This presentation does not constitute an offer to sell, or the solicitation of an offer to buy, any security, product or service, including interest in any investment product or fund or account managed or advised by Apollo.
Certain statements made throughout this presentation may be “forward-looking” in nature. Due to various risks and uncertainties, actual events or results may differ materially from those reflected or contemplated in such forward-looking information. As such, undue reliance should not be placed on such statements. Forward-looking statements may be identified by the use of terminology including, but not limited to, “may”, “will”, “should”, “expect”, “anticipate”, “target”, “project”, “estimate”, “intend”, “continue” or “believe” or the negatives thereof or other variations thereon or comparable terminology.