


When building a strategic private markets allocation, the waiting period can carry a meaningful cost. The question is not only how to access private markets, but how to manage uncalled capital during the ramp-up period.
As investors incorporate private markets allocations in their portfolios, many do so through traditional closed-end drawdown funds. While that structure can offer access to attractive long-term opportunities, it can also introduce an often-overlooked challenge: committed capital is not invested capital.
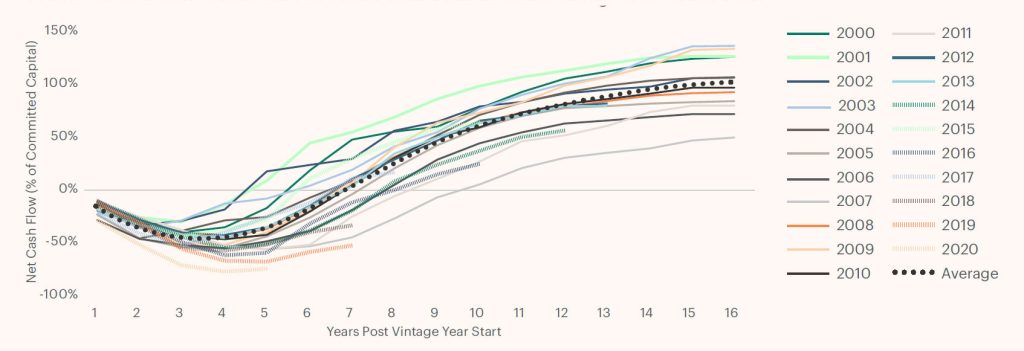
Instead, capital is called when portfolio company investments are made, typically during the early years of a fund’s life, with distributions generally beginning later. The result is the familiar J-curve, highlighted in the chart below. Looking at vintages from 2000 to 2020, on average, buyout private equity funds took four years to reach the “bottom” of the J-curve, at which point the fund is ~50% net called on a cash flow basis (cumulative capital calls minus cumulative distributions). After seven years, these funds have on average turned cash flow positive, though the time horizon has ranged from ~4-10 years.
We view the J-curve as not only a fund-level phenomenon, but a portfolio construction issue.
It Has Taken a Decade for Some Traditional Buyout Funds to Become Cash Flow Positive
J-Curve: Historical Net Cash Flows for Private Equity Buyout Funds Vintage Years 2000-2020
The J-Curve Effect Is a Total Portfolio Problem
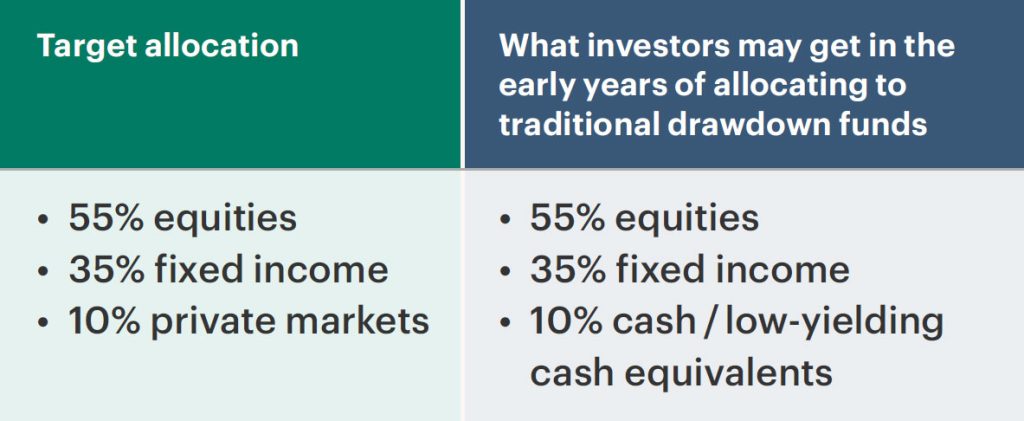
Consider a traditional 60/40 portfolio that seeks to build a 10% allocation to private markets. Using a drawdown model, the portfolio could have very little private market exposure for several years and require multiple vintage year commitments to reach the target allocation.
Different Paths to Building Private Market Allocations
As investors build private markets exposure, they must forecast cash flows and contend with the uncertainty of when and how much capital may get called, in addition to when and how capital may be distributed back. During the holding period, uncalled committed capital can be an important driver of portfolio outcomes.
The table below outlines three different approaches to managing that capital. Some investors may prioritize speed in reaching private markets exposure targets, while others may prioritize potential cumulative portfolio gains relative to a traditional 60/40 baseline.
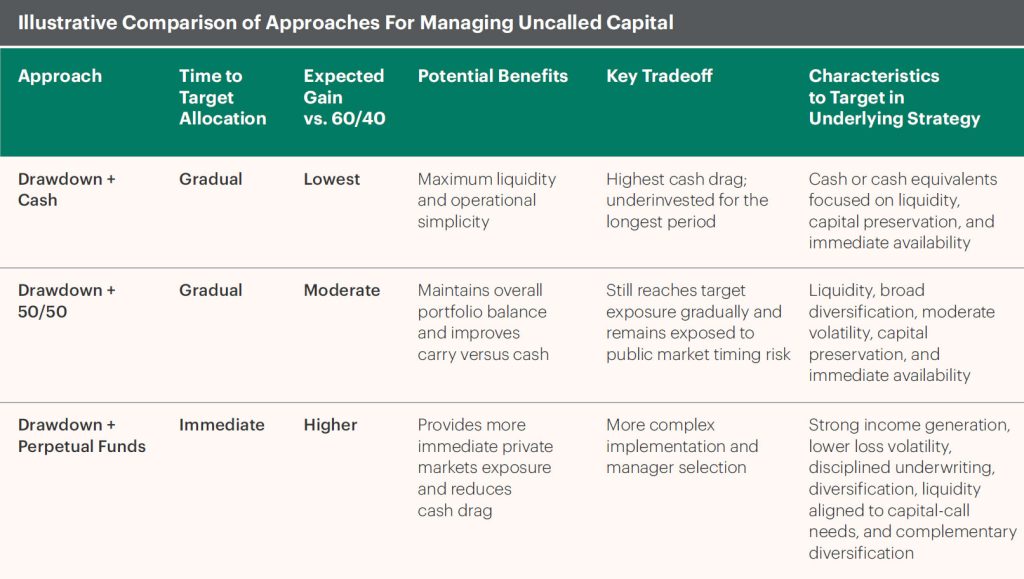
Holding uncalled cash is simple, but costly as it will earn little to no return. A second approach seeks to reduce cash drag without changing the overall portfolio mix: commit to drawdown funds, but keep uncalled capital invested in a balanced 50/50 stock-bond portfolio (reallocating 5% from both equities and fixed income to transition from 60/40 to 55/35/10). In effect, this allows the investor to maintain the broader 60/40 allocation while waiting for private fund capital calls.
This drawdown + 50/50 approach may improve cumulative returns relative to holding uncalled capital in cash, particularly if public markets are performing well. It also avoids a cash drag in the portfolio while the private markets exposure builds. However, it does not solve the core implementation issue: the investor still reaches their target private markets exposure over a longer time period and the capital reserved for future commitments may be susceptible to volatility in public markets. That may create timing risk if capital calls coincide with a drawdown in equities or rate-sensitive fixed income.
In our view, the most efficient way to mitigate the J-curve of drawdown funds is to pair that exposure with perpetual private market funds. Capital can be put to work in private markets sooner, potentially shortening the time needed to reach target allocation and reducing the drag associated with uncalled capital sitting in low-yielding instruments. Relative to a drawdown-only approach, perpetual structures may also smooth the implementation path by replacing a staggered funding schedule with more immediate deployment.
Closing the Gap Between Committed and Invested Capital
Diversification does not ensure a profit and may not protect against a loss in a declining market.
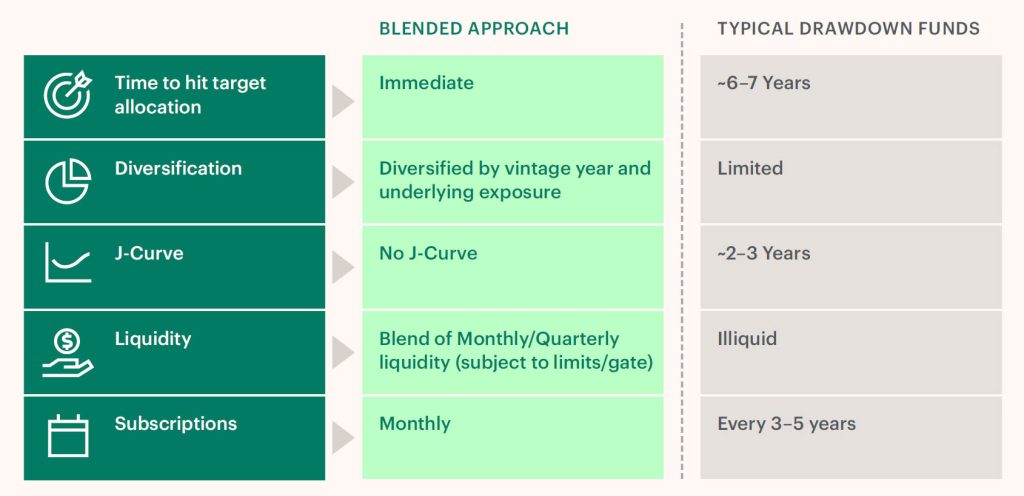
Blending Drawdown and Perpetual Funds
For investors moving beyond the traditional 60/40 portfolio, the challenge is not just deciding to invest in private markets, but how to do so efficiently.
Traditional drawdown funds do not offer immediate private markets exposure, which means a portfolio may remain meaningfully underallocated even after the commitment has been made. A blended approach combining drawdown and perpetual funds can close that gap more efficiently, though the success of this approach depends on the characteristics of the perpetual strategy itself.
In this context, we believe that the most effective perpetual allocations help capital remain productive without becoming a new source of instability within the portfolio. This includes strategies with shorter durations, lower historical volatility, limited correlation to traditional asset classes and a return profile grounded in income generation and contractual cash flows.
Paired with traditional drawdown funds, we believe select perpetual strategies can reduce cash drag, shorten the path to target allocation and align exposures closer to the investor’s intended allocation.
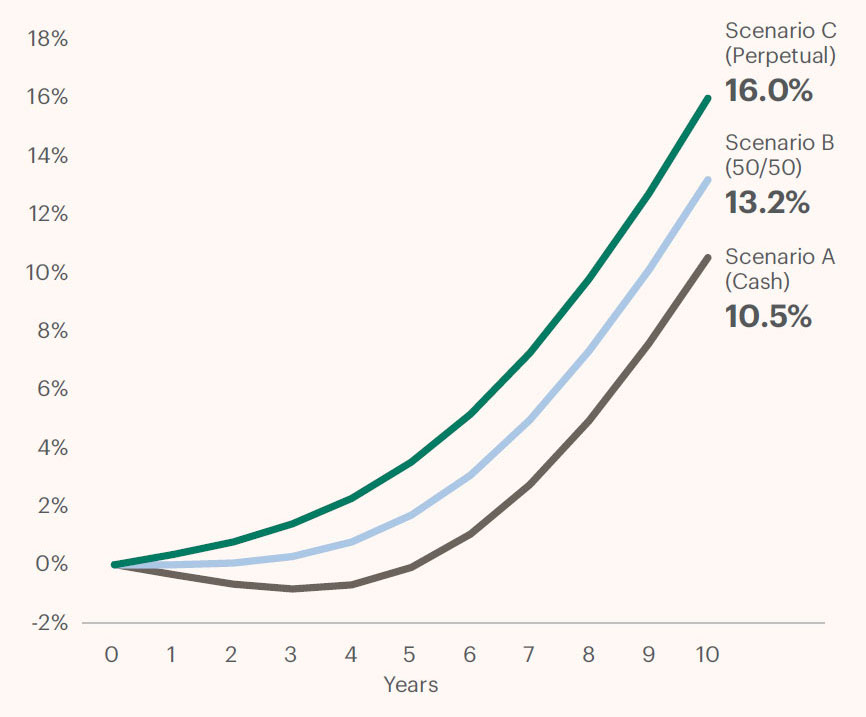
Cumulative Excess Gain Over Starting 60/40
Methodology
Model Overview. The analysis on page 4 presents a hypothetical 10-year portfolio projection comparing three capital deployment strategies (Scenarios A, B and C)against a static 60/40 reference portfolio. All scenarios begin with a $100 starting portfolio and assume a $10 annual commitment to a drawdown fund, deployed over a 16-year J-curve. Results are hypothetical and for illustrative purposes only. They do not represent the performance of any actual fund or account and are not a guarantee of future results.
Capital Market Assumptions. Long-term expected returns used in this model areas follows: Cash – 3.0%; Bonds – 5.0%; Equities – 8.0%; Perpetual (open-end)fund – 10.0%; Drawdown fund (IRR) – approximately 19.0%. These assumptions are forward-looking estimates and are inherently uncertain. Actual returns may differ materially.
Drawdown Fund J-Curve. Capital calls and distributions follow a modeled J-curve pattern over 16 vintage years, calibrated to produce a gross IRR of approximately 19.0% on committed capital. The J-curve is applied consistently across all three scenarios. Uncalled capital is treated as deployed into the designated “waiting” sleeve for each scenario until called.
Scenario Descriptions.
- Scenario A (Cash Sleeve): Uncalled capital is held in cash, earning the modeled cash return of 3.0% per annum. The portfolio is rebalanced annually to a target allocation of 55% equities / 35% bonds / 10% drawdown (inclusive of the cash sleeve and invested NAV).
- Scenario B (50/50 Sleeve): Uncalled capital is invested in a 50/50 blend of equities and bonds (earning the blended return of the target equity and bond weights) until called. The same 55/35/10 annual rebalancing framework applies.
- Scenario C (Perpetual Sleeve): Uncalled capital is invested in a perpetual (open-end) fund earning the modeled 10.0% return until called. The same 55/35/10 annual rebalancing framework applies.
Reference Portfolio. The 60/40 reference portfolio holds 60% equities and 40% bonds at all times with no drawdown allocation, producing a constant annual return of 6.8% under the stated assumptions.
Rebalancing. All three scenarios are assumed to rebalance annually to their respective target allocations. No transaction costs, taxes, or implementation frictions are reflected in the model.
Performance Metrics. Year 10 NAV, 10-year cumulative return, and 10-year annualized return are calculated on a pre-tax, pre-fee basis unless otherwise noted. “Cash drag” is measured as the difference in Year 10 NAV and annualized return between each scenario and Scenario C (Perpetual), which serves as the upper-bound comparator.
The information contained in this material is provided for informational purposes only and should not be construed as financial or investment advice, nor should any information in this material be relied on when making an investment decision. Certain information reflects the views and opinions of Apollo Analysts. Subject to change at any time without notice. Please see the end of this document for important disclosure information.
Important Disclosure Information
All information contained in this material is as of May 2026 unless otherwise indicated.
This material is for informational purposes only and should not be treated as research. This material should not be copied, distributed, published, or reproduced, in whole or in part, or disclosed by any recipient to any other person without the express written consent of Apollo Global Management, Inc. (together with its subsidiaries, “Apollo”).
The views and opinions expressed in this material are the views and opinions of Apollo Analysts. They may not reflect the views and opinions of Apollo and are subject to change at any time without notice. Further, Apollo and its affiliates may have positions (long or short) or engage in securities transactions that are not consistent with the information and views expressed in this material. There can be no assurance that an investment strategy will be successful. This material does not constitute an offer of any service or product of Apollo. It is not an invitation by or on behalf of Apollo to any person to buy or sell any security or to adopt any investment strategy, and shall not form the basis of, nor may it accompany nor form part of, any right or contract to buy or sell any security or to adopt any investment strategy. Nothing in this material should be taken as investment advice or a recommendation to enter into any transaction.
Hyperlinks to third-party websites in this material are provided for reader convenience only. There can be no assurances that any of the trends described in this material will continue or will not reverse. Past events and trends do not imply, predict or guarantee, and are not necessarily indicative of future events or results. Unless otherwise noted, information included in this material is presented as of the dates indicated. This material is not complete and the information contained in this material may change at any time without notice. Apollo does not have any responsibility to update the material to account for such changes. Apollo has not made any representation or warranty, expressed or implied, with respect to fairness, correctness, accuracy, reasonableness, or completeness of any of the information contained in this material (including but not limited to information obtained from third parties unrelated to Apollo), and expressly disclaims any responsibility or liability thereof. The information contained in this material is not intended to provide, and should not be relied upon for, accounting, legal or tax advice or investment recommendations. Investors should make an independent investigation of the information contained in this material, including consulting their tax, legal, accounting or other advisors about such information. Apollo does not act for you and is not responsible for providing you with the protections afforded to its clients.
Certain information contained in this material may be “forward-looking” in nature. Due to various risks and uncertainties, actual events or results may differ materially from those reflected or contemplated in such forward-looking information. As such, undue reliance should not be placed on such information. Forward-looking statements may be identified by the use of terminology including, but not limited to, “may”, “will”, “should”, “expect”, “anticipate”, “target”, “project”, “estimate”, “intend”, “continue” or “believe” or the negatives thereof or other variations thereon or comparable terminology.
The Standard & Poor’s 500 Index (S&P 500) is a market-capitalization weighted index of the 500 largest US publicly traded companies and one of the most common benchmarks for the broader US equity markets. Index performance and yield data are shown for illustrative purposes only and have limitations when used for comparison or for other purposes due to, among other matters, volatility, credit or other factors (such as number of investments, recycling or reinvestment of distributions, and types of assets). It may not be possible to directly invest in one or more of these indices and the holdings of any strategy may differ markedly from the holdings of any such index in terms of levels of diversification, types of securities or assets represented and other significant factors. Indices are unmanaged, do not charge any fees or expenses, assume reinvestment of income and do not employ special investment techniques such as leveraging or short selling. No such index is indicative of the future results of any strategy or fund.
Investing involves risk including loss of principal. Alternative investments often are speculative, typically have higher fees than traditional investments often include a high degree of risk and are appropriate only for eligible long-term investors who are willing to forgo liquidity and put capital at risk for an indefinite period of time. They may be highly illiquid and can engage in leverage and other speculative practices that may increase volatility and risk of loss.
References to downside protection are not guarantees against loss of investment capital or value.
This material may reference trade names, trademarks, or service marks of companies that are not owned by Apollo or Apollo funds, or that may be held as investments by Apollo or one or more Apollo funds. The use or display of these companies’ trade names, trademarks, or service marks is not intended to imply any relationship with, or endorsement or sponsorship of Apollo, by such companies. All company names and logos are trademarks of their respective holders.
Past performance is not necessarily indicative of future results.
Additional information may be available upon request
© 2026 Apollo Global Management, Inc. All Rights Reserved.