


Want it delivered daily to your inbox?
-
The gap between Fed pricing and long rates continues to widen, suggesting that factors other than Fed expectations, likely including the fiscal outlook, are beginning to play a role for long rates, see chart below. For more discussion, see also here.
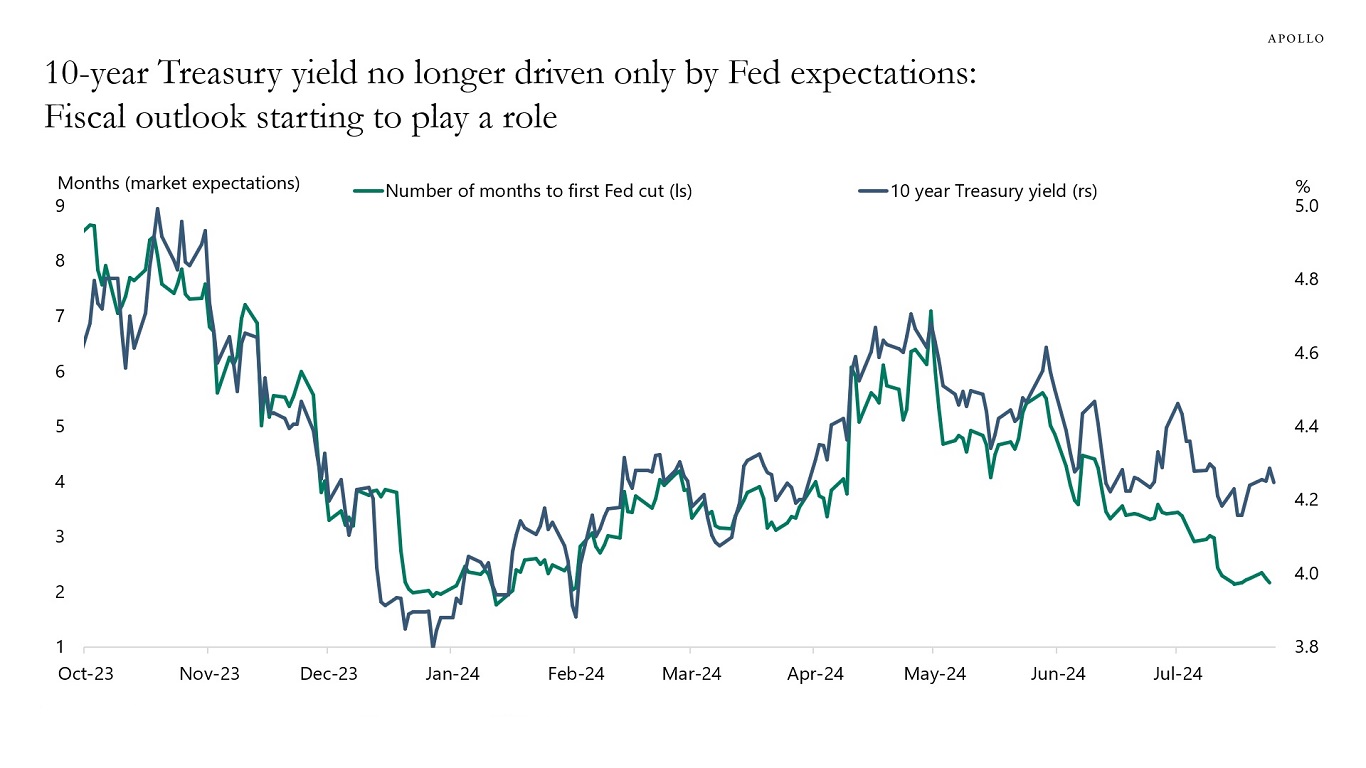
Source: Bloomberg, Apollo Chief Economist. Note: The indices used from Bloomberg are MSM1UT Index and GT10 Govt. See important disclaimers at the bottom of the page.
-
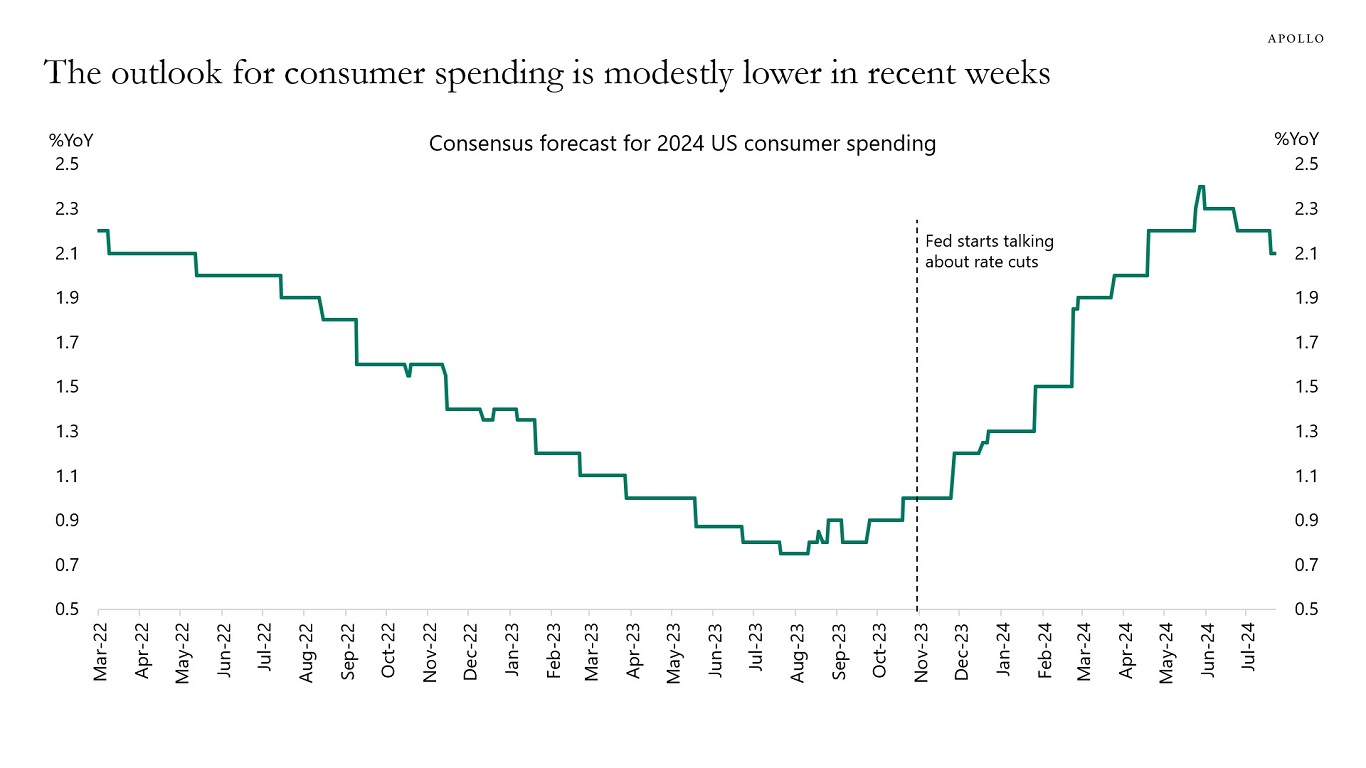
The consensus has in recent weeks lowered the outlook for consumer spending modestly, see chart below.
If the economy starts slowing down, the speed of the slowdown becomes essential. A faster slowdown would have negative implications for earnings and increase the probability of a sell-off in stock markets and credit markets.
The bottom line is that the incoming data points to solid growth. However, the consensus has recently been revising the estimate for consumer spending growth, and we are carefully watching the incoming data to see if this is just a small adjustment or the beginning of a more meaningful slowdown.
Source: Bloomberg, Apollo Chief Economist See important disclaimers at the bottom of the page.
-
During recessions, Treasury issuance shifts to T-bills, partly because during recessions, short rates are low and T-bills are a cheap source of financing, see chart below. So why is T-bill issuance so high today when the fed funds rate is high and the yield curve is inverted?
And what will issuance look like if the economy is slowing down and we enter a recession later this year? If the Fed starts cutting in September and issuance shifts to coupons, it will likely lead to a steeper curve.

Source: Haver Analytics, Apollo Chief Economist See important disclaimers at the bottom of the page.
-
Let’s assume that the economy is finally slowing down.
If it took the Fed two years to slow the economy down, then once the Fed starts cutting rates, it will take two years for the economy to reaccelerate. As a result, cutting rates in September will not be enough to prevent a recession.
In other words, with the consensus expecting a soft landing, the key question in markets today is why the transmission mechanism of monetary policy should be asymmetric when the Fed is cutting rates versus raising rates.
If the long and variable lags are symmetric, it should take two years before the economy accelerates from when the Fed starts cutting in September 2024.
The consensus sees a 30% probability of a recession within the next 12 months, see chart below. The consensus likely thinks that the lagged effects of Fed hikes will eventually slow down the economy.
To be sure, we do not expect a recession, see also here. But this is what the Fed’s symmetric logic about long and variable lags would imply.

Source: Bloomberg, Apollo Chief Economist See important disclaimers at the bottom of the page.
-
Small-cap companies have a higher share of floating rate debt, see the first chart. Specifically, floating rate debt as a share of total outstanding debt for the Russell 2000 is 51%. For the S&P 500, the share is 25%.
Put differently, small-cap companies are more vulnerable to Fed hikes and rates staying higher for longer.
Even after the Fed turned dovish in December 2023 and rates started coming down and credit spreads started tightening, small-cap earnings have shown no signs of a rebound, see the second chart.
This confirms the extreme concentration in the stock market. Small-cap earnings expectations remain weak even in a strong economy with yield levels coming down. The likely reason is that 41% of companies in the Russell 2000 have negative earnings, i.e., very poor credit fundamentals, see the third chart.
If we get a soft landing with inflation coming down and the Fed cutting rates, then earnings expectations should begin to rise for both small-cap and large-cap stocks. But this is not what we are seeing.
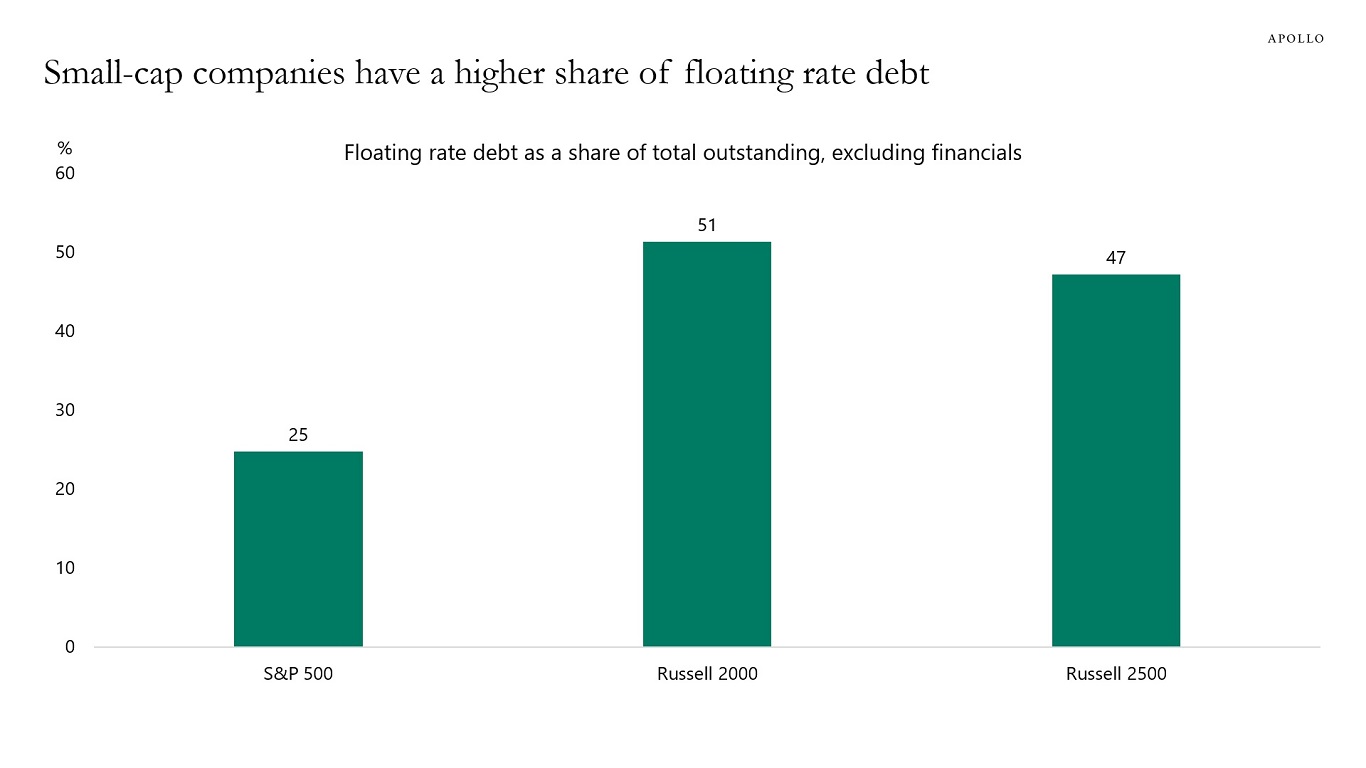
Source: Bloomberg, Apollo Chief Economist. Note: Data as of July 2024, using SRCH function on Bloomberg and includes corporate bonds and loan (tranches) and excludes financials. 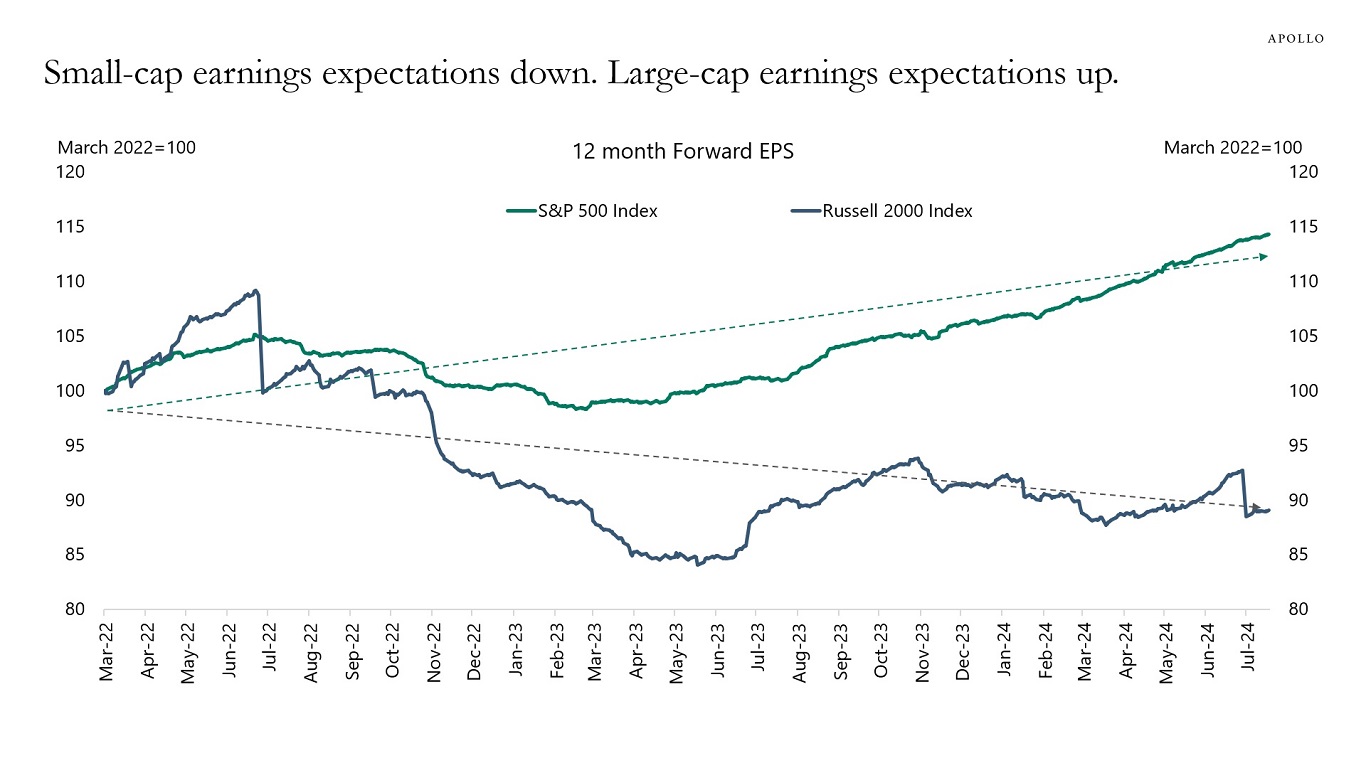
Source: Bloomberg, Apollo Chief Economist 
Source: Bloomberg, Apollo Chief Economist See important disclaimers at the bottom of the page.
-
There is extreme disagreement among households about the long-term inflation outlook and whether the Fed will keep inflation under control over the coming 5 to 10 years, see chart below and here.
The University of Michigan investigated the source and found that one reason was that they had switched their survey methodology from phone interviews to web interviews. Survey respondents are more willing to express high inflation expectations during web interviews than during phone interviews. The problem with this argument is that you would think that the same bias would also be present for households with lower inflation expectations. Despite this methodological difference, the bottom line remains that half of the population has extreme long-term inflation expectations, which is a problem for the Fed and its credibility.
For more, see https://data.sca.isr.umich.edu/fetchdoc.php?docid=6082.

Source: University of Michigan, Haver Analytics, Apollo Chief Economist See important disclaimers at the bottom of the page.
-
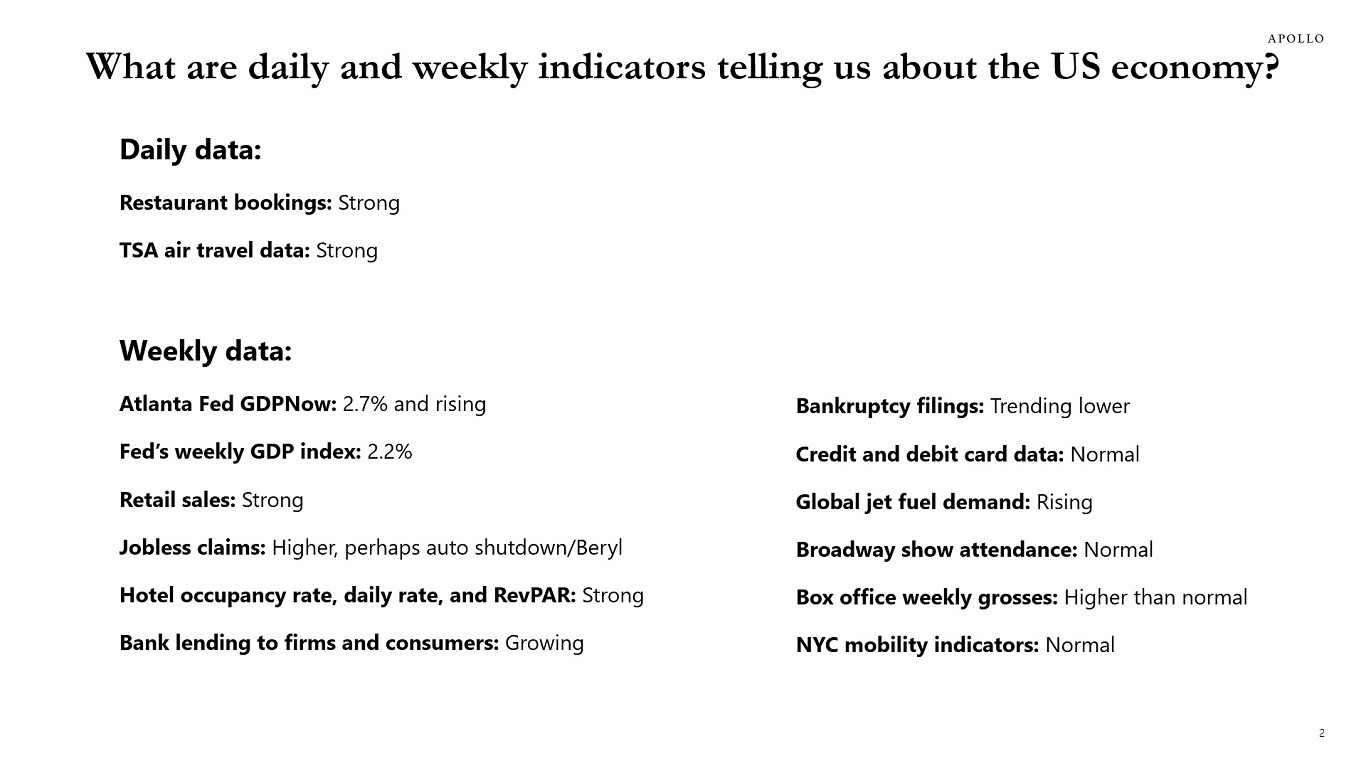
Every Saturday going forward, we will provide an updated chart book with daily and weekly indicators for the US economy.
Current status as of Saturday, July 20:
• Daily data shows restaurant bookings remain strong.
• Daily data shows TSA air travel remains strong.
• The Fed’s weekly GDP estimate is 2.2%.
• Atlanta Fed GDPNow is 2.7% and rising.
• Weekly same-store retail sales are strong.
• Jobless claims are modestly higher, perhaps because of auto plant shutdowns and Hurricane Beryl.
• Weekly data for hotel occupancy rates are strong, daily rates are strong, and RevPAR is strong.
• Weekly data for bank lending to consumers and firms show loan growth is accelerating.
• Weekly data for bankruptcy filings are trending down.
• Weekly credit and debit card data show rising loan growth.
• Weekly data for global jet fuel demand is rising.
• Weekly data for Broadway show attendance is normal.
• Weekly data for box office grosses is higher than normal.
• Weekly data shows NYC mobility indicators are normal.
The bottom line is that daily and weekly data do not show any signs of a drop-off in economic activity. Instead, the data shows ongoing steady growth around potential, similar to what we have seen over the past year. If the Fed starts cutting rates in September, then stock prices will rise further, credit spreads will tighten, and growth and inflation will start to reaccelerate.
Some sentiment indicators are weaker, including consumer confidence and long-term inflation expectations, but the list above is all hard data that feeds directly into GDP, employment, and inflation.
Let us know if there is any daily or weekly data that you think we are missing, and we will add it to the chart books.
Note: Data as of Saturday, July 20, 2024. Source: Apollo Chief Economist See important disclaimers at the bottom of the page.
-
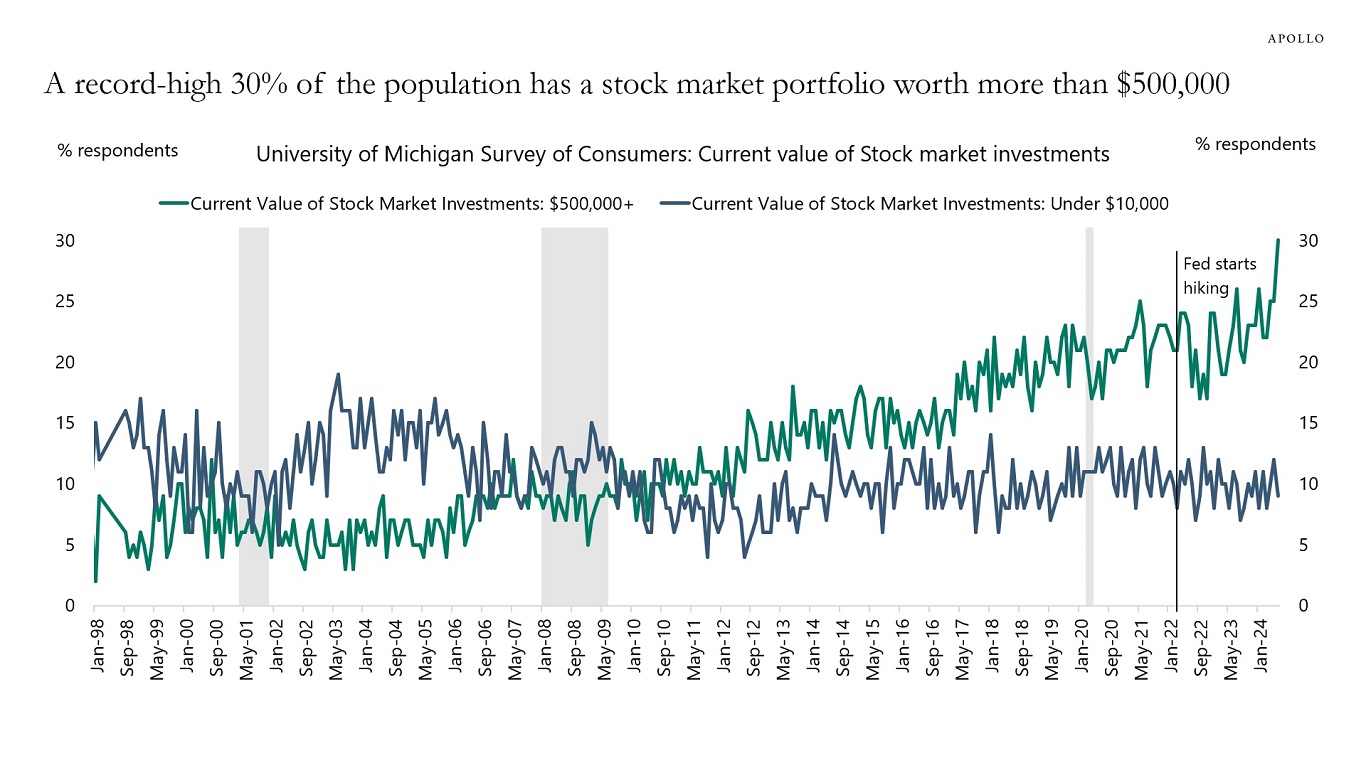
The University of Michigan Survey of Consumer Sentiment shows that a record-high 30% of the population has stocks worth more than $500,000, and 37% own a home worth more than $500,000, see charts below.
It is remarkable that these wealth gains for the household sector have taken place while the Fed was raising interest rates.
The bottom line is that the tailwind to consumer spending for homeowners and equity owners is significant, in particular when combined with record-high cash flows from fixed income.
Source: University of Michigan, Haver Analytics, Apollo Chief Economist 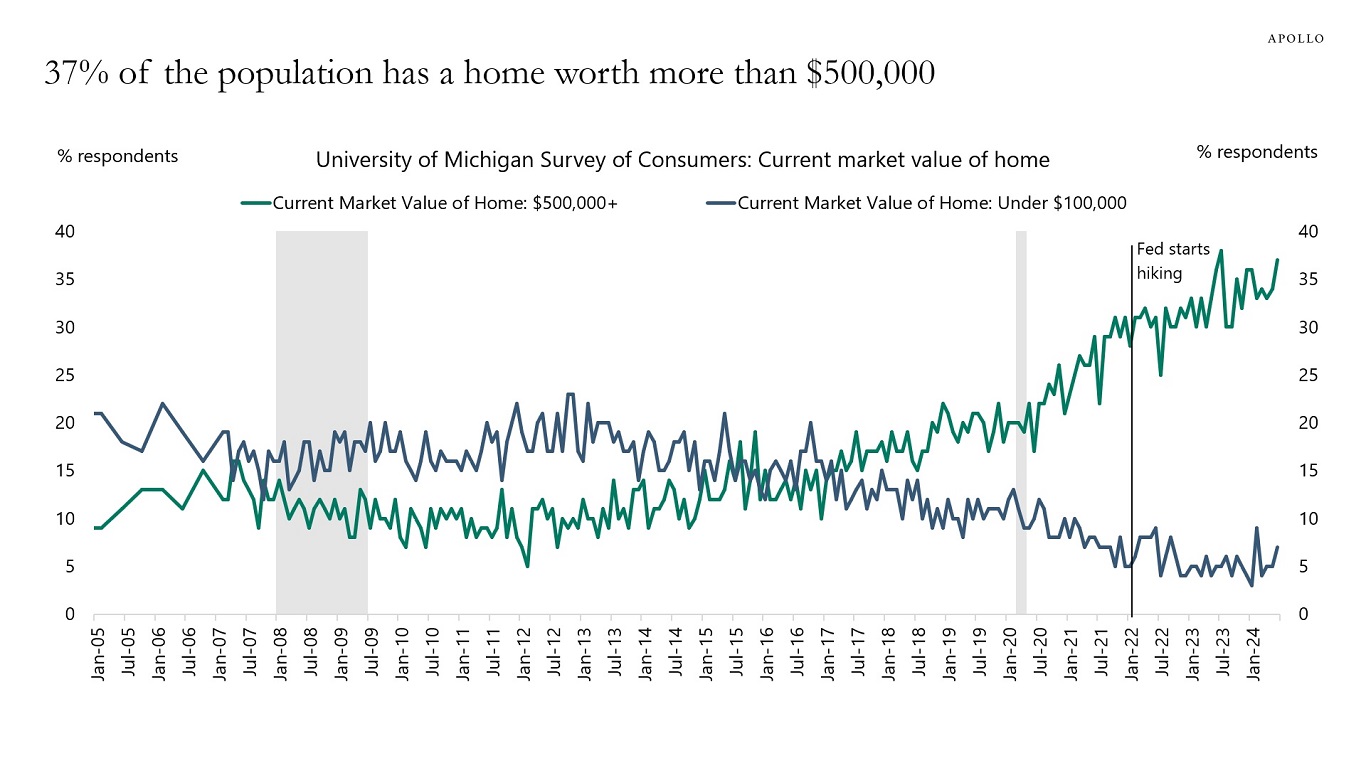
Source: University of Michigan, Haver Analytics, Apollo Chief Economist See important disclaimers at the bottom of the page.
-
The market is making the same mistake it made in January when it priced in six cuts. Looking at the ongoing uptrend in CEO confidence, there is no reason for the Fed to cut interest rates anytime soon, see chart below.
In fact, it is not the incoming data that is the reason to begin cutting interest rates soon. It is the Fed’s model, which says that interest rates in the long run should be much lower than the fed funds rate today.
In other words, the Fed has moved from being data dependent to being r-star dependent.
Not even CPI inflation at 3.0% argues for the Fed to cut interest rates soon, particularly not in a situation where the stock market is reaching new all-time highs every day, and CEOs are becoming increasingly optimistic about the outlook.
And, as previously discussed, the Fed’s insistence on the next move being a cut makes it more difficult to actually cut rates. That is because signals to the market about coming Fed cuts push stock prices higher and tighten credit spreads, which in turn puts more upward pressure on growth and inflation.
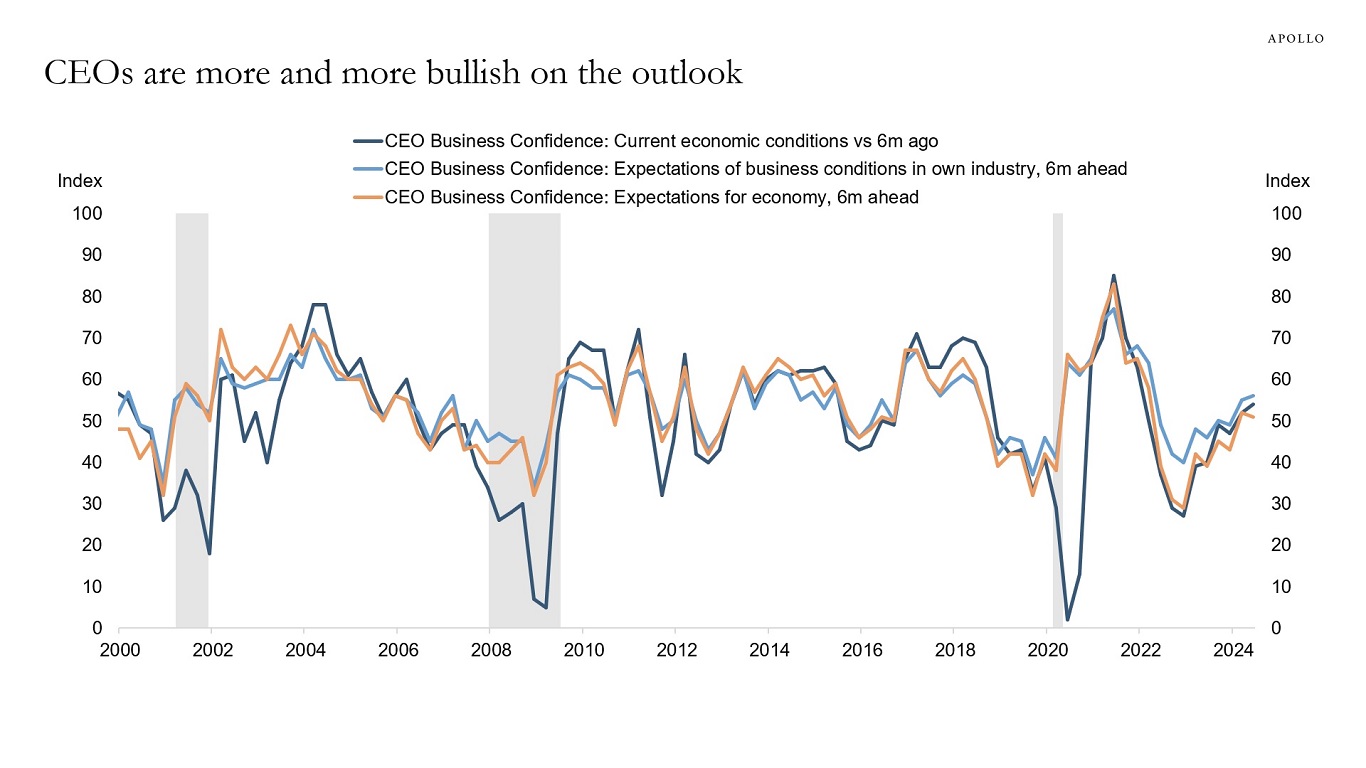
Source: Conference Board, Haver Analytics, Apollo Chief Economist See important disclaimers at the bottom of the page.
-
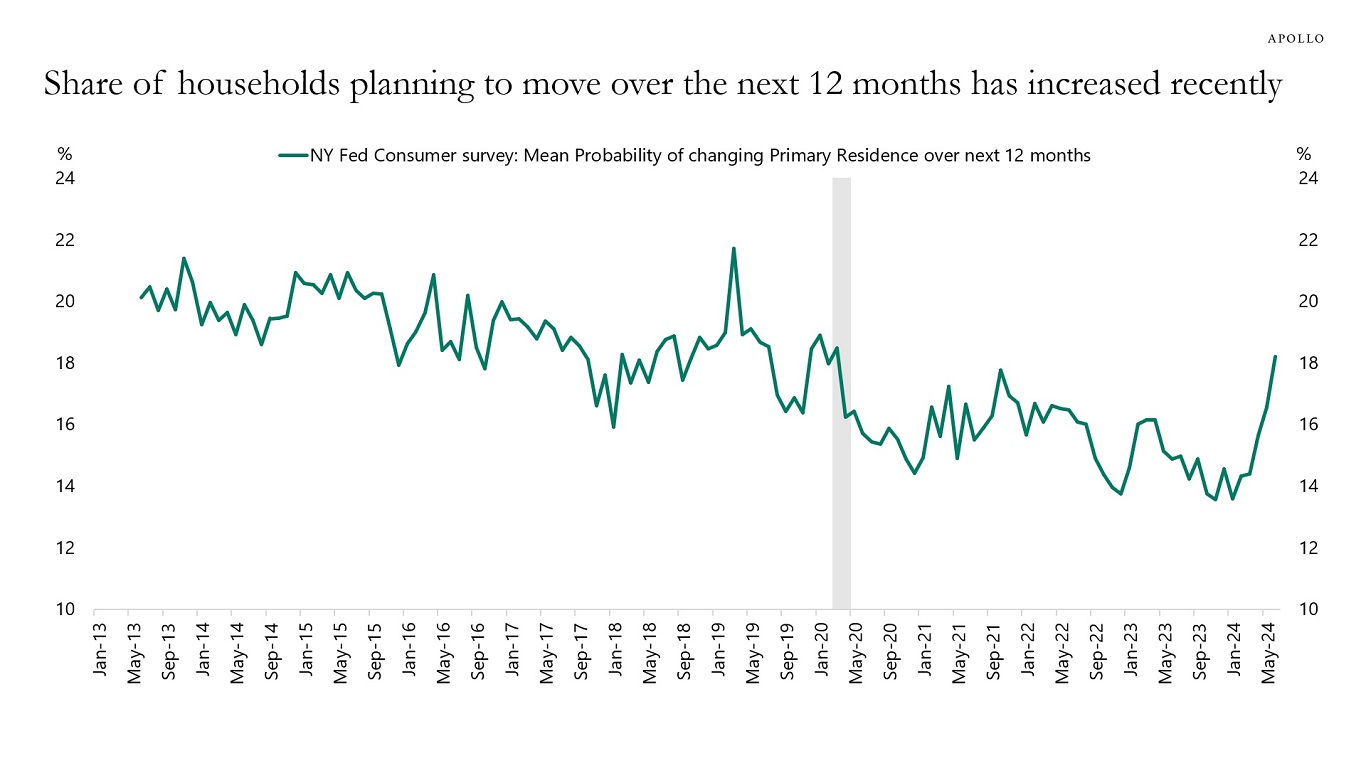
The housing recovery continues, driven by a low supply of homes for sale.
Demand for housing is more complicated. High mortgage rates, high home prices, rising unemployment, and high construction costs are downside risks. Upside risks to demand are strong wage growth, strong income growth, high stock prices, and high cash flows for owners of fixed-income assets. The Fed cutting rates will also help housing.
With low supply and both upside and downside risks to demand, the housing recovery continues.
Our updated housing chart book is available here.

Source: FRB of NY, Haver Analytics, Apollo Chief Economist 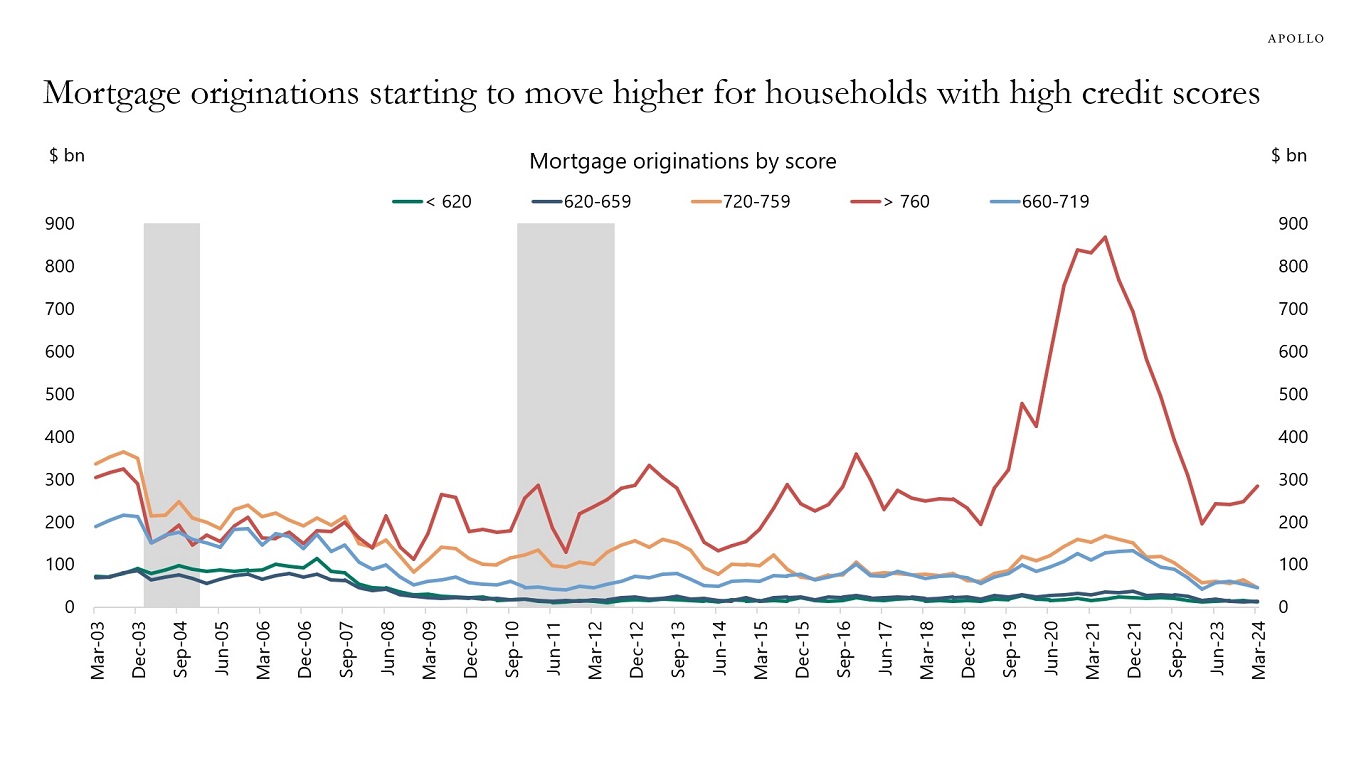
Source: NY Fed, Bloomberg, Apollo Chief Economist 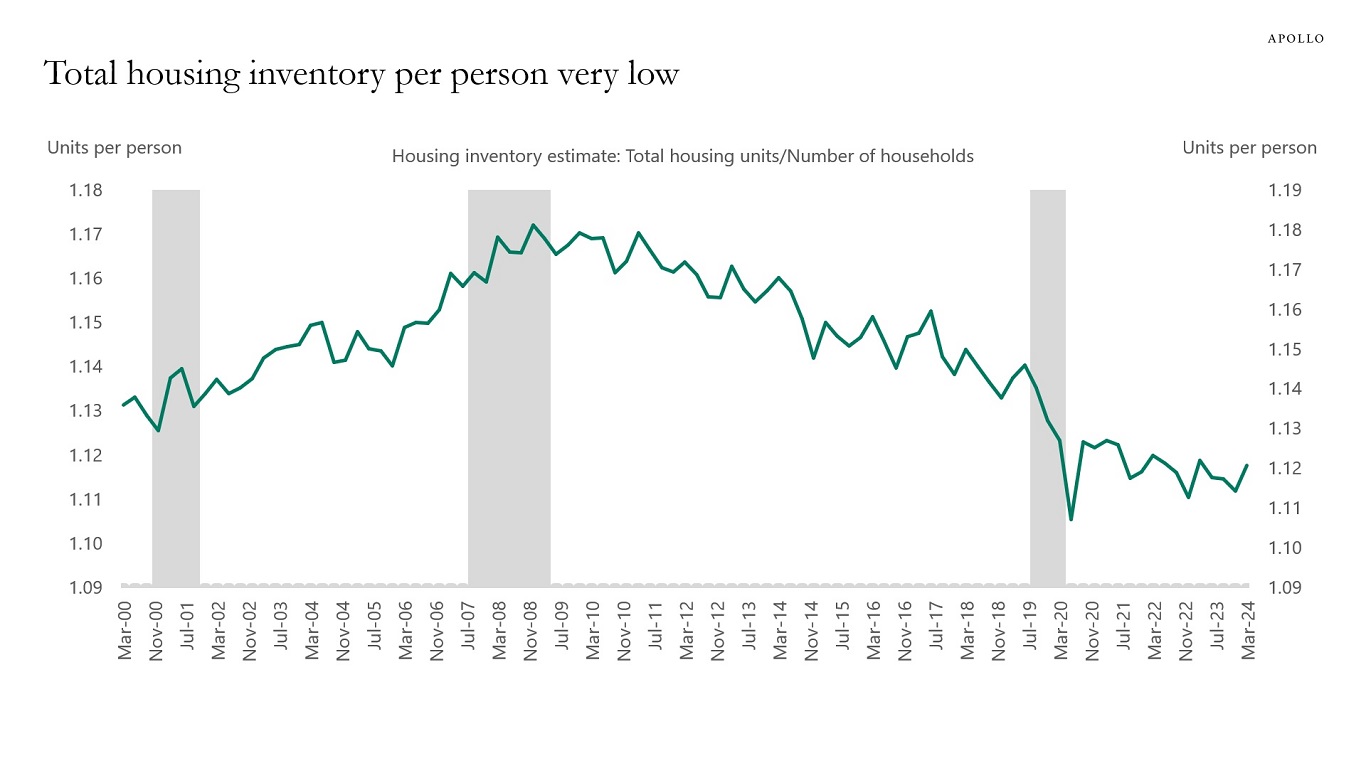
Source: Census Bureau, FRED, Apollo Chief Economist 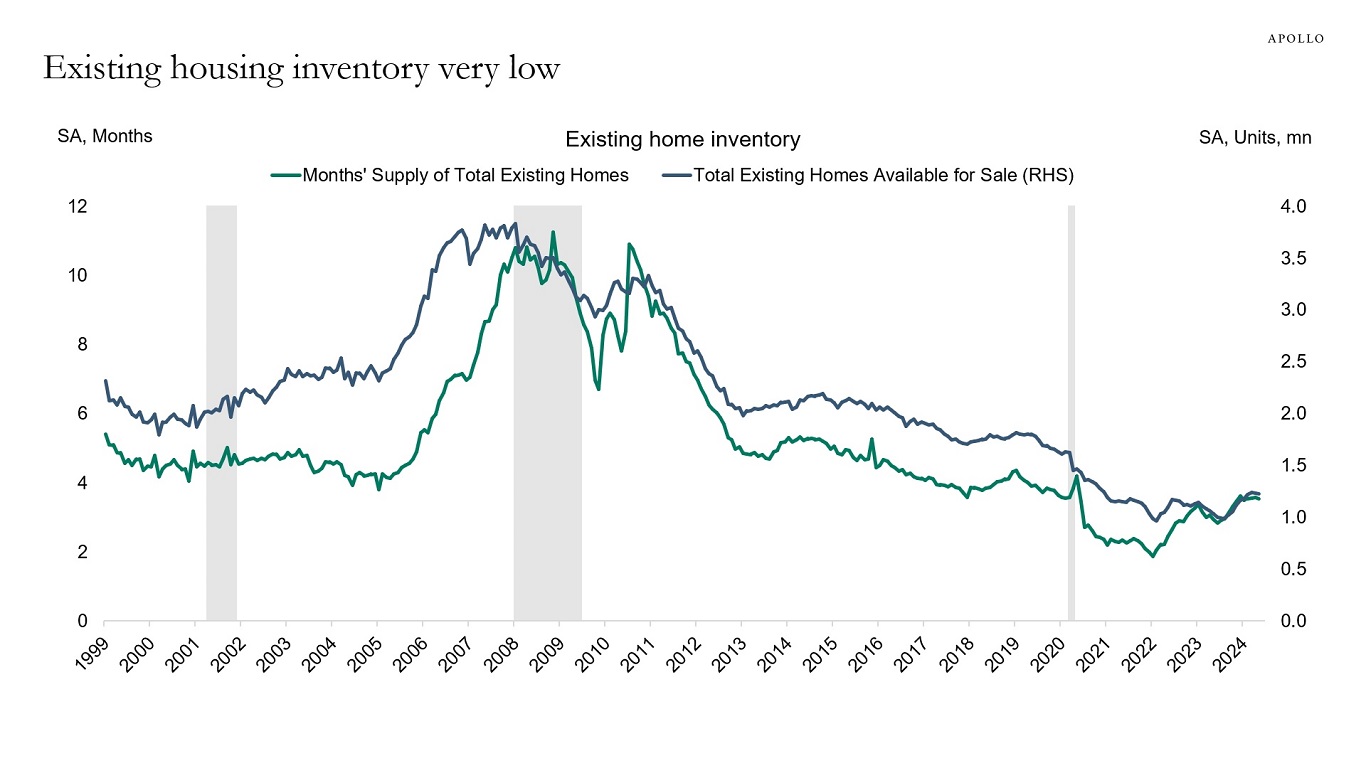
Source: NAR, Apollo Chief Economist 
Source: Census Bureau, Haver Analytics, Apollo Chief Economist See important disclaimers at the bottom of the page.

This presentation may not be distributed, transmitted or otherwise communicated to others in whole or in part without the express consent of Apollo Global Management, Inc. (together with its subsidiaries, “Apollo”).
Apollo makes no representation or warranty, expressed or implied, with respect to the accuracy, reasonableness, or completeness of any of the statements made during this presentation, including, but not limited to, statements obtained from third parties. Opinions, estimates and projections constitute the current judgment of the speaker as of the date indicated. They do not necessarily reflect the views and opinions of Apollo and are subject to change at any time without notice. Apollo does not have any responsibility to update this presentation to account for such changes. There can be no assurance that any trends discussed during this presentation will continue.
Statements made throughout this presentation are not intended to provide, and should not be relied upon for, accounting, legal or tax advice and do not constitute an investment recommendation or investment advice. Investors should make an independent investigation of the information discussed during this presentation, including consulting their tax, legal, accounting or other advisors about such information. Apollo does not act for you and is not responsible for providing you with the protections afforded to its clients. This presentation does not constitute an offer to sell, or the solicitation of an offer to buy, any security, product or service, including interest in any investment product or fund or account managed or advised by Apollo.
Certain statements made throughout this presentation may be “forward-looking” in nature. Due to various risks and uncertainties, actual events or results may differ materially from those reflected or contemplated in such forward-looking information. As such, undue reliance should not be placed on such statements. Forward-looking statements may be identified by the use of terminology including, but not limited to, “may”, “will”, “should”, “expect”, “anticipate”, “target”, “project”, “estimate”, “intend”, “continue” or “believe” or the negatives thereof or other variations thereon or comparable terminology.