


Want it delivered daily to your inbox?
-
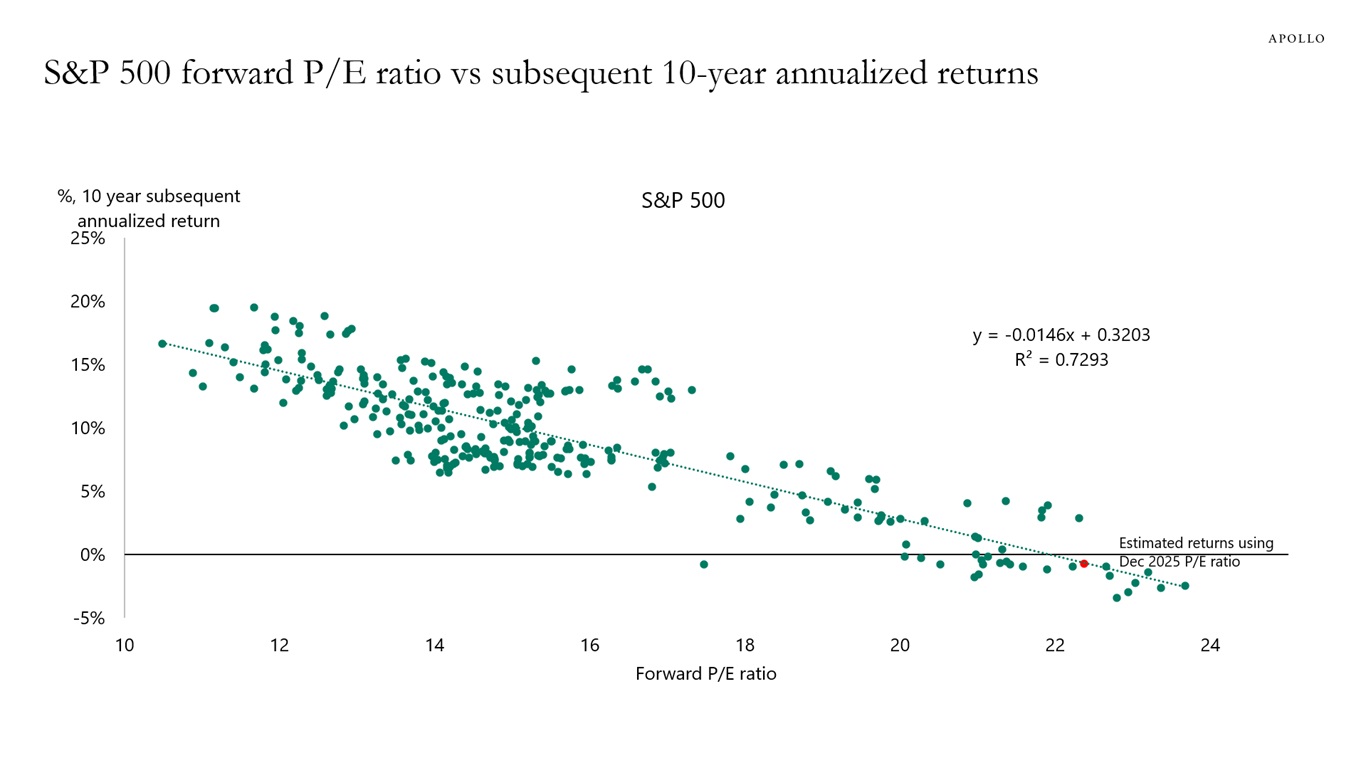
The historical relationship between the S&P 500 forward P/E ratio and subsequent 10-year annualized returns shows that investors should expect to get zero in return in the S&P 500 over the coming decade, see chart below.
Sources: Bloomberg, Apollo Chief Economist Register here to watch our 2026 Outlook class on Apollo Academy on Tuesday, December 16, 2025 at 11:00 AM ET — eligible for 1 CE credit. In addition to the macro outlook, you’ll also hear asset class perspectives from David Sambur (Private Equity), John Cortese (Credit), Olivia Wassenaar (Infrastructure) and Scott Weiner (Real Estate).
See important disclaimers at the bottom of the page.
-
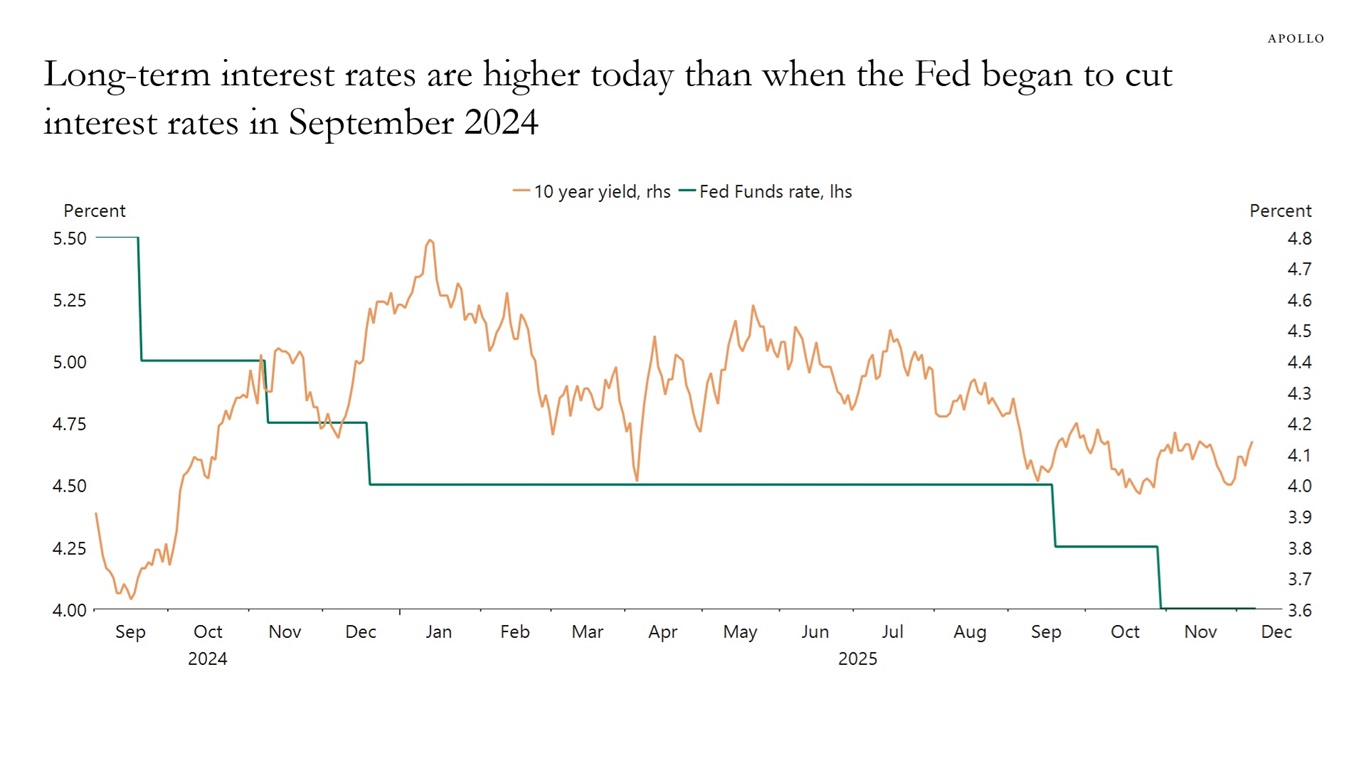
Why are long-term interest rates going up when the Fed is cutting rates, see the first chart? Is the market worried about growing Treasury issuance, or about a new Fed leadership effectively raising the inflation target from 2% to, say, 4%?
The reality is that about a year ago, long-term interest rates started drifting higher than what would have been predicted by short-term interest rates and oil prices, see the second and third charts.
This pattern of rising long-term interest rates is highly unusual when we look at the historical reaction during Fed cutting cycles, see the fourth chart.
The bottom line is that the yield curve continues to steepen, and investors across all asset classes need to think about why, see the fifth chart.
Sources: Federal Reserve, US Department of Treasury, Macrobond, Apollo Chief Economist 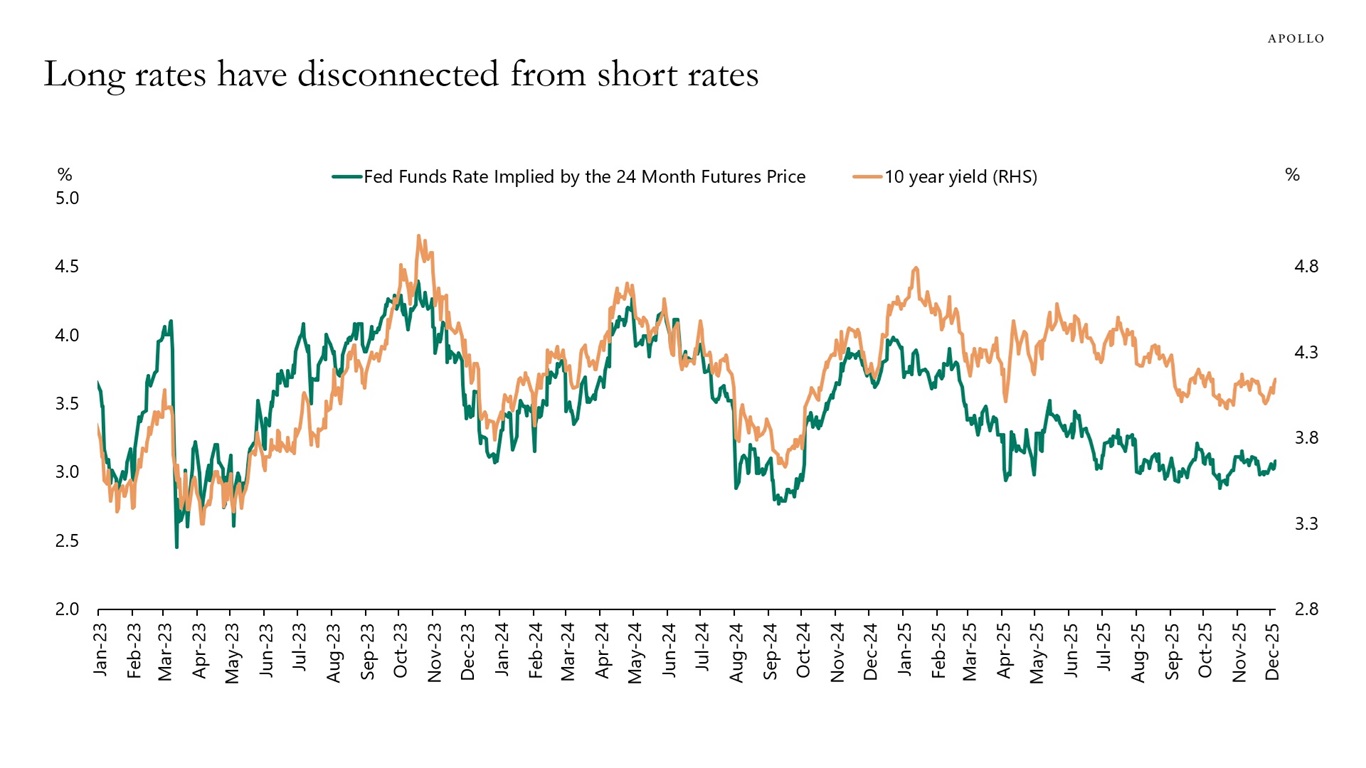
Sources: Haver Analytics, Apollo Chief Economist 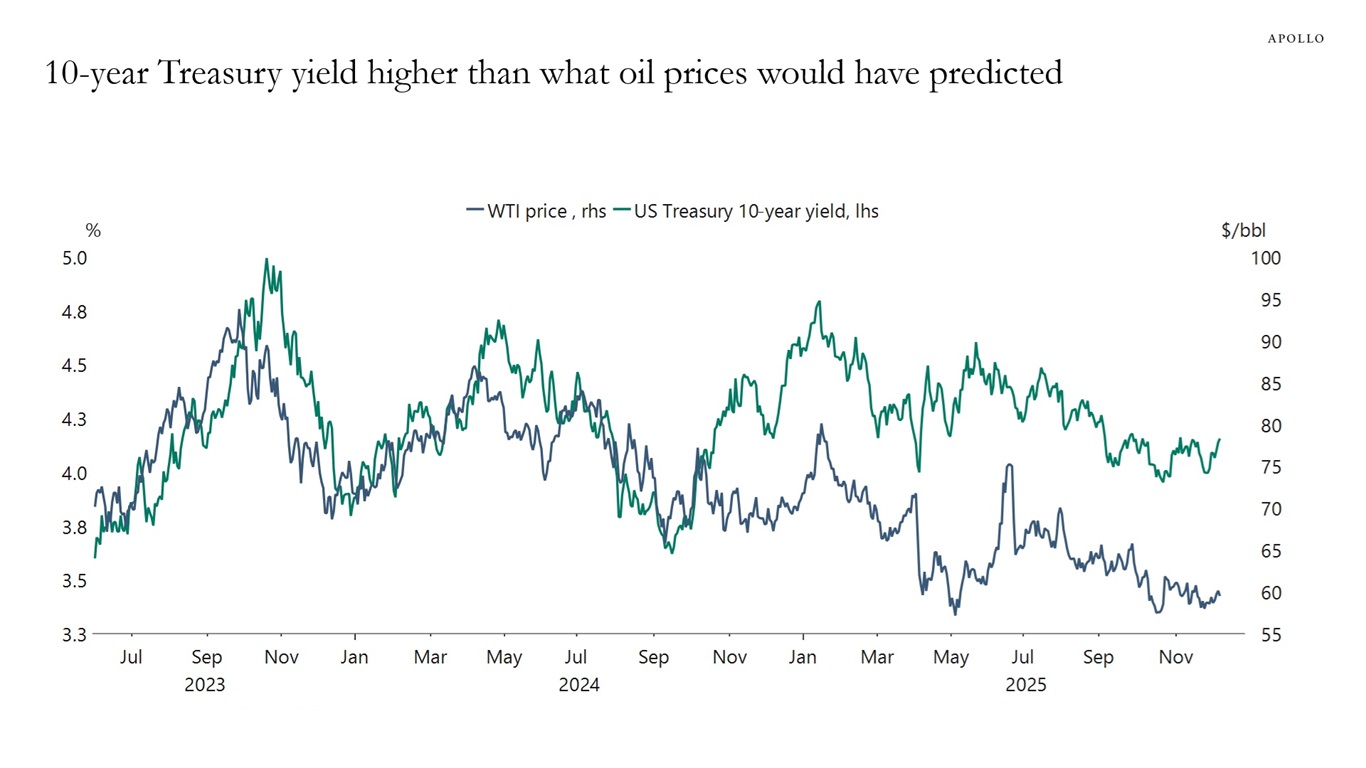
Sources: Bloomberg, Macrobond, Apollo Chief Economist 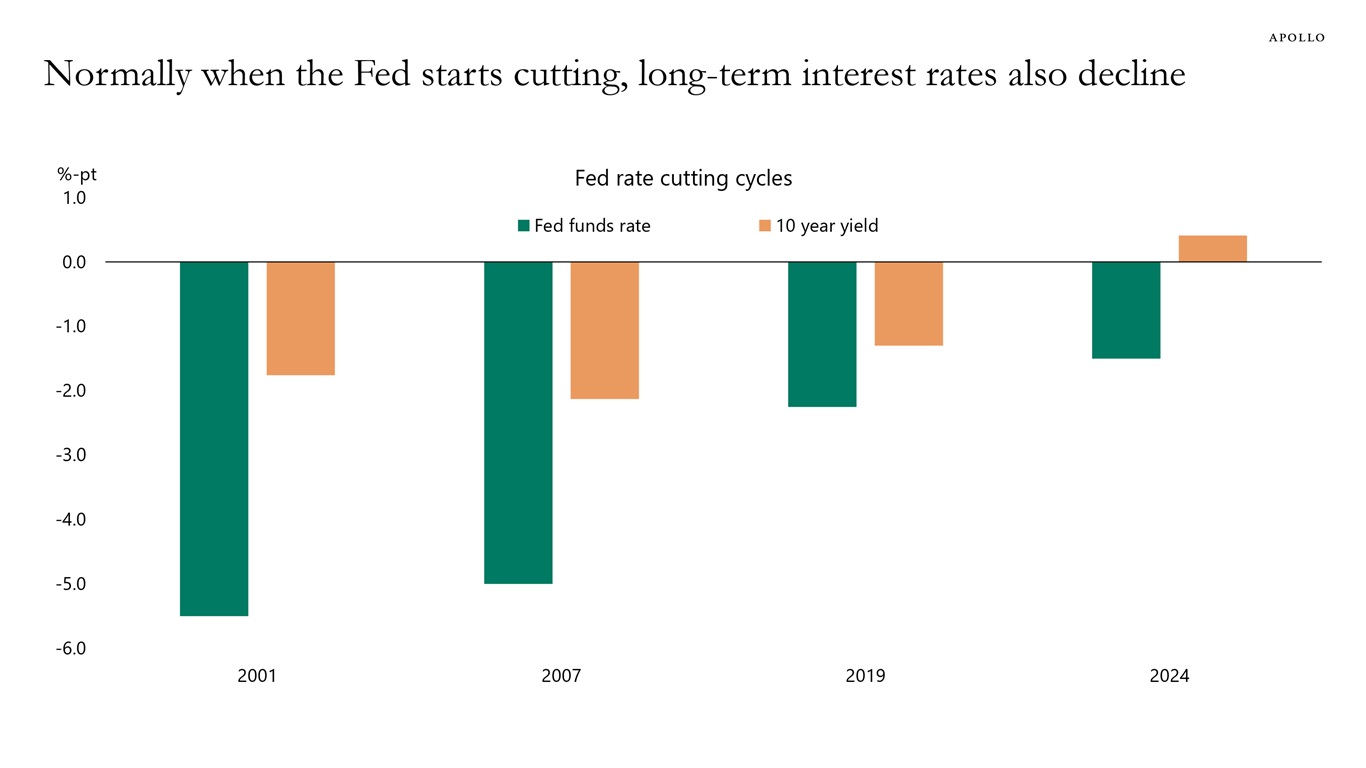
Note: 2001 is from Jan 2001 to June 2003, 2007 is from September 2007 to December 2008, 2019 is from August 2019 to March 2020 and 2024 is from September 2024 to December 2025. Sources: Haver Analytics, Apollo Chief Economist 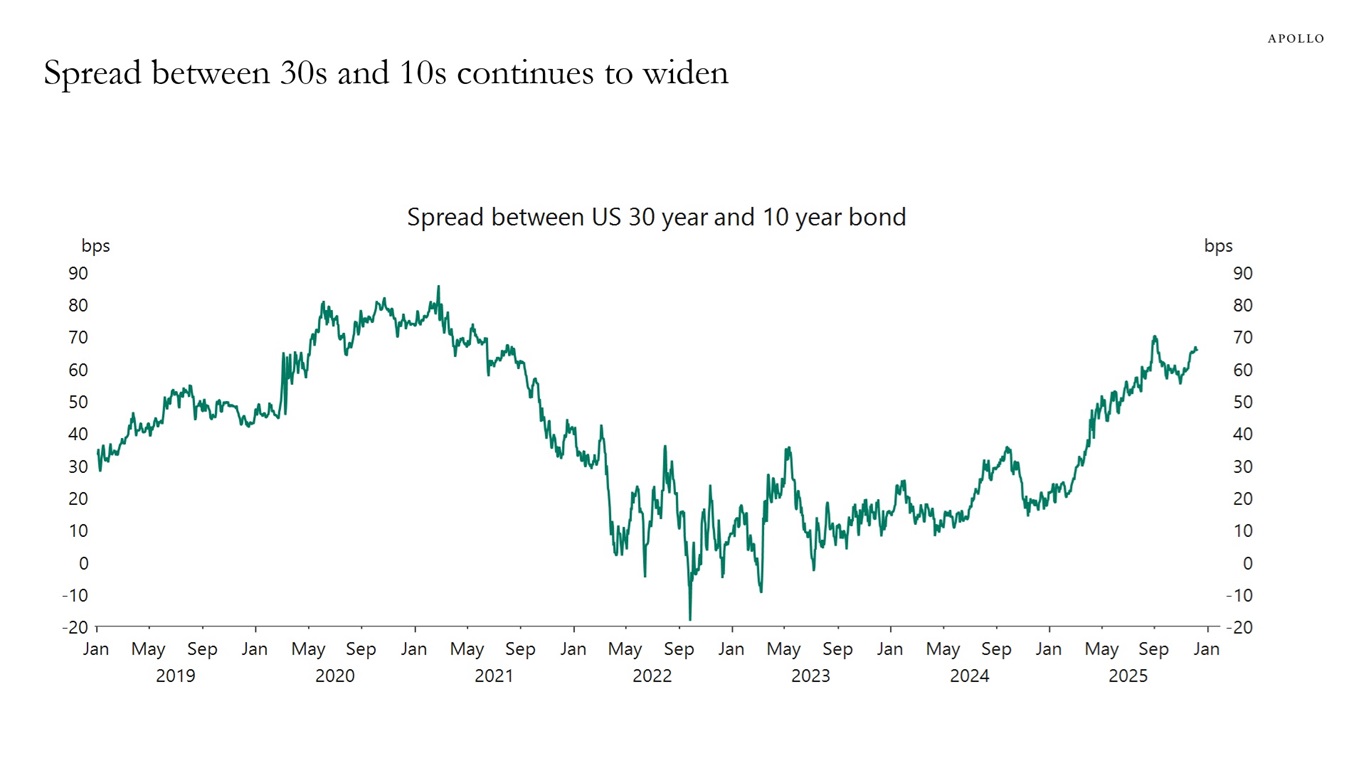
Sources: Bloomberg, Macrobond, Apollo Chief Economist See important disclaimers at the bottom of the page.
-
After the Fed started raising interest rates in 2022, more deals over $1 billion have moved from IPOs to private markets, see chart below.
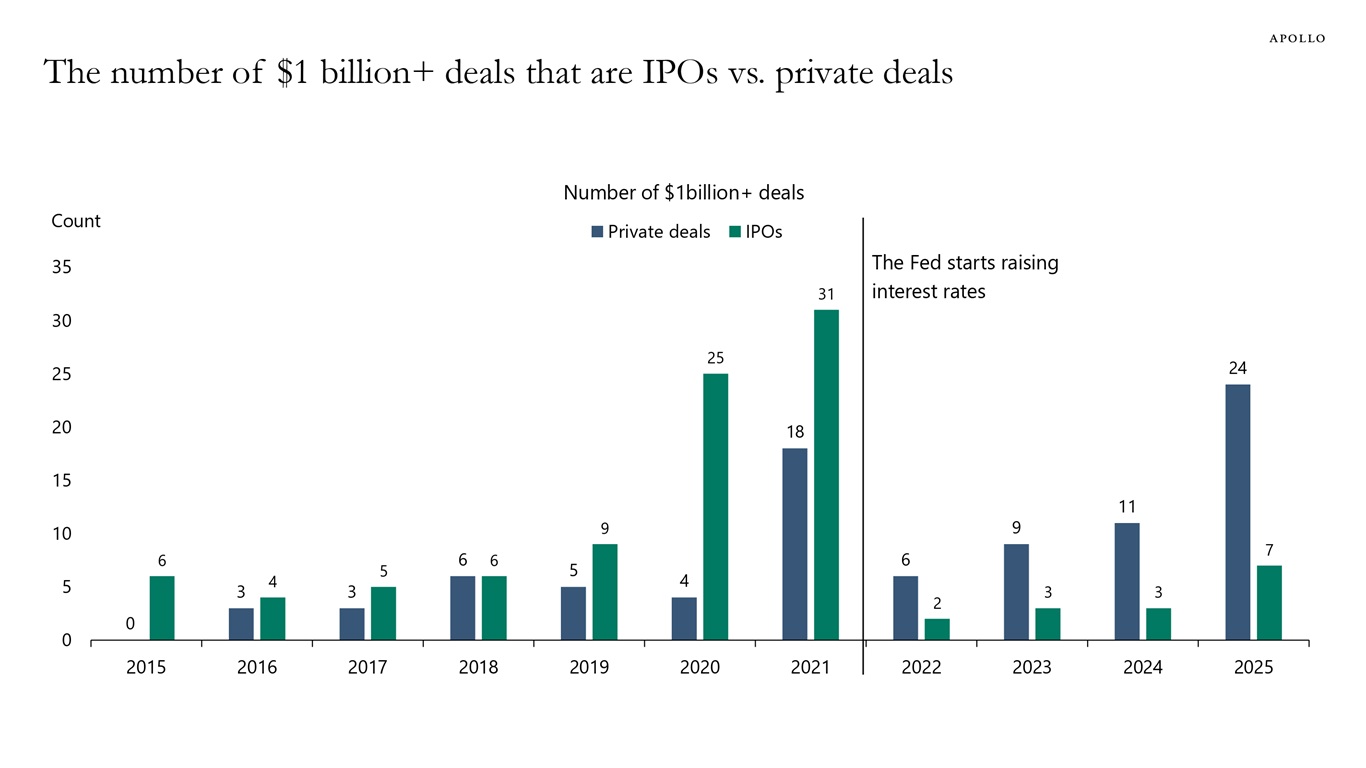
Note: Data as of December 8th, 2025. Sources: PitchBook, Apollo Chief Economist See important disclaimers at the bottom of the page.
-
Forty percent of companies in the Russell 2000 Index have no earnings, see chart below.
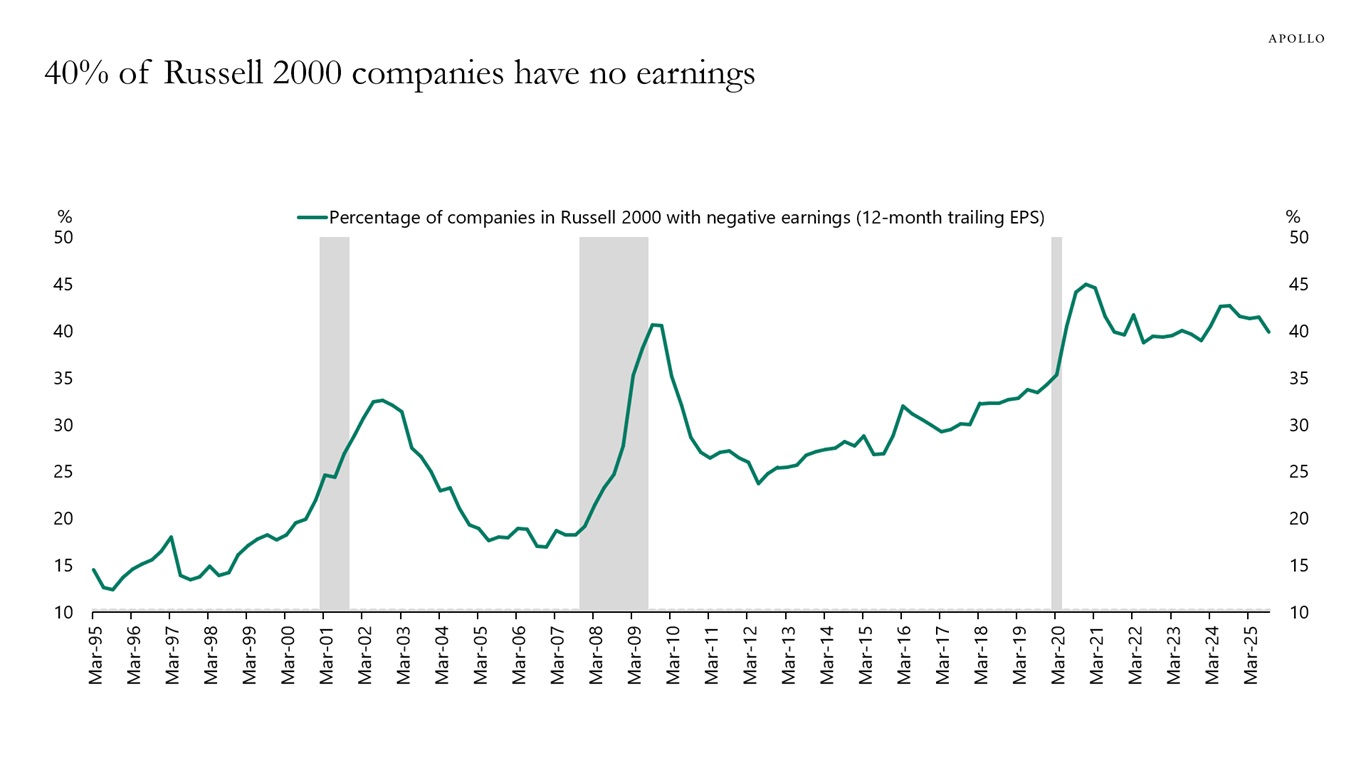
Sources: Bloomberg, Apollo Chief Economist See important disclaimers at the bottom of the page.
-
A record-high share of total wealth in the household sector is owned by people that are more than 70 years old, see chart below.
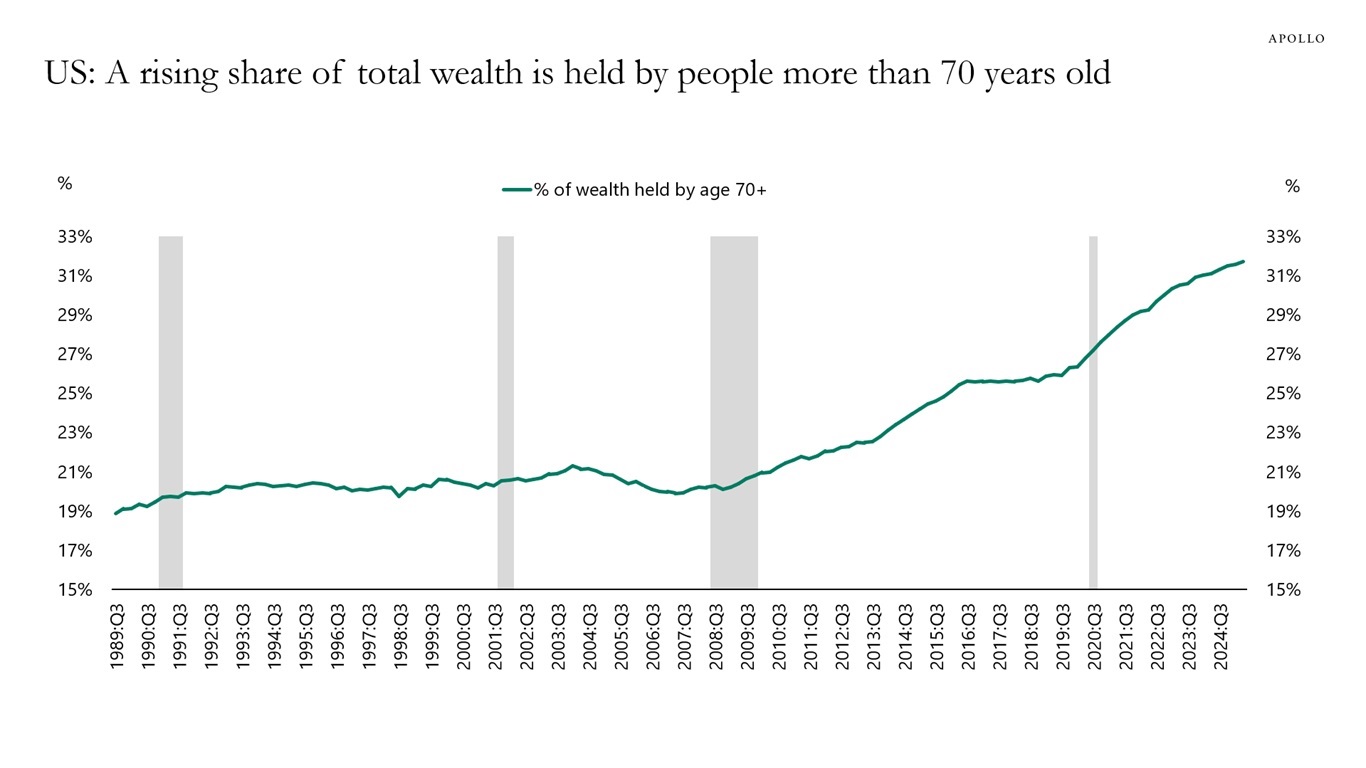
Sources: Federal Reserve, Apollo Chief Economist See important disclaimers at the bottom of the page.
-
A bank takes overnight deposits from checking accounts and lends them out for the next 10 years. This fundamental mismatch between the duration of assets and liabilities in the banking sector is a major problem, particularly in a world where more and more households and firms can withdraw and transfer funds simply by pulling out their iPhones.
For insurance companies, the duration of liabilities is different. In particular, life insurance companies owe policyholders a stream of future cash flows over the next 10 years. As a result, assets and liabilities are duration-matched in insurance firms.
The bottom line is that, in a world where mobile banking is more and more widespread, the duration mismatch in the banking sector is a growing risk, and every dollar that leaves the banking sector and goes to other long-term suitable sources of financing for firms and households makes the financial system more stable.
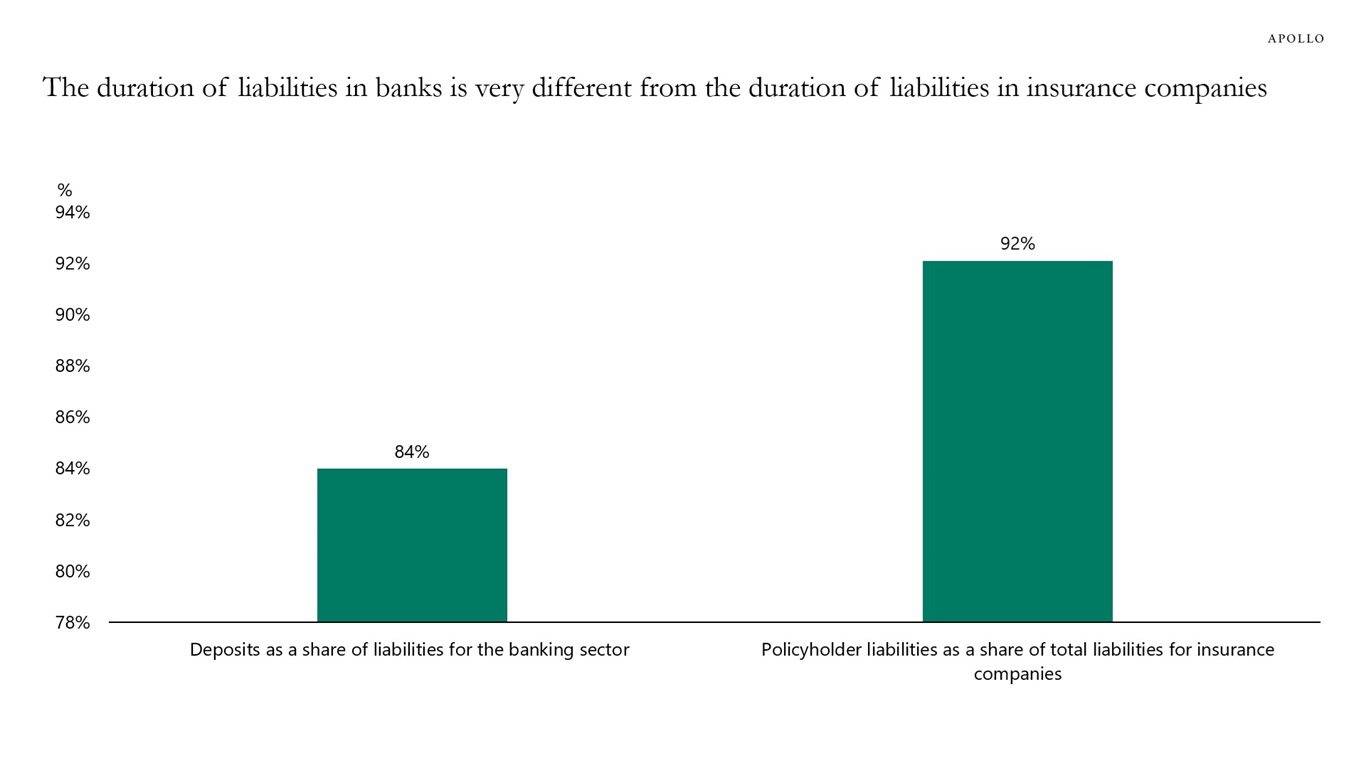
Note: Policyholder liabilities include life insurance reserves, pension entitlements, and miscellaneous liabilities. Sources: Federal Reserve Board, Financial Accounts of United States, Haver Analytics, Apollo Chief Economist See important disclaimers at the bottom of the page.
-
If the recent high-profile defaults were the beginning of a broader credit cycle, then default rates would be going up.
Instead, default rates are falling, and earnings expectations are revised higher, see the first two charts below.
At the same time, the Atlanta Fed expects GDP growth to come in at 3.8%, significantly above the CBO’s 2% estimate of long-term growth for the US.
The bottom line is that the US economy remains incredibly resilient.
Yes, the labor market shows slower job growth, but the observed slowdown in employment growth is not driven by weaker labor demand but by weaker labor supply because of tighter immigration restrictions, including higher fees on H-1Bs. The Fed has made that clear in this paper. In addition, low jobless claims and the recent rise in the daily data for job openings confirms that the slower job growth is not driven by weaker labor demand but by lower labor supply, see the third chart.
Combined with dollar depreciation, lower oil prices and the One Big Beautiful Bill starting to take effect in a few weeks, the upside risks to growth and inflation are significant, see the fourth chart.
In short, a data dependent Fed would come to the conclusion that it should not cut interest rates next week.
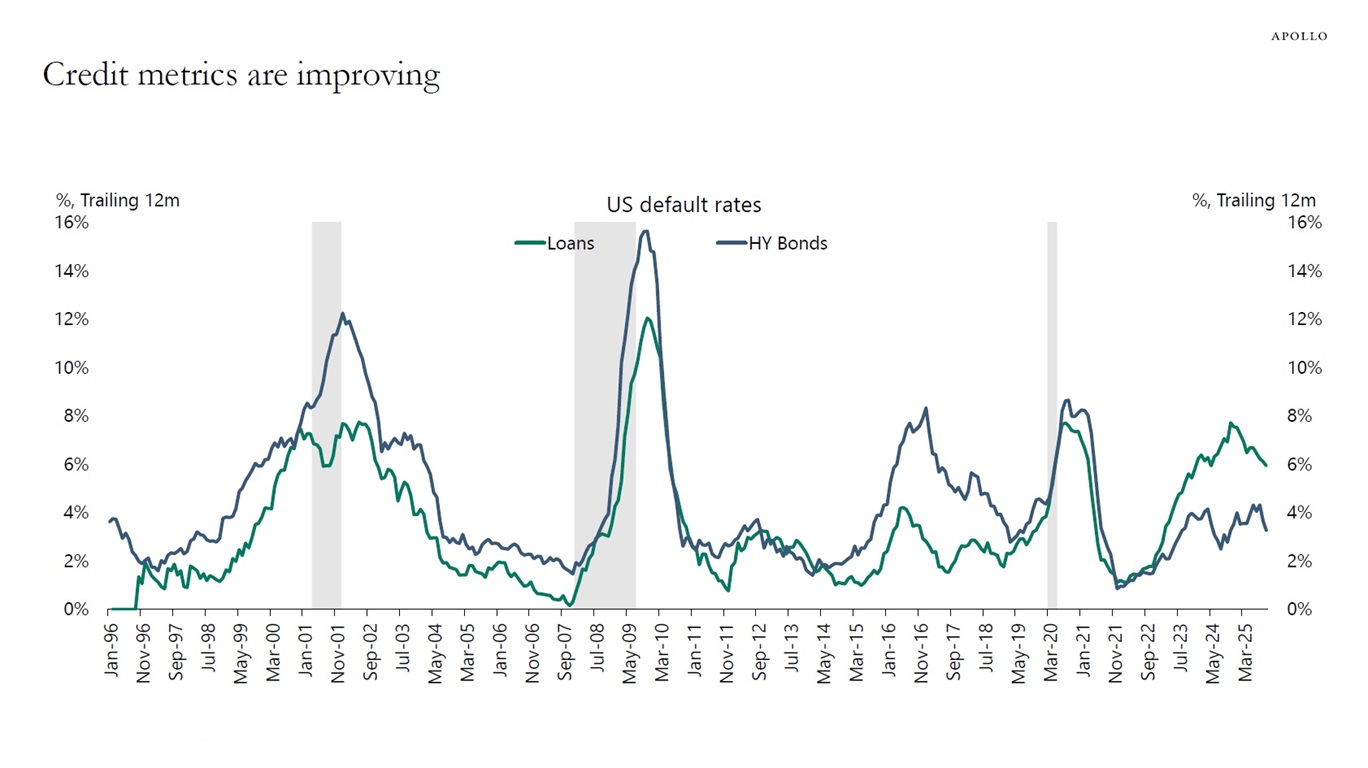
Sources: Moody’s Analytics, Apollo Chief Economist 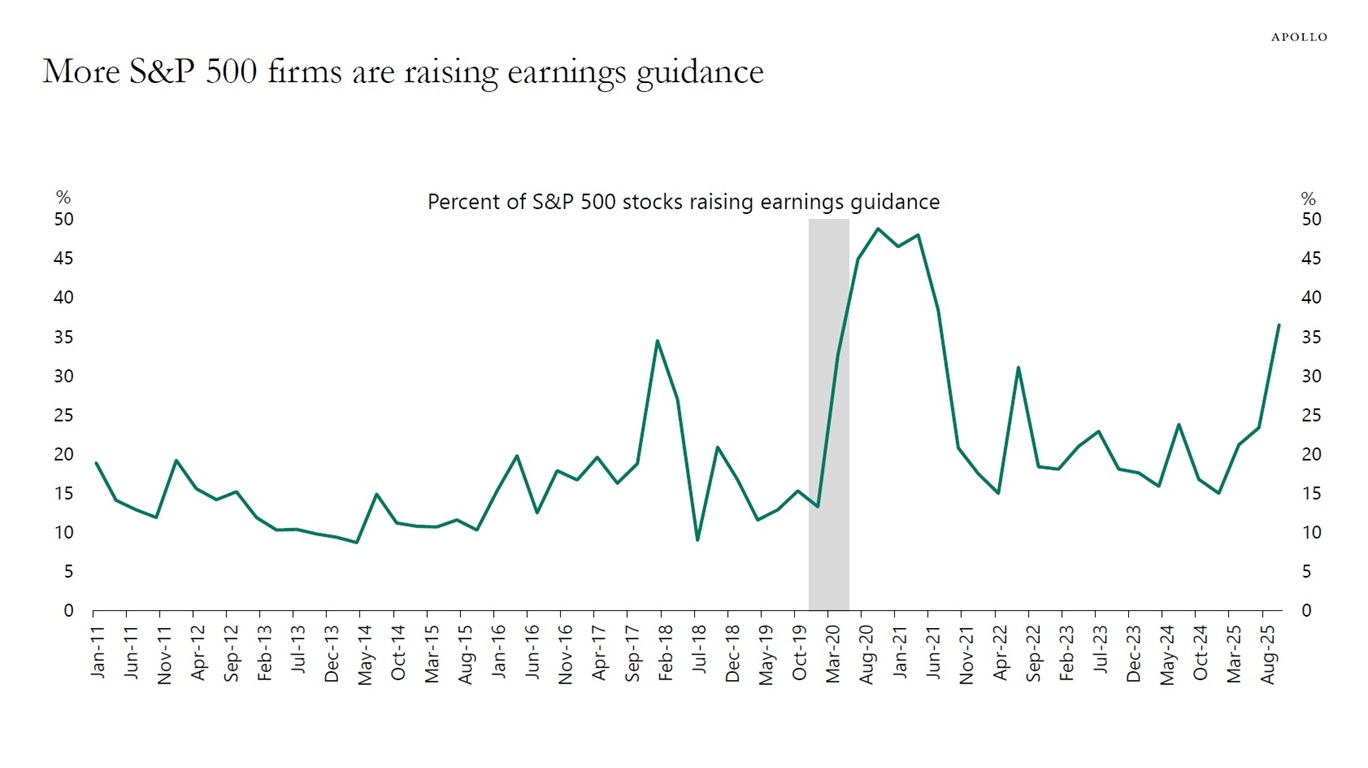
Sources: Bloomberg, Apollo Chief Economist 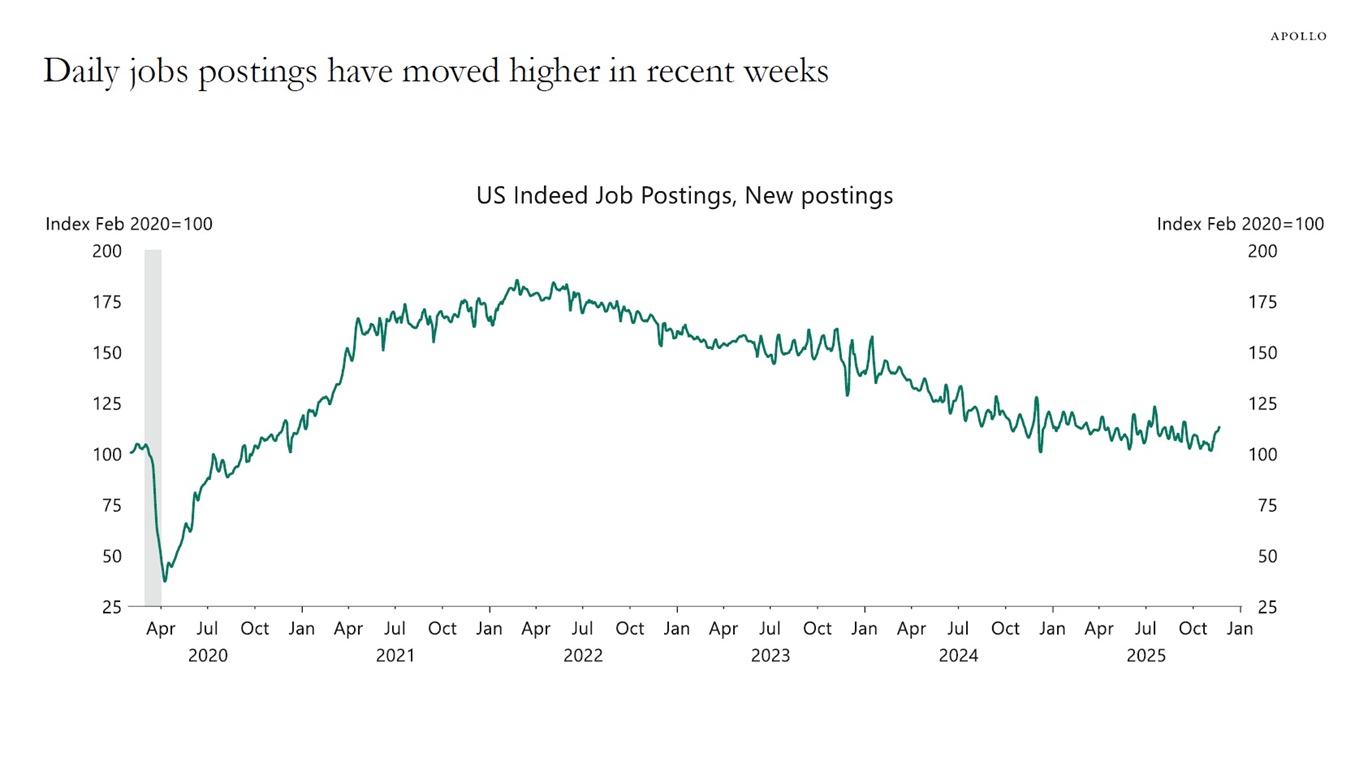
Sources: Indeed, Bloomberg, Macrobond, Apollo Chief Economist 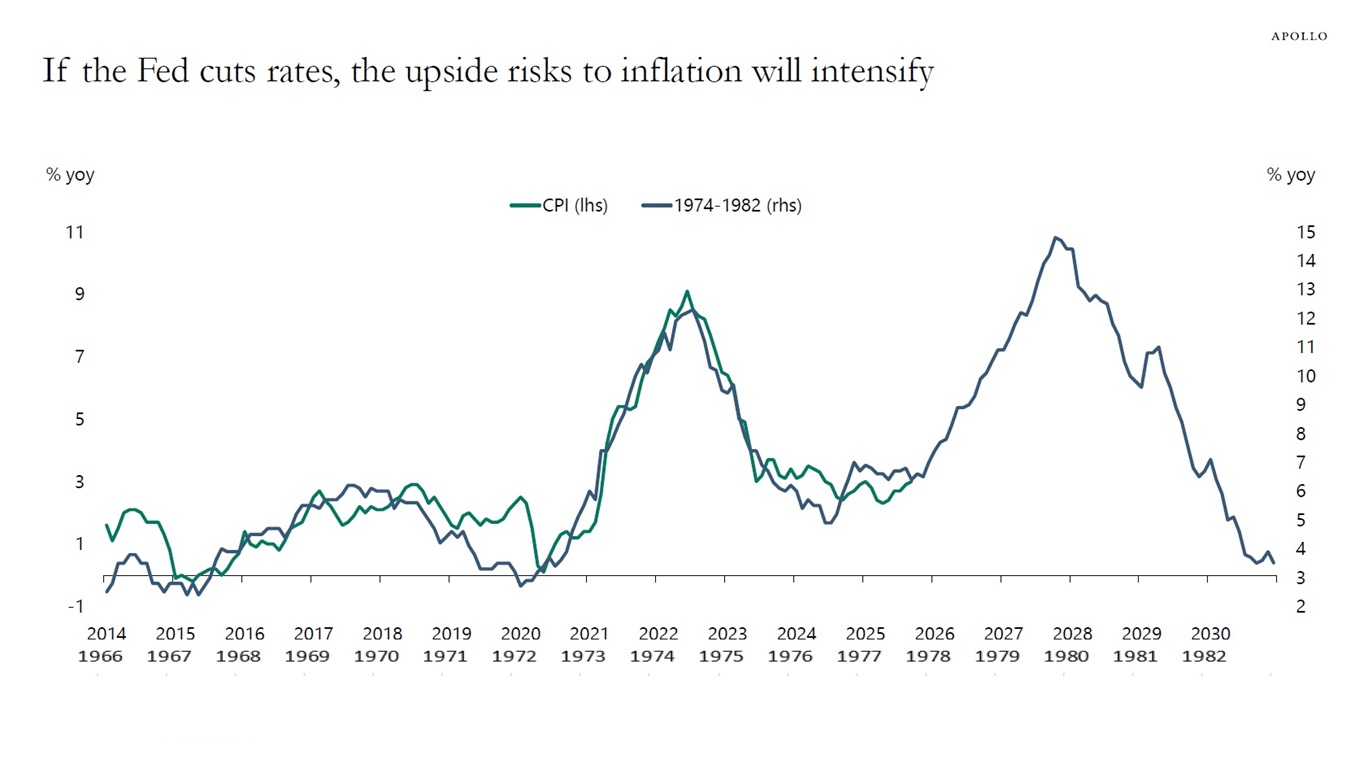
Sources: BLS, Bloomberg, Apollo Chief Economist See important disclaimers at the bottom of the page.
-
There are always upside and downside risks to the outlook. Below are five things we are watching going into 2026.
1. The US economy starts re-accelerating because of the fading trade war shock and the One Big Beautiful Bill, and inflation begins to move higher from an already high level.
2. The global industrial renaissance boosts global growth with more and more countries focusing on homeshoring advanced manufacturing capacity, investing in infrastructure, energy, defense and supply chains.
3. The new Fed Chair lowers interest rates purely for political reasons.
4. AI bubble bursting results in a major correction of Mag 7 equity prices and slows capex spending and high-end consumer spending.
5. Dramatic increase in the supply of fixed income in 2026, coming from growing government deficits and hyperscaler issuance, puts upward pressure on rates and credit spreads.
See important disclaimers at the bottom of the page.
-
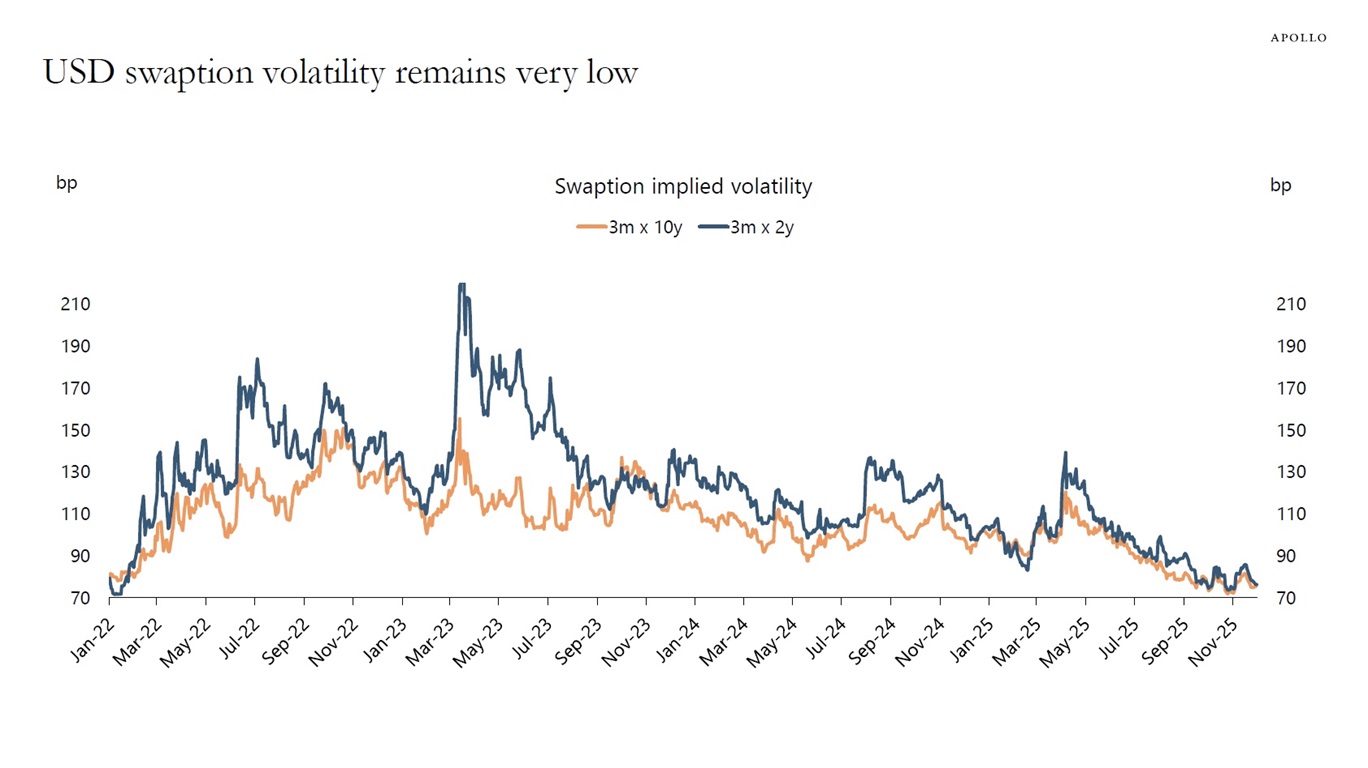
Swaption volatility remains very low despite significant debate about what the Fed will do at its next meeting, see chart below. In other words, the market is not expecting sharp moves in yields over the next three months.
Tickers: USSNAC10 and USSNAC2. Sources: Bloomberg, Apollo Chief Economist See important disclaimers at the bottom of the page.
-
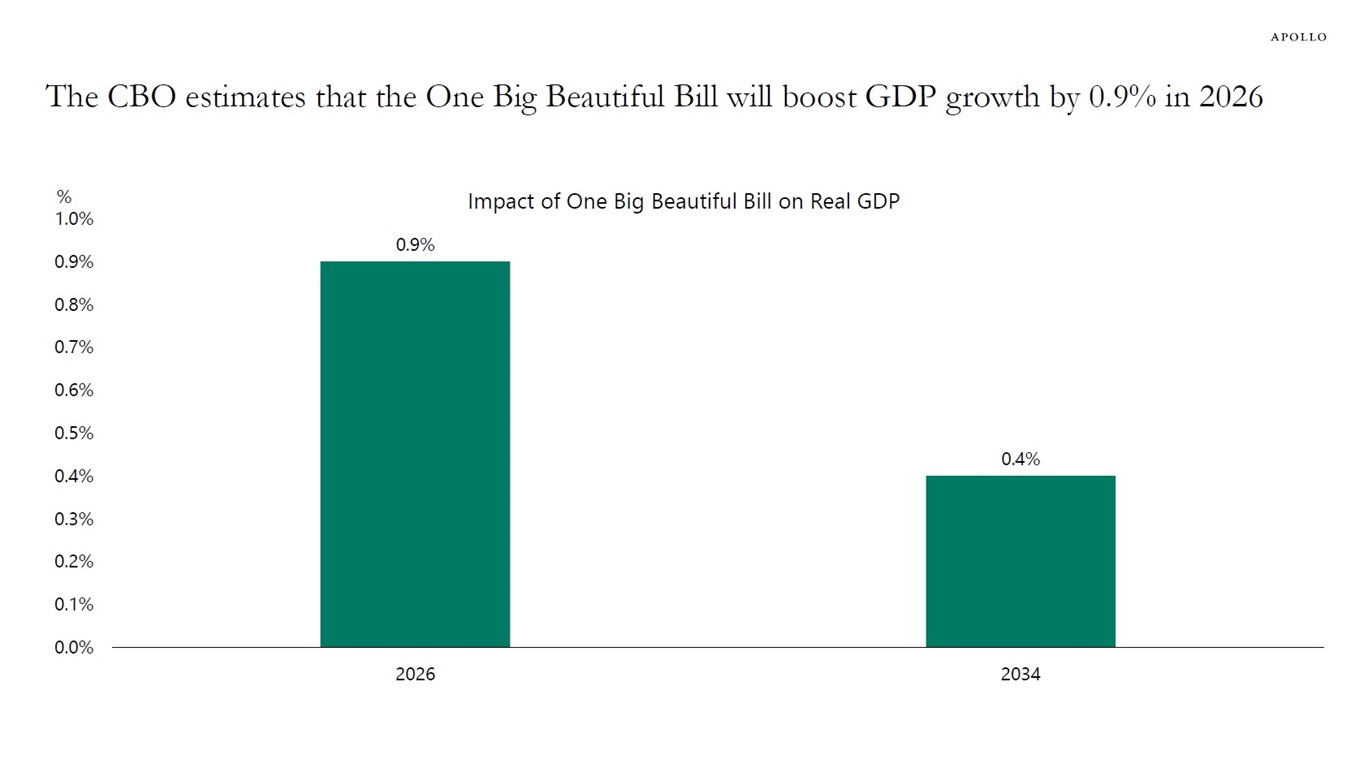
The CBO estimates that the One Big Beautiful Bill will boost GDP growth next year by 0.9%, see chart below. The main factor in the bill is that, starting January 1, 2026, businesses can immediately deduct capital expenses, such as investments in equipment and R&D. This is a major tailwind for the economy in 2026.
Sources: CBO, H.R. 1, One Big Beautiful Bill Act, Apollo Chief Economist See important disclaimers at the bottom of the page.

This presentation may not be distributed, transmitted or otherwise communicated to others in whole or in part without the express consent of Apollo Global Management, Inc. (together with its subsidiaries, “Apollo”).
Apollo makes no representation or warranty, expressed or implied, with respect to the accuracy, reasonableness, or completeness of any of the statements made during this presentation, including, but not limited to, statements obtained from third parties. Opinions, estimates and projections constitute the current judgment of the speaker as of the date indicated. They do not necessarily reflect the views and opinions of Apollo and are subject to change at any time without notice. Apollo does not have any responsibility to update this presentation to account for such changes. There can be no assurance that any trends discussed during this presentation will continue.
Statements made throughout this presentation are not intended to provide, and should not be relied upon for, accounting, legal or tax advice and do not constitute an investment recommendation or investment advice. Investors should make an independent investigation of the information discussed during this presentation, including consulting their tax, legal, accounting or other advisors about such information. Apollo does not act for you and is not responsible for providing you with the protections afforded to its clients. This presentation does not constitute an offer to sell, or the solicitation of an offer to buy, any security, product or service, including interest in any investment product or fund or account managed or advised by Apollo.
Certain statements made throughout this presentation may be “forward-looking” in nature. Due to various risks and uncertainties, actual events or results may differ materially from those reflected or contemplated in such forward-looking information. As such, undue reliance should not be placed on such statements. Forward-looking statements may be identified by the use of terminology including, but not limited to, “may”, “will”, “should”, “expect”, “anticipate”, “target”, “project”, “estimate”, “intend”, “continue” or “believe” or the negatives thereof or other variations thereon or comparable terminology.