


The Daily Spark is moving to Apollo.com— read the latest from Torsten Slok here.
Want it delivered daily to your inbox?
-
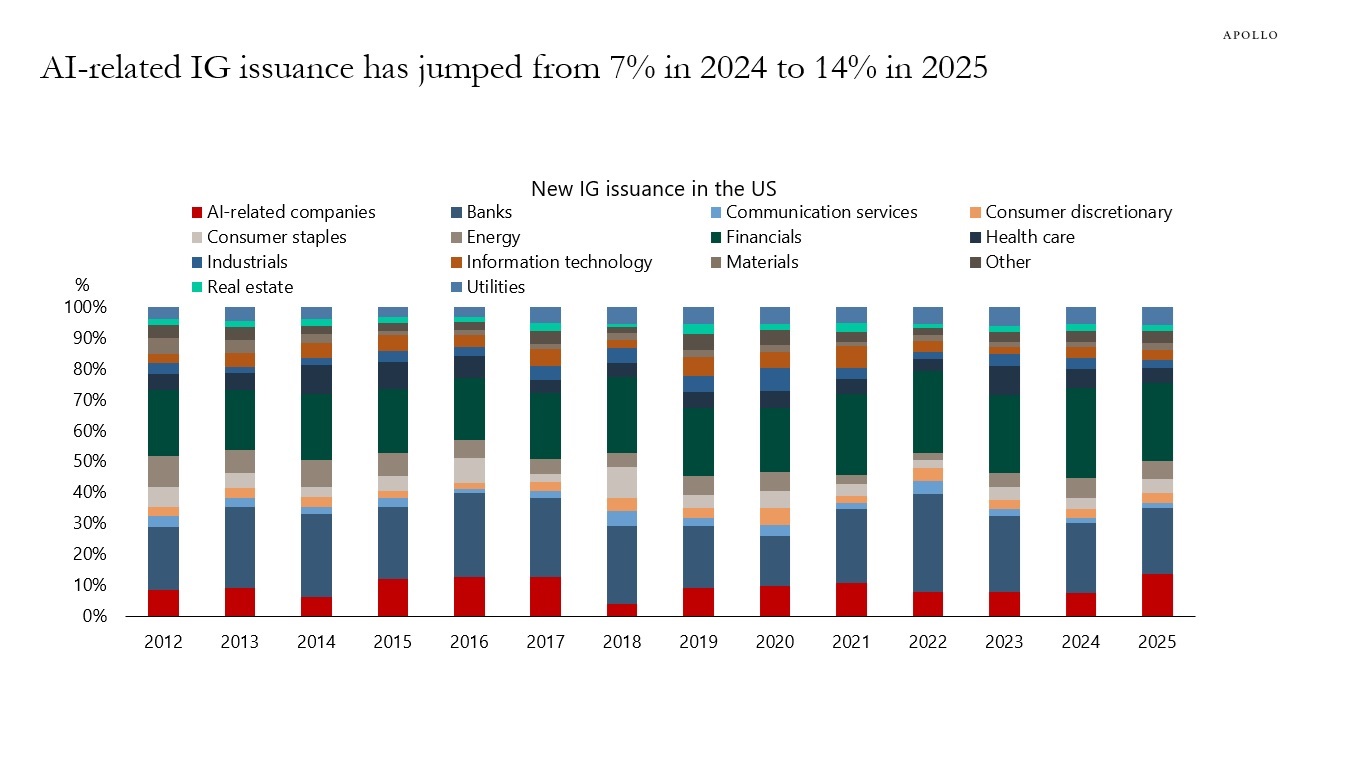
AI-related companies now represent an increasing share of investment-grade indexes, see chart below.

Sources: PitchBook, Apollo Chief Economist Explore the full 2026 Outlook, featuring our macro view and expert perspectives across regions and asset classes, at apollo.com/outlook.
See important disclaimers at the bottom of the page.
-
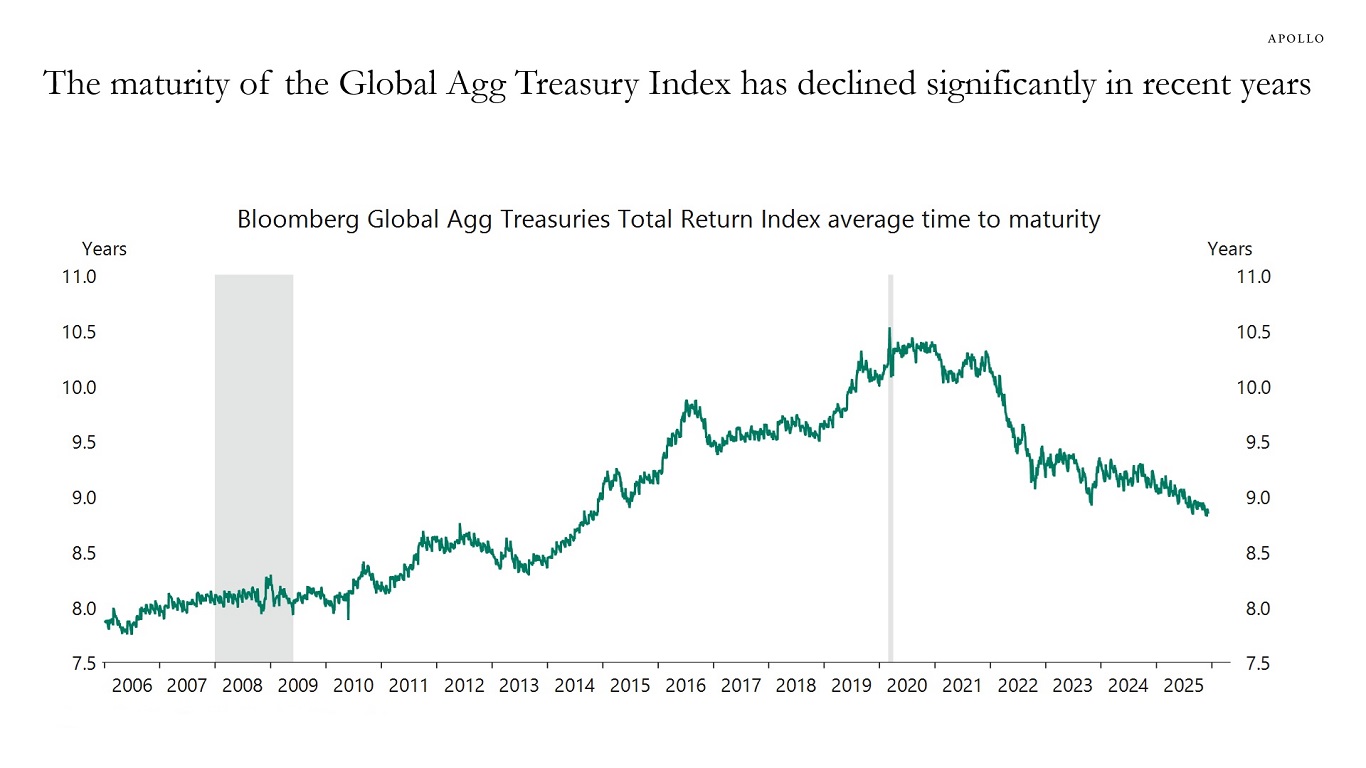
With a steep yield curve, governments are issuing more short‑dated paper to minimize debt‑servicing costs. As a result, the average maturity of the sovereign bond index is declining rapidly, see chart below.
The consequence is that monetary and fiscal policy have become more tightly linked, because a lower maturity makes government interest expenses more sensitive to central bank rate decisions.
Sources: Bloomberg, Macrobond, Apollo Chief Economist Explore the full 2026 Outlook, featuring our macro view and expert perspectives across regions and asset classes, at apollo.com/outlook.
See important disclaimers at the bottom of the page.
-
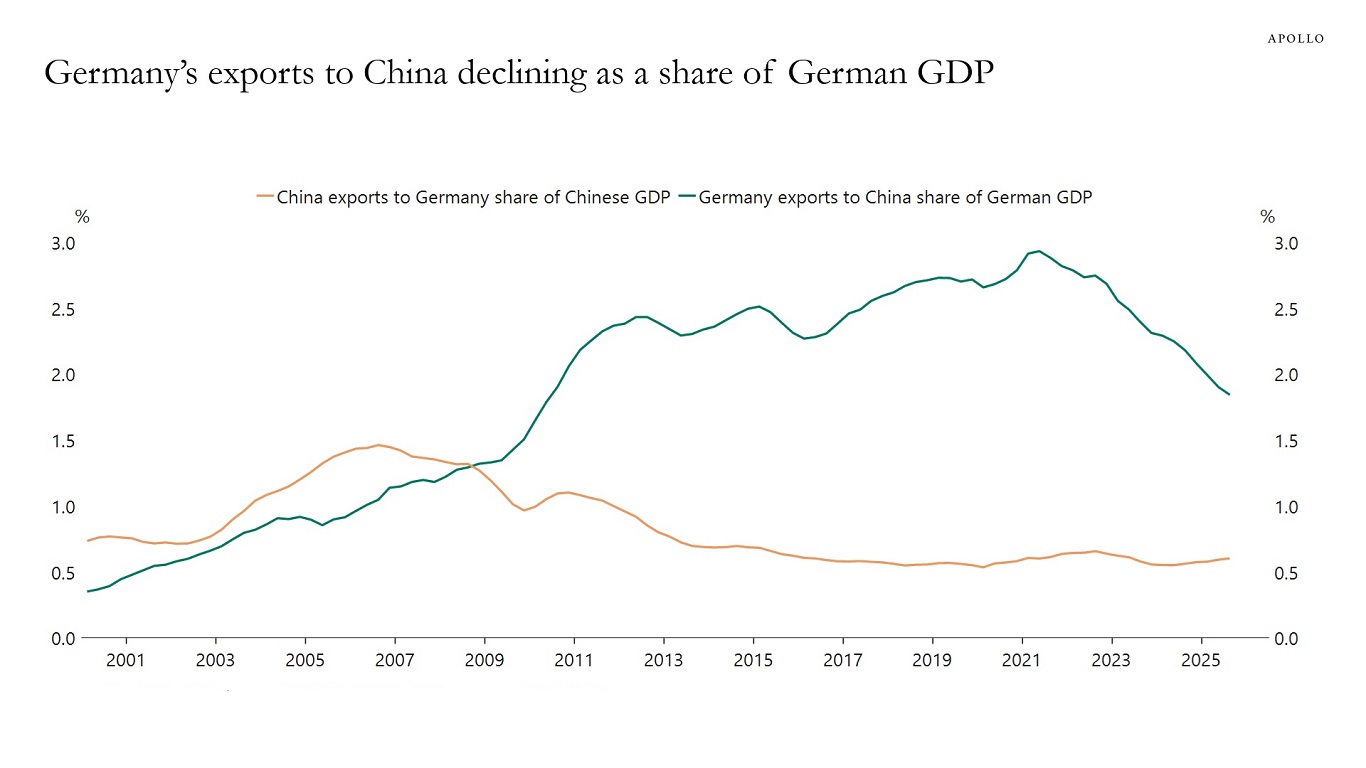
Germany’s exports to China have declined relative to GDP, while China’s exports to Germany have remained stable relative to GDP, see chart below.
Sources: German Federal Statistics Office (Statistisches Bundesamt), Macrobond, Apollo Chief Economist Explore the full 2026 Outlook, featuring our macro view and expert perspectives across regions and asset classes, at apollo.com/outlook.
Note: The Daily Spark will resume on December 26.
See important disclaimers at the bottom of the page.
-
Fiscal and inflation worries are putting upward pressure on long-term interest rates across the G3, and these concerns are not going away anytime soon, see chart below.
The bottom line is that long-term interest rates are going to stay higher for longer and investors should plan accordingly.
Sources: US Department of Treasury, Macrobond, Apollo Chief Economist Explore the full 2026 Outlook, featuring our macro view and expert perspectives across regions and asset classes, at apollo.com/outlook.
See important disclaimers at the bottom of the page.
-
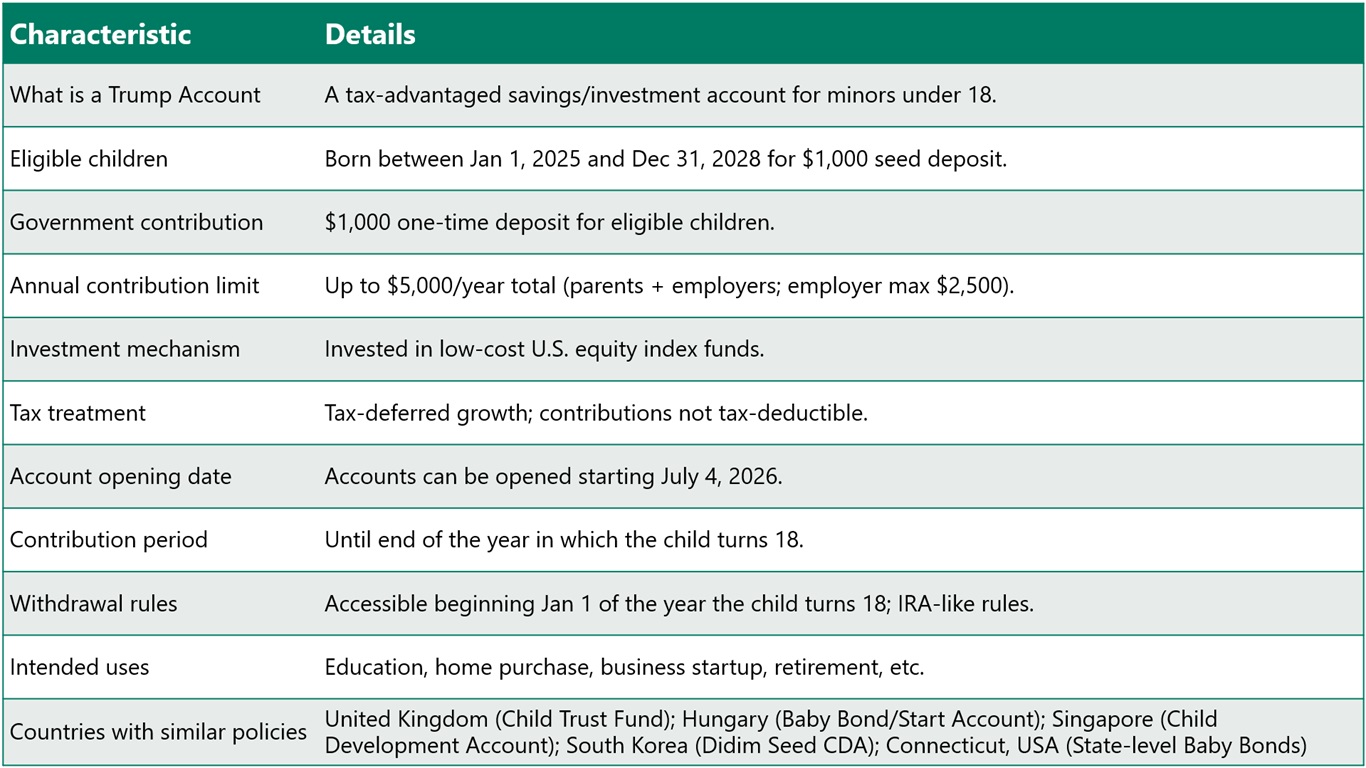
The One Big Beautiful Bill includes a Trump Account, which is a new tax‑advantaged, long‑term investment account created for children under 18. Accounts can be opened starting July 4, 2026. They are designed to help families build savings for a child’s future such as education, a first home or starting a business using tax‑deferred investment growth, see overview below.
Source: Apollo Chief Economist Explore the full 2026 Outlook, featuring our macro view and expert perspectives across regions and asset classes, at apollo.com/outlook.
See important disclaimers at the bottom of the page.
-
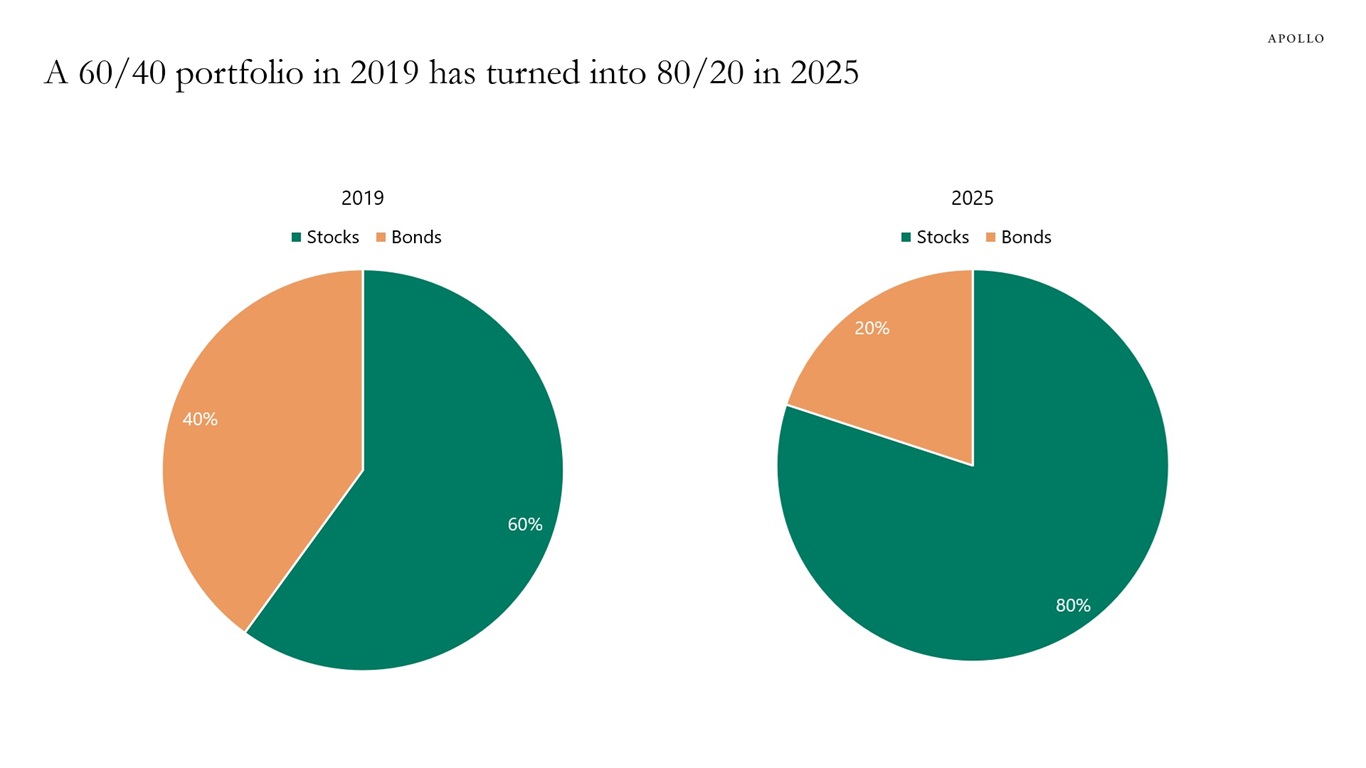
Investing in a 60/40 portfolio in 2019 and leaving it would have made it an 80/20 portfolio in 2025 because of the dramatic increase in the stock prices of the Magnificent Seven, see chart below.
Similarly, as hyperscalers issue more debt, the weight of AI is also growing in the public IG index.
The bottom line is that investors in public equities and public credit are more exposed to AI than ever before.
Note: Stock portfolio is invested in the S&P 500 Index, and bond portfolio is invested in the Bloomberg US Aggregate Bond Index. Sources: Bloomberg, Apollo Chief Economist Explore the full 2026 Outlook, featuring our macro view and expert perspectives across regions and asset classes, at apollo.com/outlook.
See important disclaimers at the bottom of the page.
-
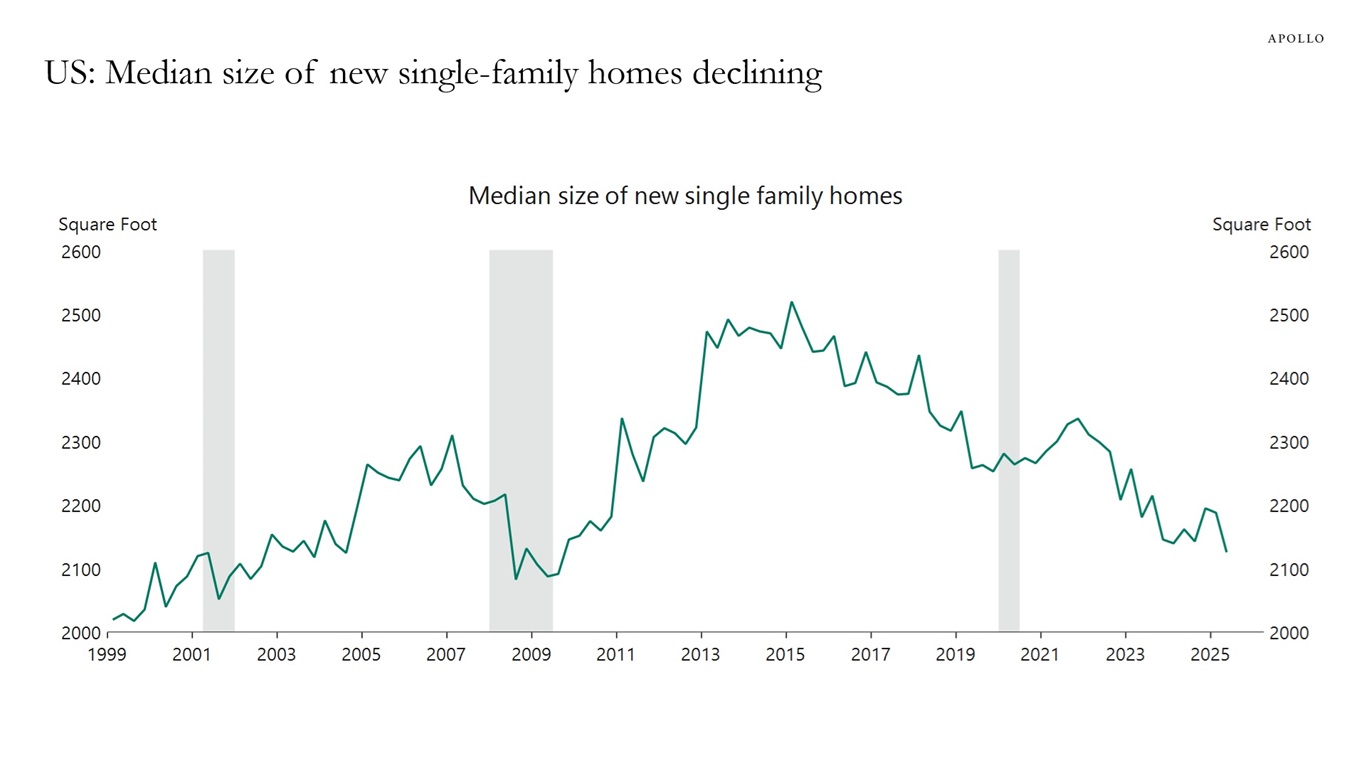
The median size of newly constructed single-family homes peaked at 2,500 square feet in 2015, and has since then declined steadily, see chart below.
Sources: US Census Bureau, Macrobond, Apollo Chief Economist Explore the full 2026 Outlook, featuring our macro view and expert perspectives across regions and asset classes, at apollo.com/outlook.
See important disclaimers at the bottom of the page.
-
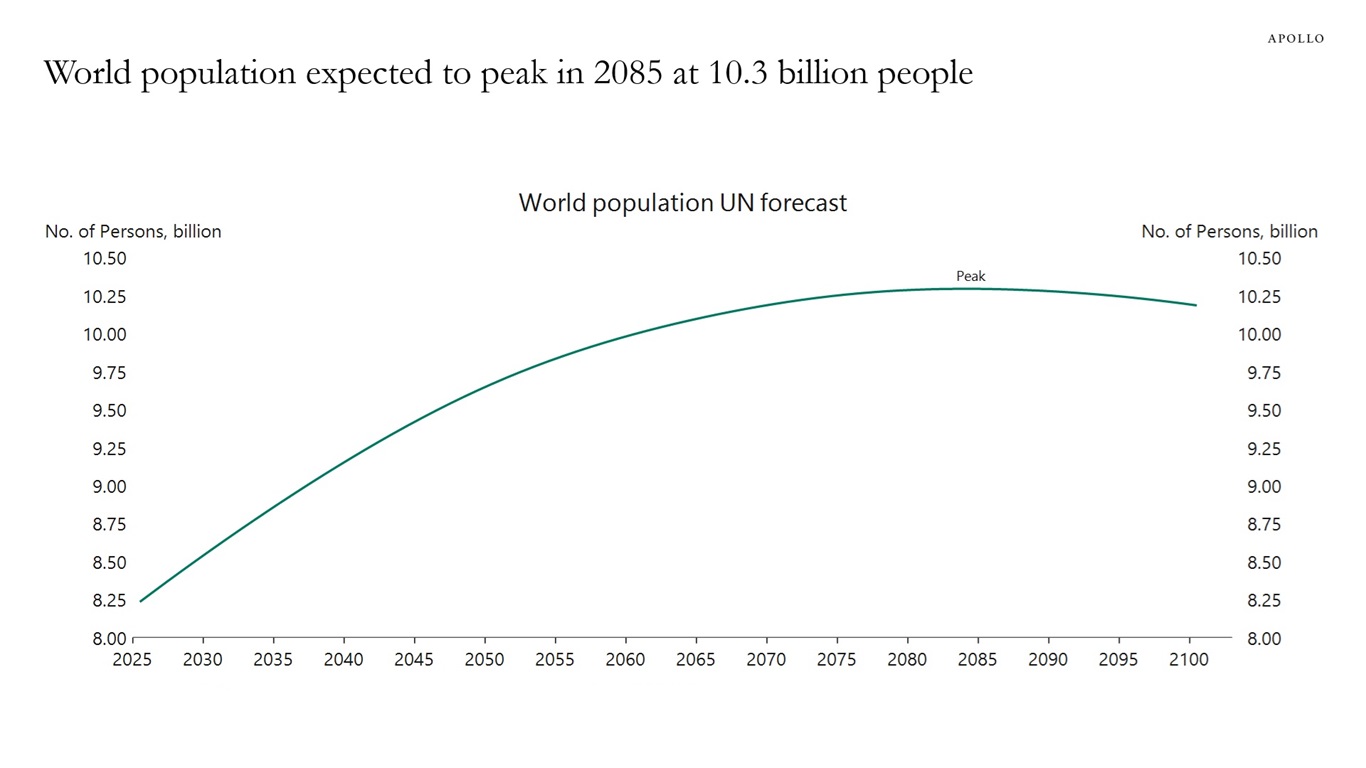
The United Nations is forecasting that the world population will peak in 2085, see chart below.
Sources: United Nations Department of Economic & Social Affairs (UNDESA), Macrobond, Apollo Chief Economist See important disclaimers at the bottom of the page.
-
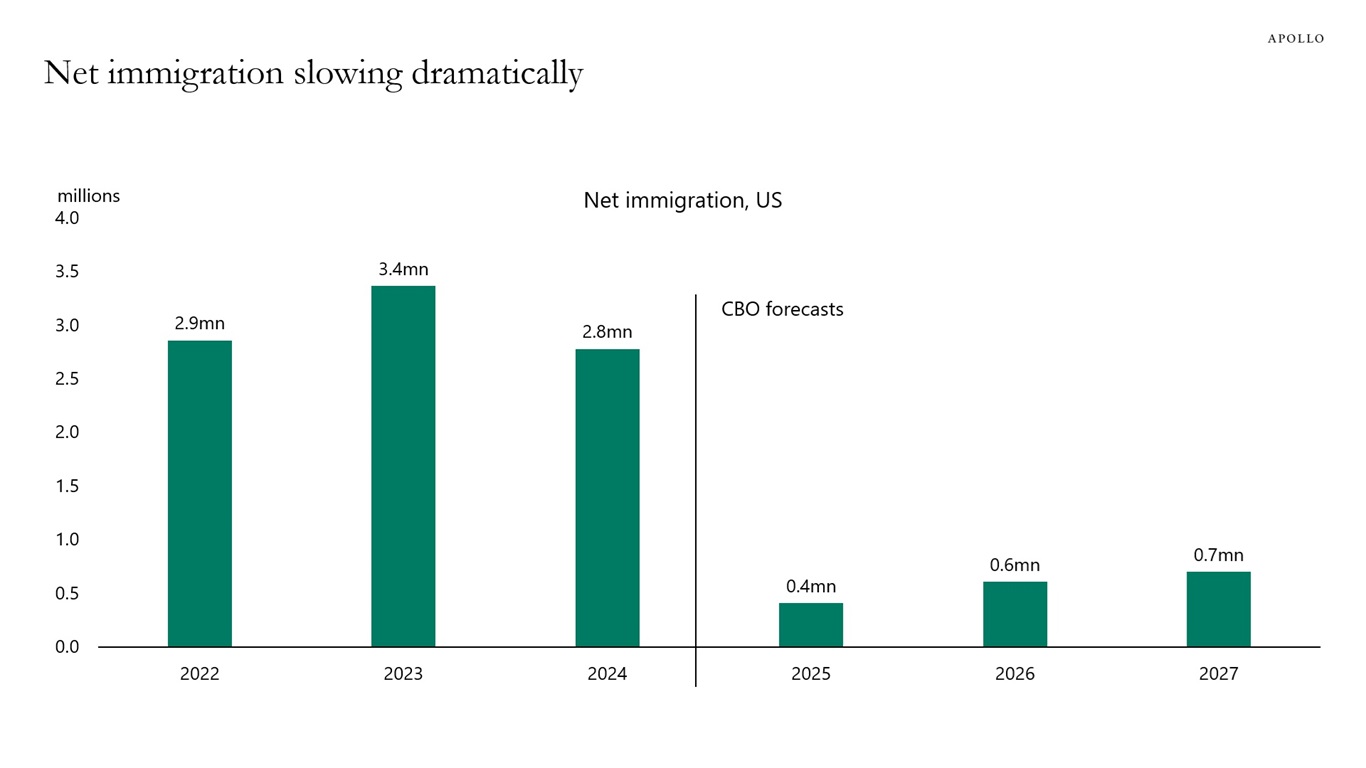
From 2022 to 2024, net immigration was around 3 million people per year, and the CBO is forecasting that annual immigration in 2025 and 2026 will be around 500,000 people, see chart below. This has important consequences for labor supply, wage growth and housing demand.
Sources: An Update to the Demographic Outlook, 2025 to 2055 | Congressional Budget Office, Apollo Chief Economist See important disclaimers at the bottom of the page.
-
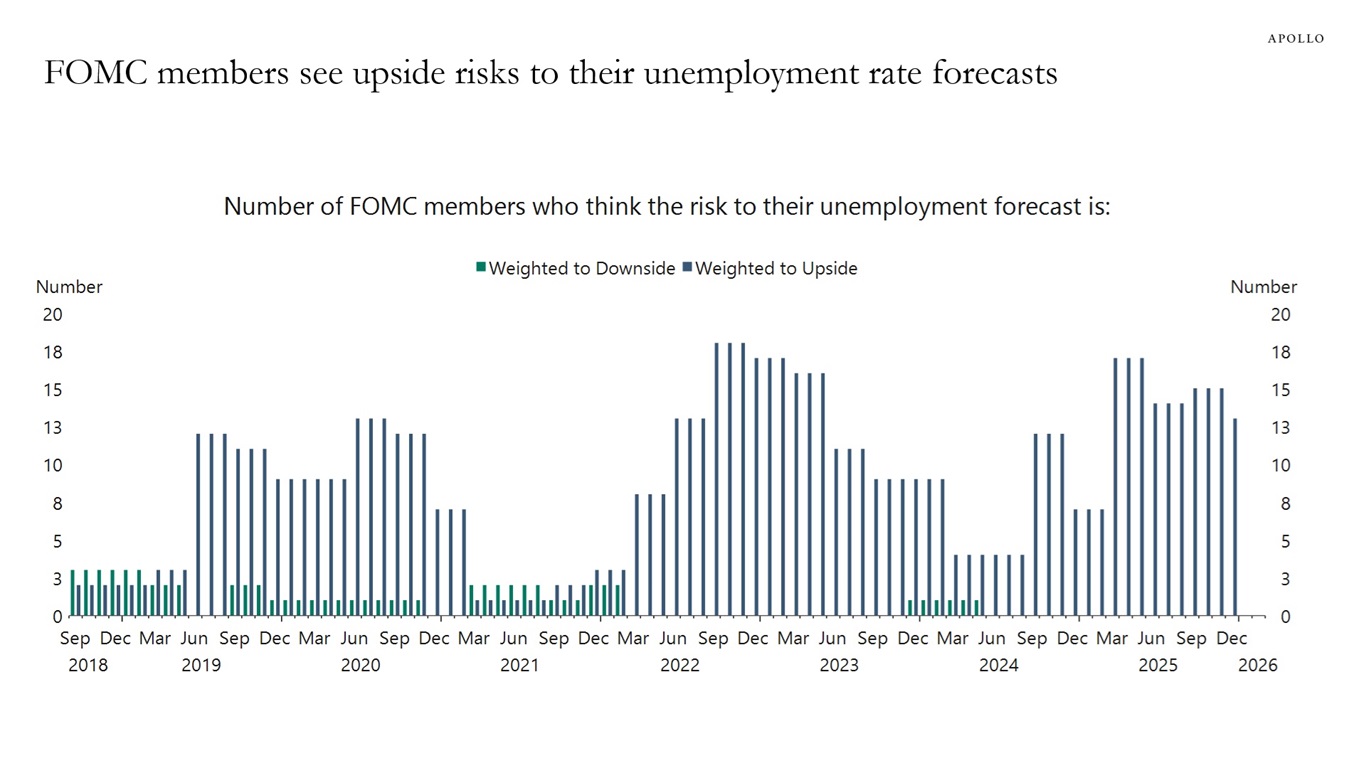
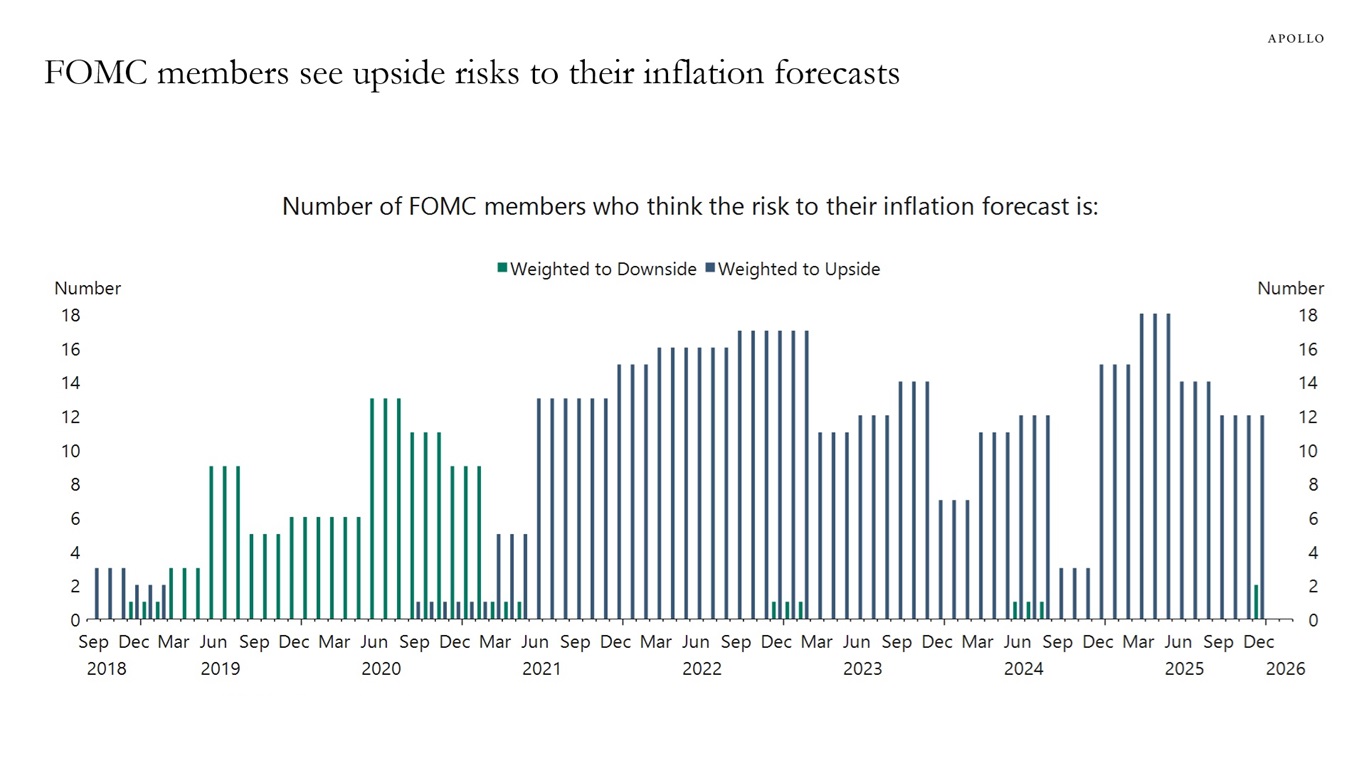
When FOMC members produce their forecasts ahead of Fed meetings, they are also asked how they view the risks to inflation and unemployment.
Currently, FOMC members foresee upside risks to the unemployment rate and inflation, see charts below.
In other words, the Fed continues to forecast stagflation and is concerned that we in 2026 may experience rising inflation and rising unemployment at the same time.
Sources: Federal Reserve, Macrobond, Apollo Chief Economist Sources: Federal Reserve, Macrobond, Apollo Chief Economist See important disclaimers at the bottom of the page.


This presentation may not be distributed, transmitted or otherwise communicated to others in whole or in part without the express consent of Apollo Global Management, Inc. (together with its subsidiaries, “Apollo”).
Apollo makes no representation or warranty, expressed or implied, with respect to the accuracy, reasonableness, or completeness of any of the statements made during this presentation, including, but not limited to, statements obtained from third parties. Opinions, estimates and projections constitute the current judgment of the speaker as of the date indicated. They do not necessarily reflect the views and opinions of Apollo and are subject to change at any time without notice. Apollo does not have any responsibility to update this presentation to account for such changes. There can be no assurance that any trends discussed during this presentation will continue.
Statements made throughout this presentation are not intended to provide, and should not be relied upon for, accounting, legal or tax advice and do not constitute an investment recommendation or investment advice. Investors should make an independent investigation of the information discussed during this presentation, including consulting their tax, legal, accounting or other advisors about such information. Apollo does not act for you and is not responsible for providing you with the protections afforded to its clients. This presentation does not constitute an offer to sell, or the solicitation of an offer to buy, any security, product or service, including interest in any investment product or fund or account managed or advised by Apollo.
Certain statements made throughout this presentation may be “forward-looking” in nature. Due to various risks and uncertainties, actual events or results may differ materially from those reflected or contemplated in such forward-looking information. As such, undue reliance should not be placed on such statements. Forward-looking statements may be identified by the use of terminology including, but not limited to, “may”, “will”, “should”, “expect”, “anticipate”, “target”, “project”, “estimate”, “intend”, “continue” or “believe” or the negatives thereof or other variations thereon or comparable terminology.