


The Daily Spark is moving to Apollo.com— read the latest from Torsten Slok here.
Want it delivered daily to your inbox?
-
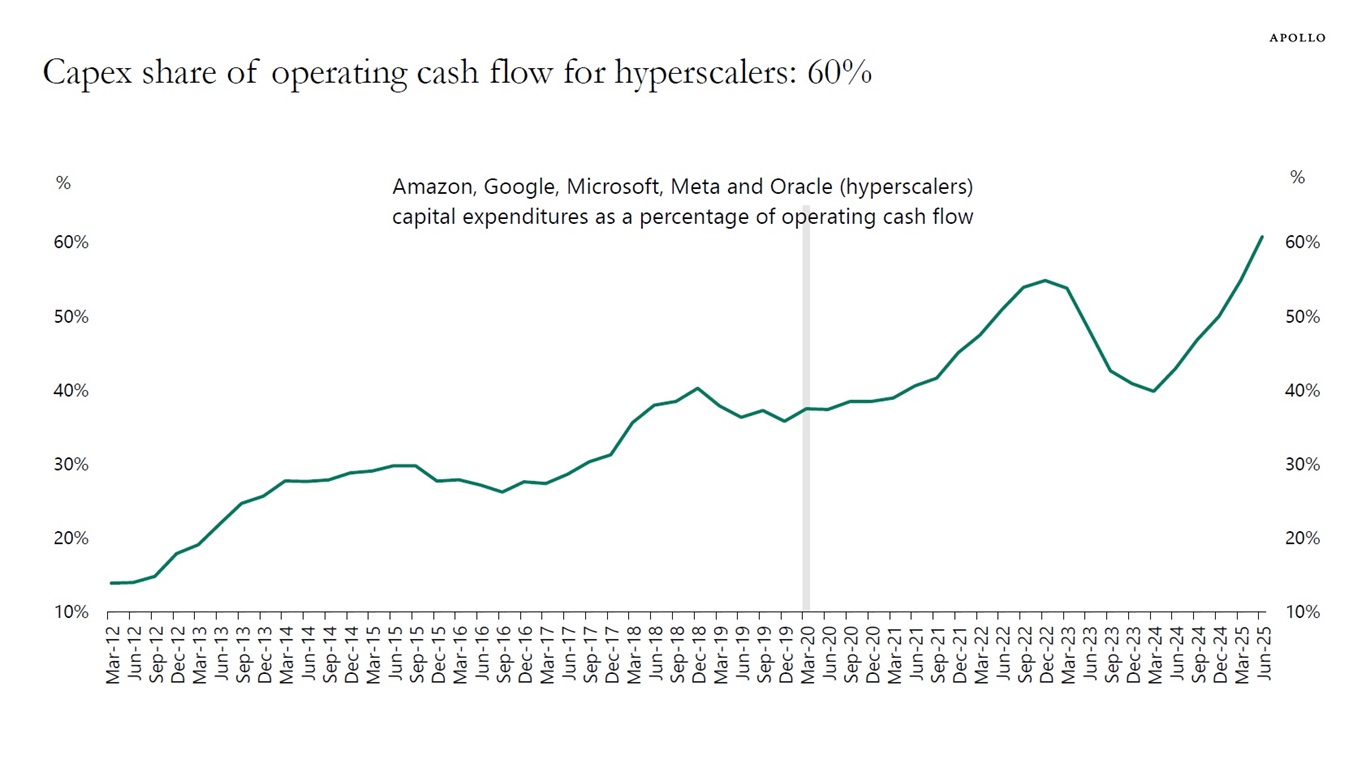
Hyperscalers are currently spending a record high 60% of their operating cash flow on capex, see chart below.
Sources: Bloomberg, Apollo Chief Economist See important disclaimers at the bottom of the page.
-
There are about 5,500 data centers in the US, and in Germany there are 529, see chart below. The bottom line is that the rest of the world is far behind the US when it comes to AI.
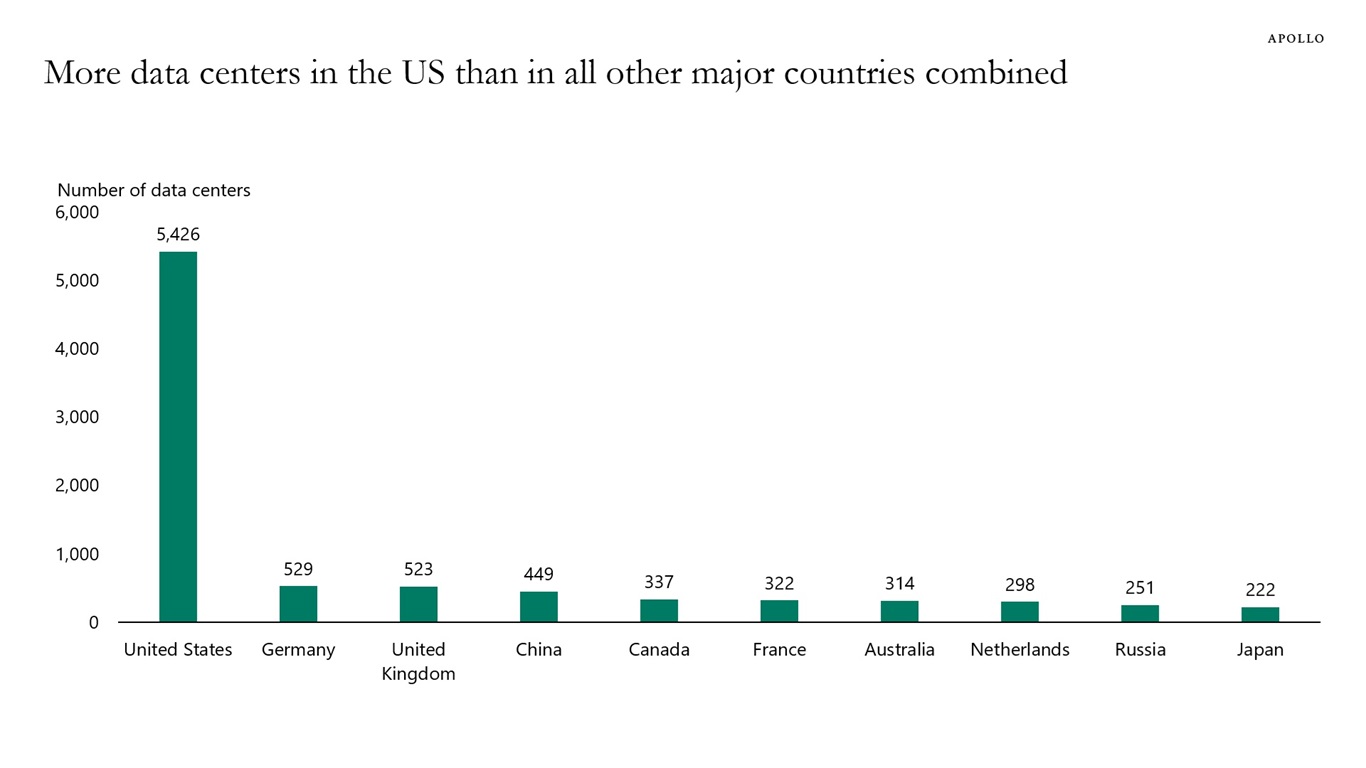
Note: Data as of March 2025. Sources: Statista, Cloudscene, Apollo Chief Economist See important disclaimers at the bottom of the page.
-
High yield index duration has declined significantly for three reasons:
1) After the Fed raised rates in 2022, and the entire yield curve shifted higher, issuers became reluctant to lock in high coupons for extended periods, instead opting for three- to five-year maturities.
2) Stronger balance sheets and upgrades have raised the average credit rating for high yield, indirectly reducing duration because higher-quality issuers usually issue shorter-term paper, see the second chart.
3) Higher yield levels compress duration mathematically, and a bond’s modified duration declines as its coupon rises, even if the maturity structure is constant.
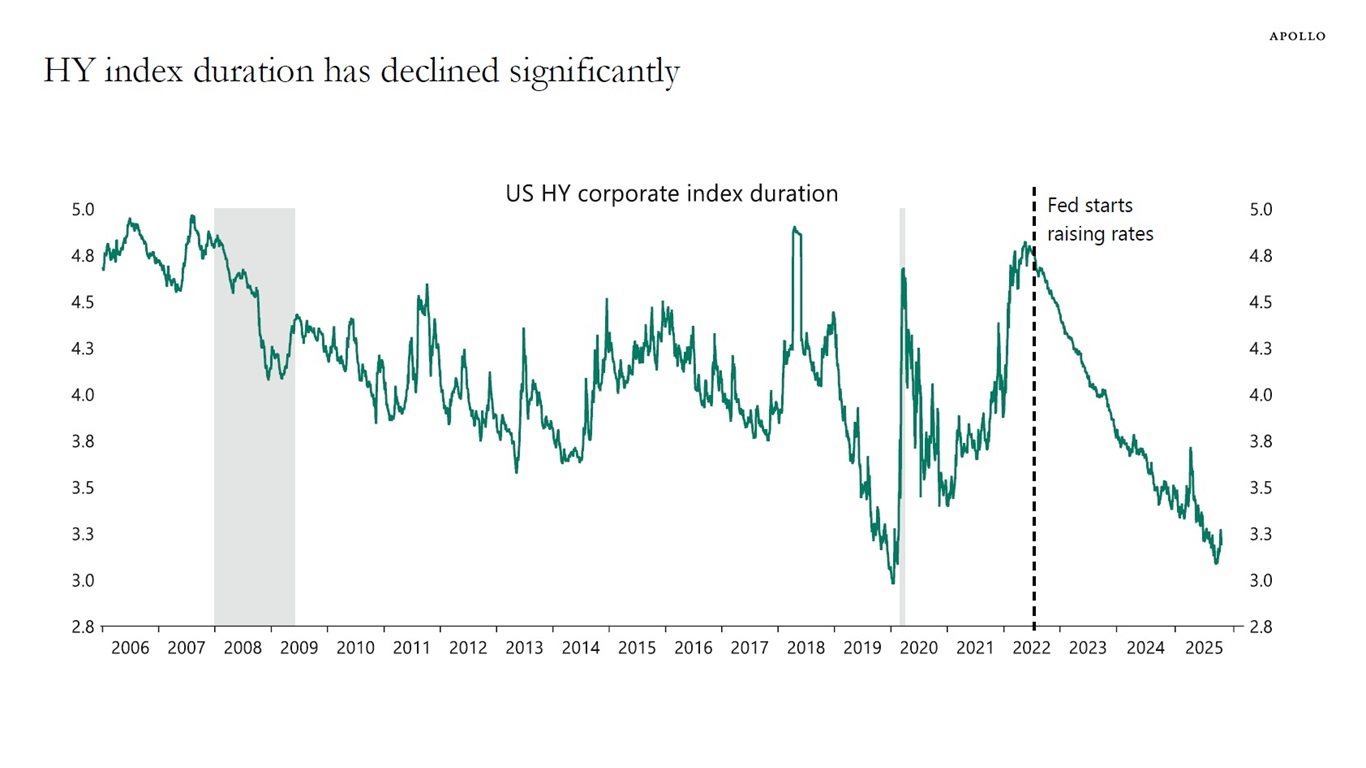
Note: The measure used is modified duration, which measures the expected change in a bond’s price to a 1% change in interest rates. Sources: Bloomberg, Macrobond, Apollo Chief Economist 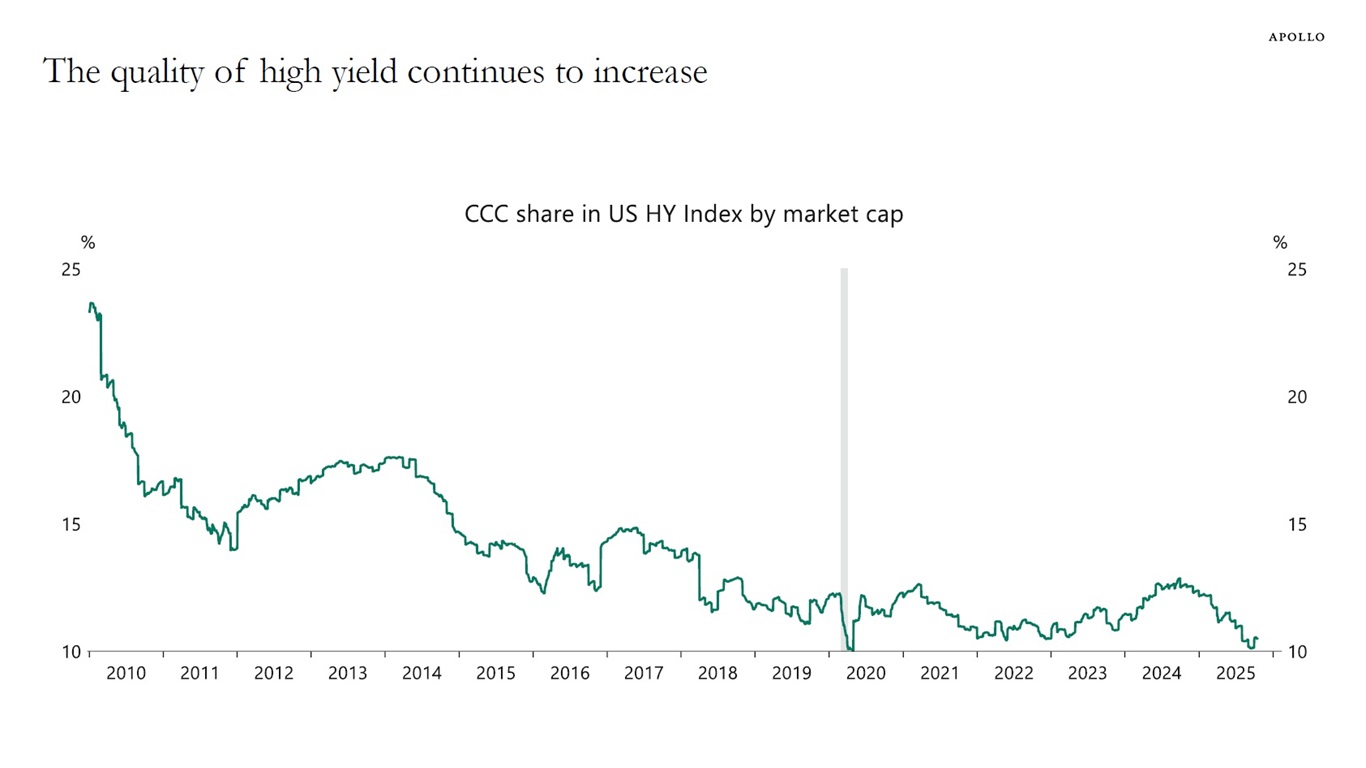
Sources: ICE BofAML, Macrobond, Apollo Chief Economist See important disclaimers at the bottom of the page.
-
Twenty percent of mortgages outstanding have an interest rate above 6%, see chart below.
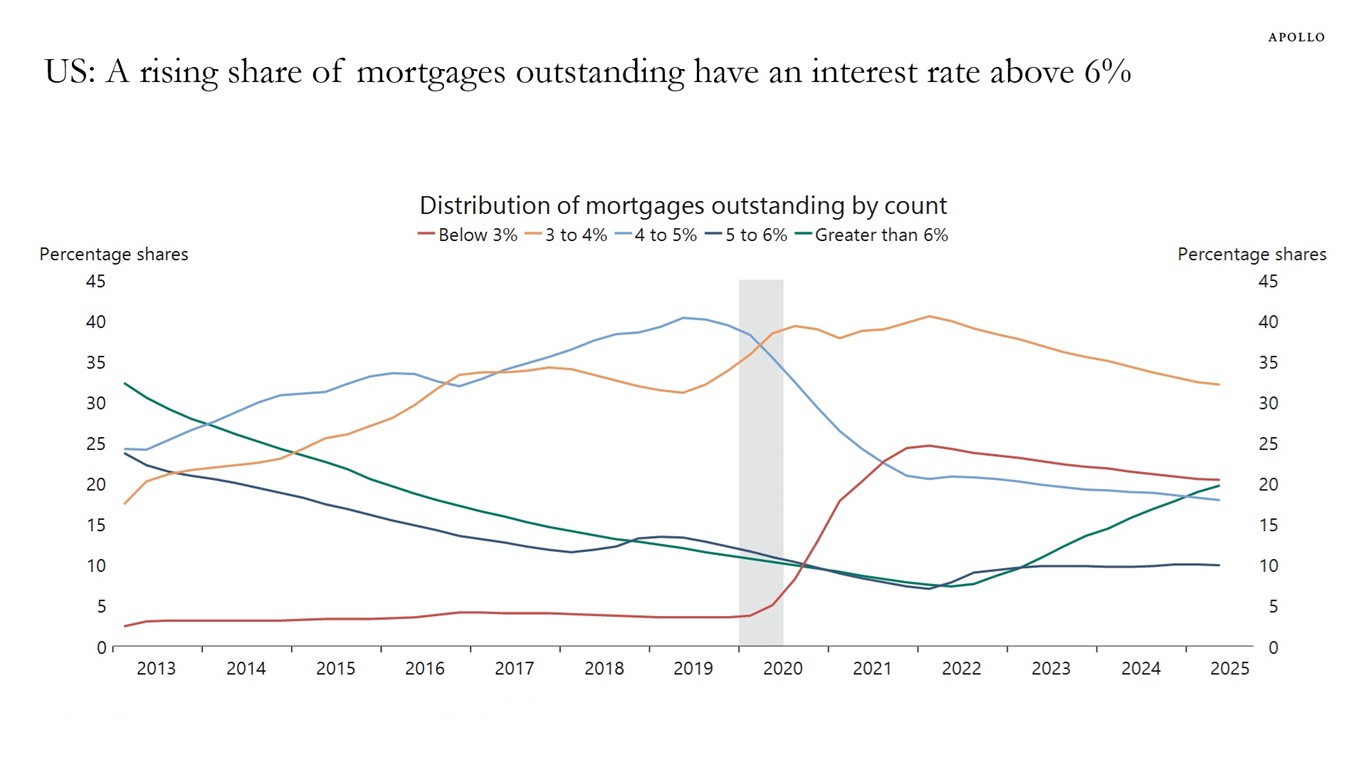
Sources: Federal Housing Finance Agency (FHFA), Macrobond, Apollo Chief Economist See important disclaimers at the bottom of the page.
-
In 2011, the US stock market made up 30% of the global stock market capitalization. Today, the US makes up almost 50%, see chart below. The United States continues to offer exceptional opportunities for investors.
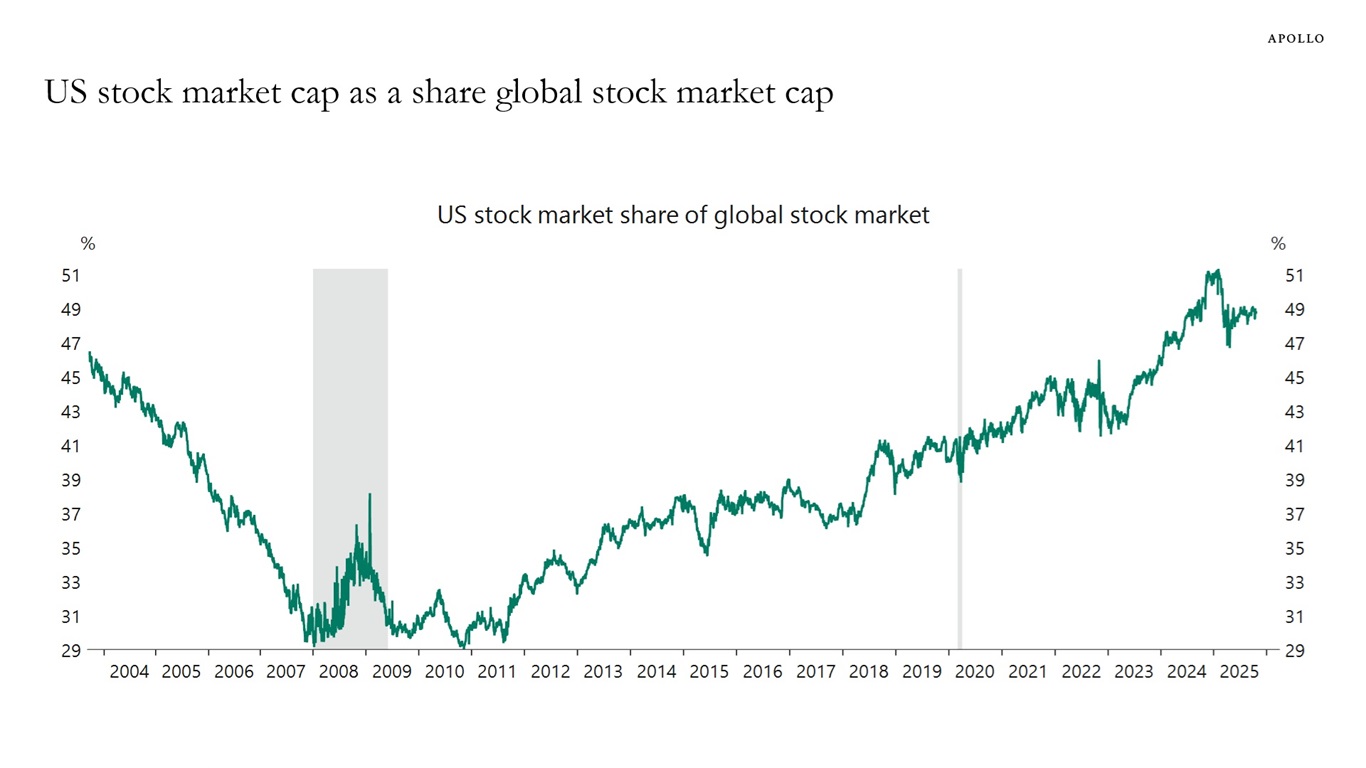
Sources: Bloomberg, Macrobond, Apollo Chief Economist See important disclaimers at the bottom of the page.
-
Normally, when the Fed raises interest rates, capex spending goes down.
Since the Fed raised rates in 2022, this has happened for office but not for data centers because data center financings and the AI boom are ultimately financed by the rise in equity prices of the Magnificent Seven, see the first chart below.
As a result, the transmission mechanism for monetary policy has been broken for data centers, and Fed hikes have not slowed down the AI boom.
In other words, what matters for capex decisions are broader financial conditions and not just the Fed funds rate, see also here. That is the reason why there is basically no growth in corporate capex outside of AI at the moment, see the second chart below.
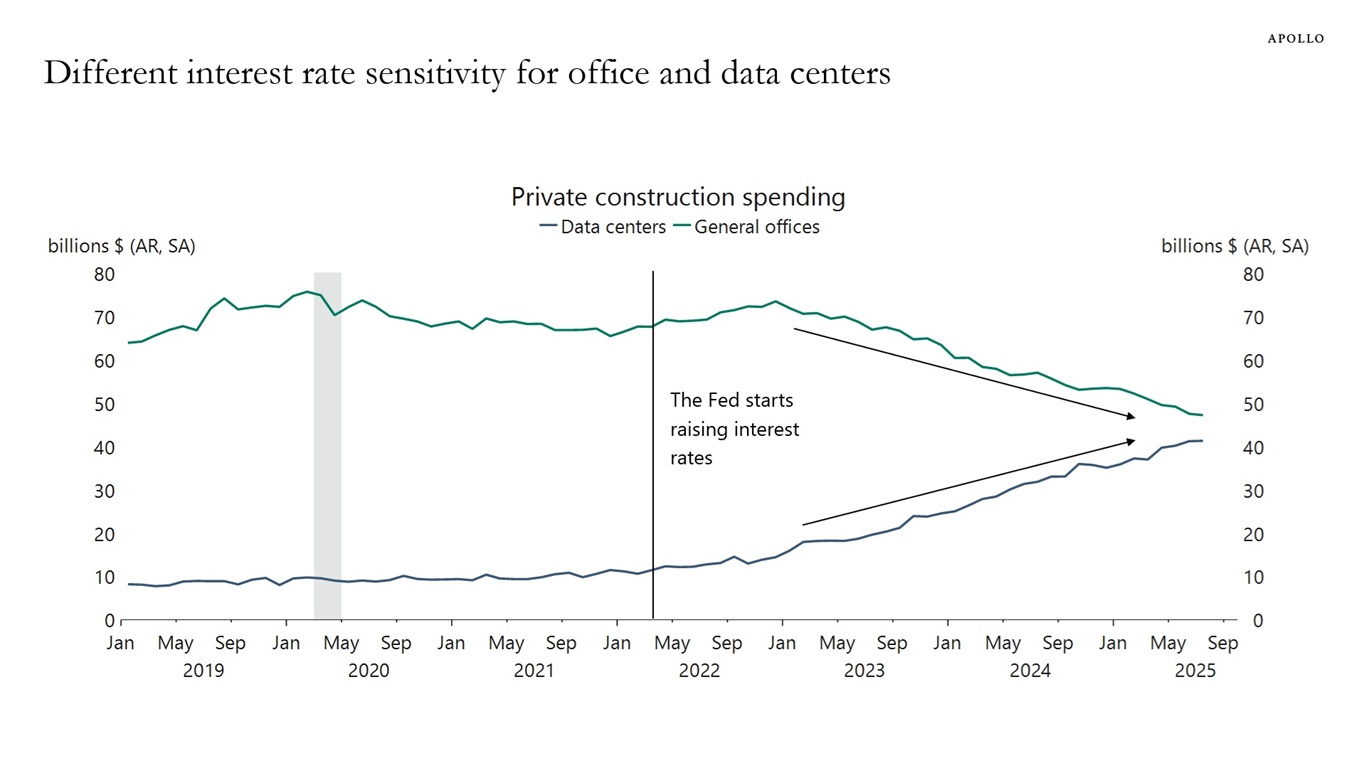
Sources: US Census Bureau, Macrobond, Apollo Chief Economist 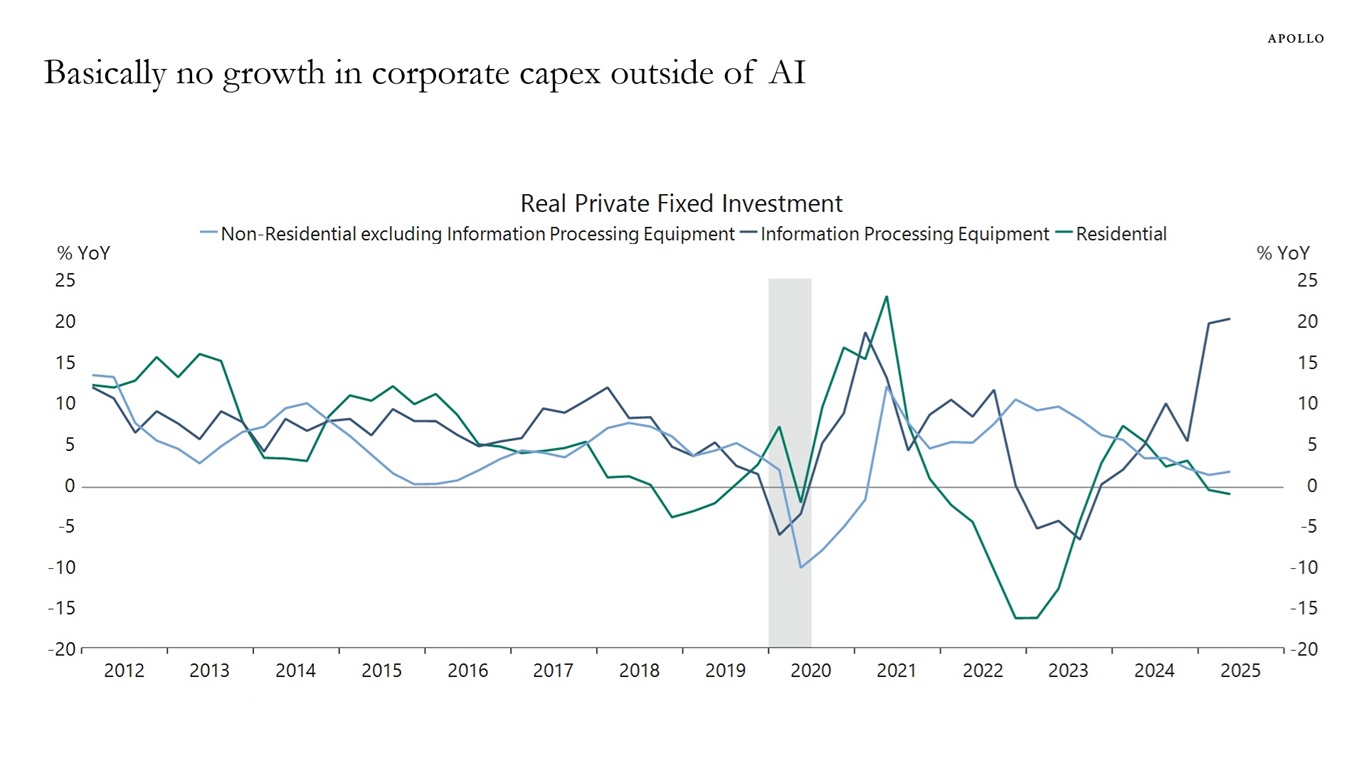
Sources: US Bureau of Economic Analysis (BEA), Macrobond, Apollo Chief Economist See important disclaimers at the bottom of the page.
-
China is playing a key role in the ongoing rise in gold prices because of central bank buying, arbitrage trading, and increased speculative and safe-haven demand among Chinese households, see the first four charts below. The fifth chart shows that higher business uncertainty in the US is also pushing gold prices up.
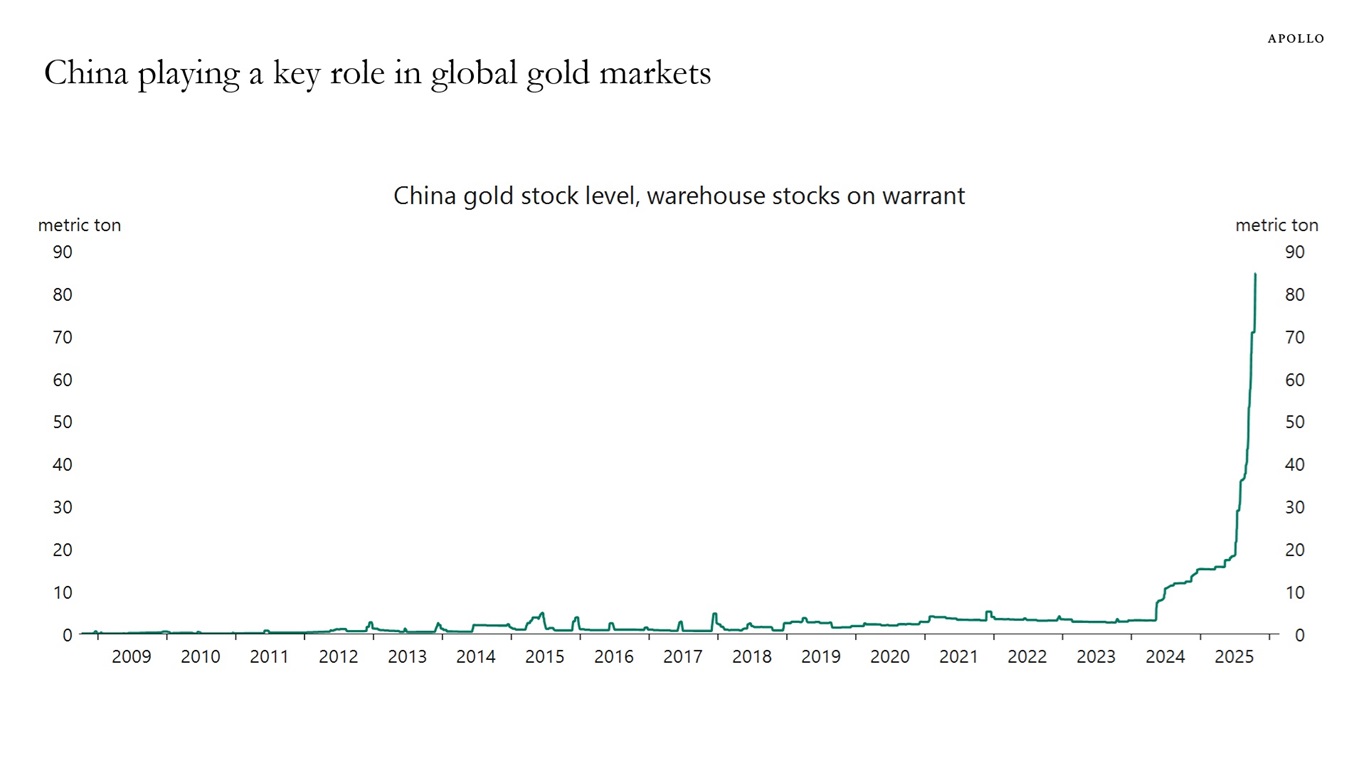
Sources: China Futures Exchange, Macrobond, Apollo Chief Economist 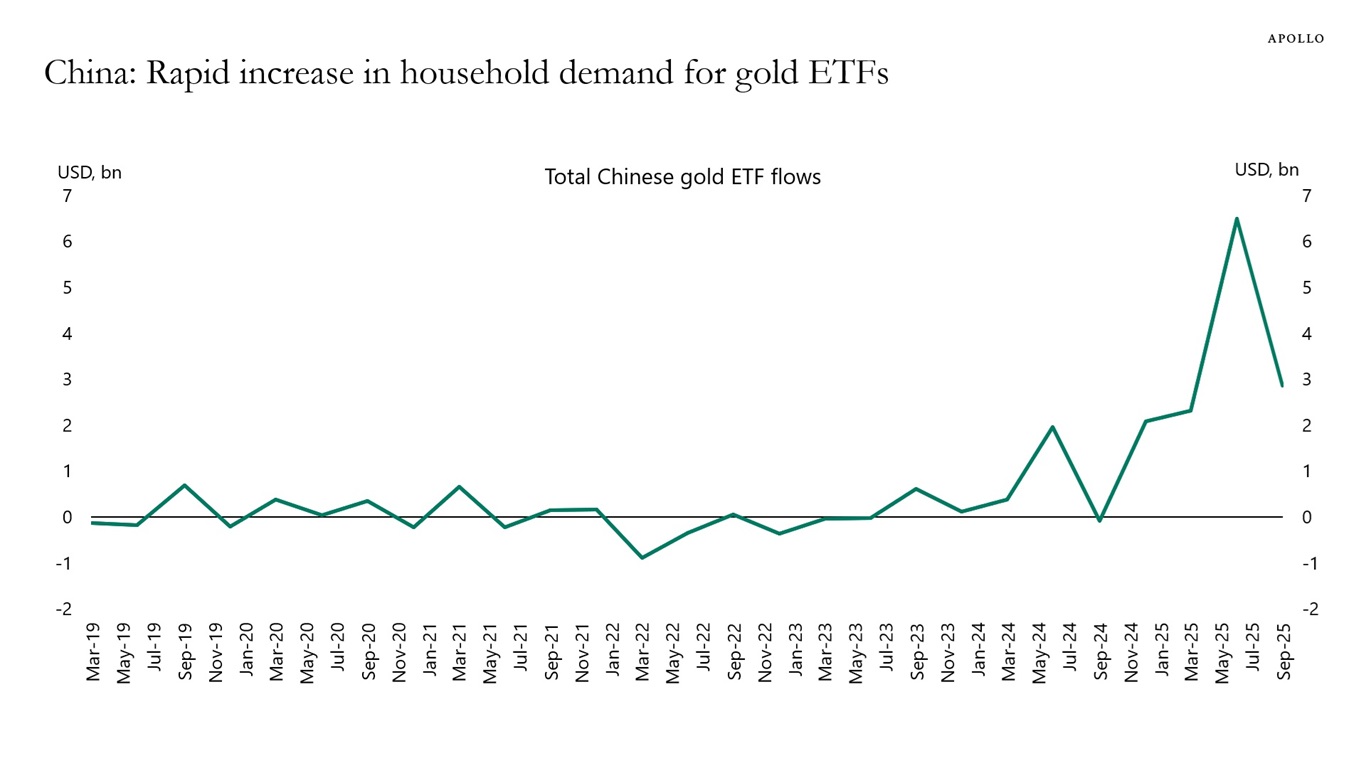
Sources: Bloomberg, Apollo Chief Economist 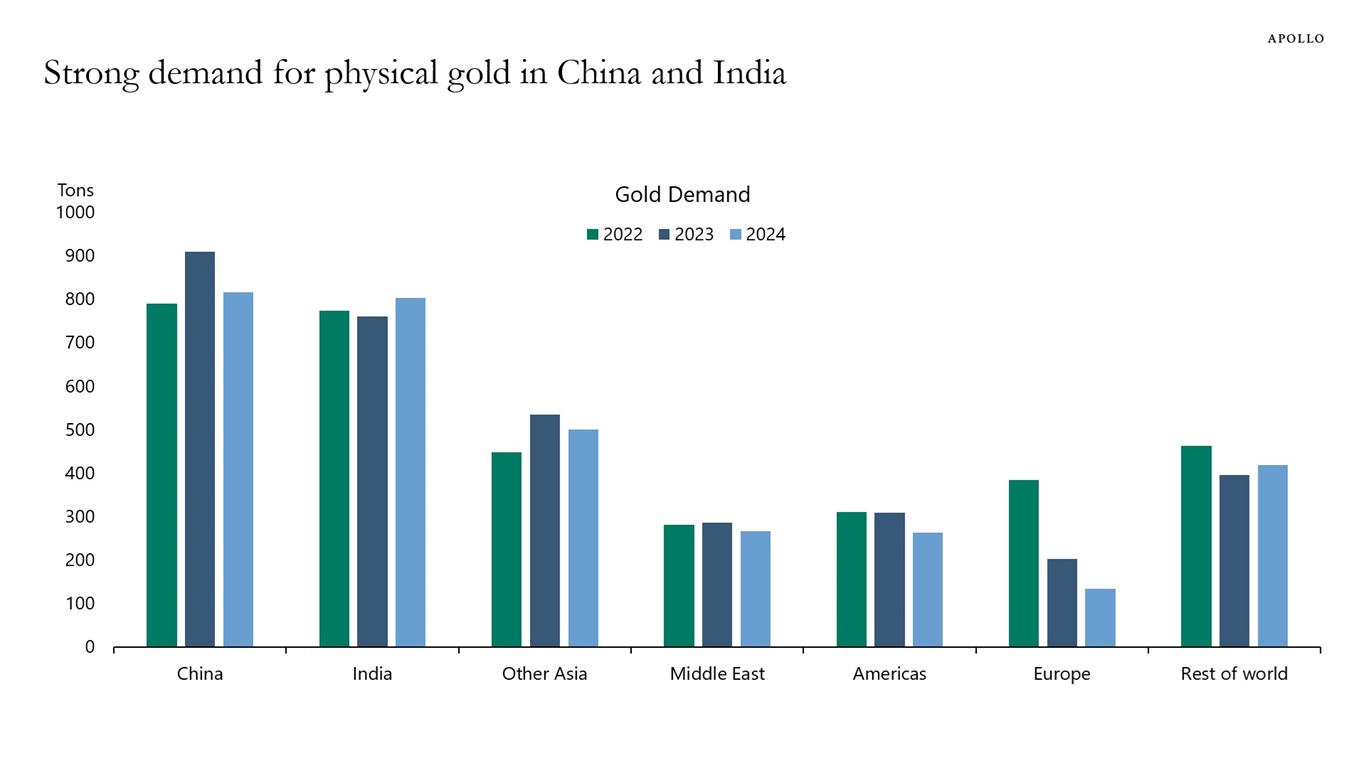
Note: The demand data is for jewelry, bars and coins. Sources: World Gold Council, Apollo Chief Economist 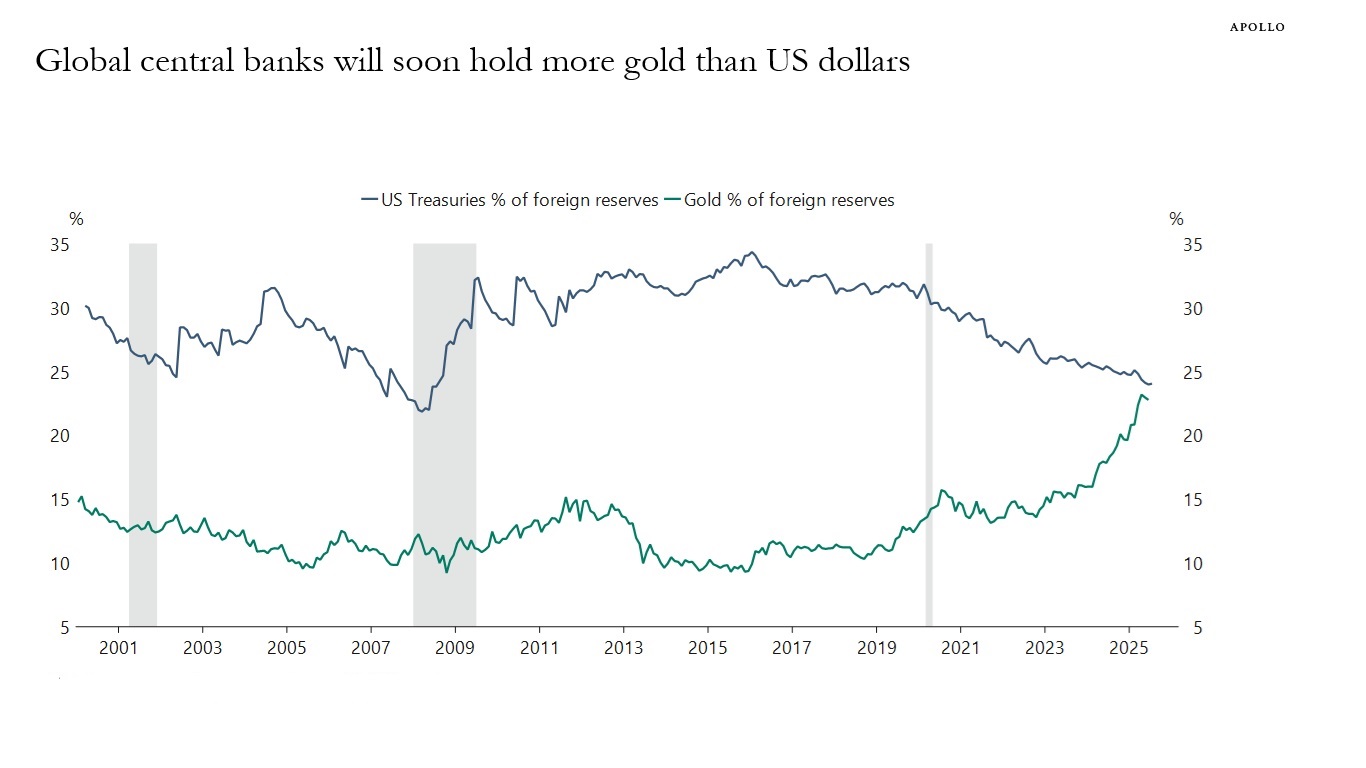
Sources: International Monetary Fund (IMF), Macrobond, Apollo Chief Economist 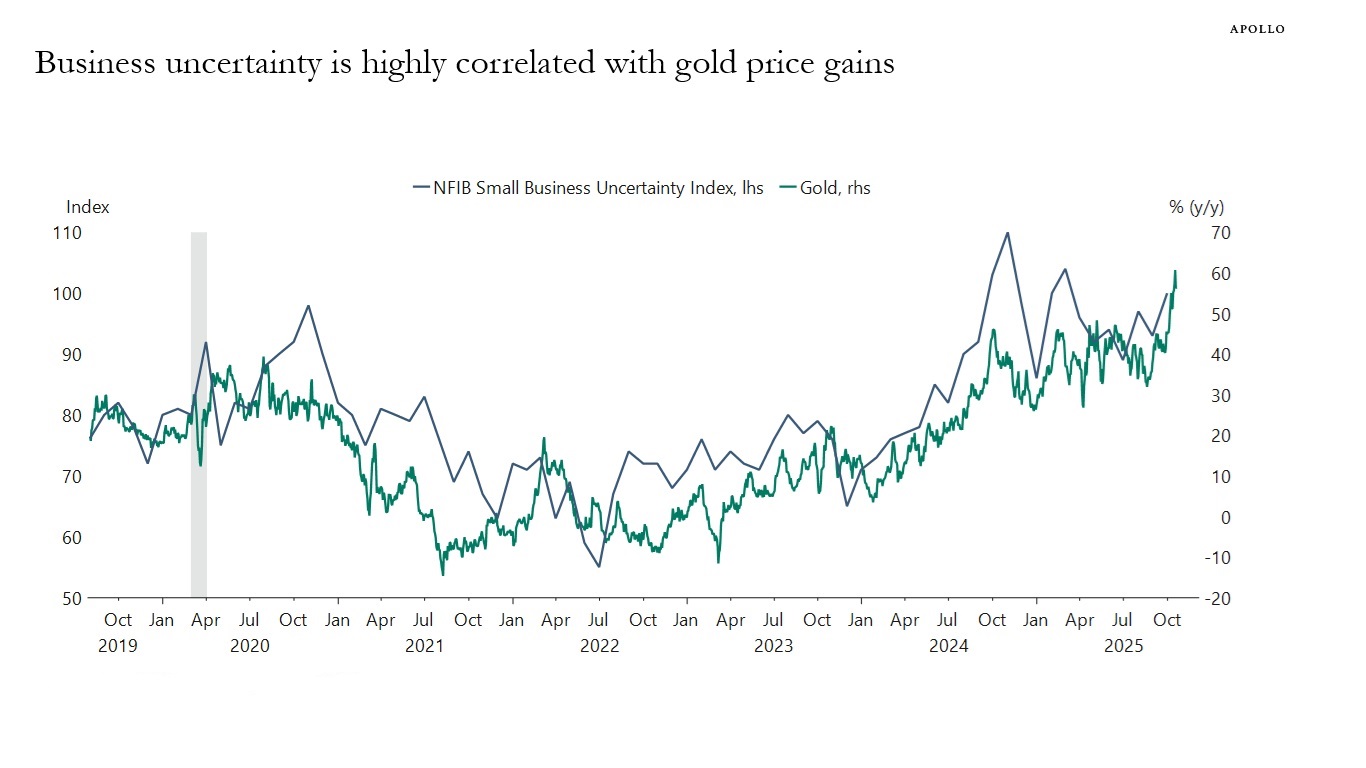
Sources: Bloomberg, Macrobond, Apollo Chief Economist See important disclaimers at the bottom of the page.
-
Something remarkable is going on in the equity market. Stock prices of companies with negative earnings have in recent months outperformed stock prices of companies with positive earnings, see chart below.
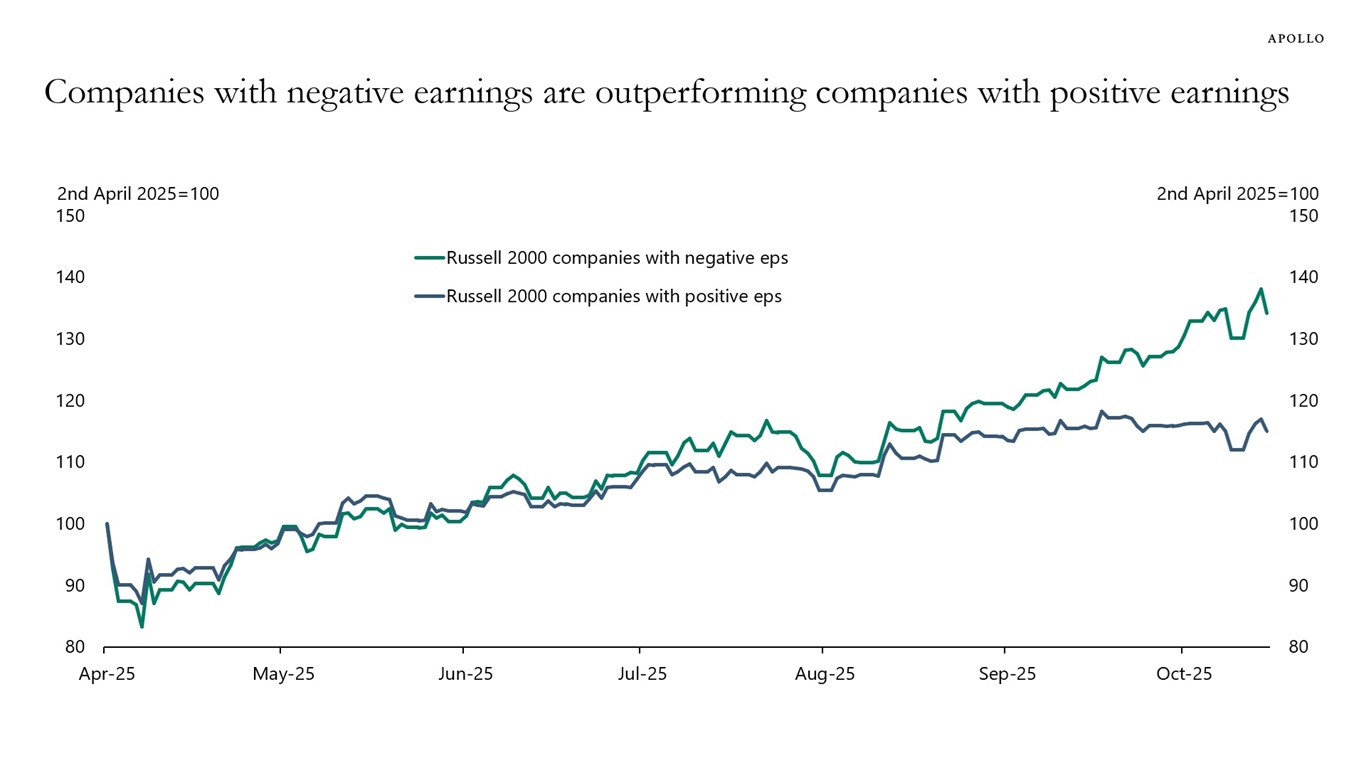
Note: Using Russell 2000 companies as of October 2025 with trailing eps, 1120 companies have positive eps and 806 companies have negative eps. Sources: Bloomberg, Apollo Chief Economist. See important disclaimers at the bottom of the page.
-
Contrary to widespread fears about the economic outlook, key credit indicators are turning more bullish. Default rates for high yield debt and loans have peaked, along with delinquency rates for auto loans and credit cards, see charts below.
Three factors explain why corporate default and consumer delinquency rates are moving lower:
1) Uncertainty related to the trade war is significantly lower than its peak during Liberation Day.
2) The ongoing AI boom is boosting the buildout of data centers and related energy infrastructure. Simultaneously, higher stock prices are supporting consumer spending.
3) Investors are increasingly recognizing that we are in the early stages of an industrial renaissance across sectors like aerospace, defense, manufacturing, biotech and technology/automation.
In summary, while the trade war remains a mild drag on growth, its impact is being more than offset by the tailwinds from the AI boom and the industrial renaissance. Consequently, there is a growing upside risk that economic growth will reaccelerate over the coming quarters.
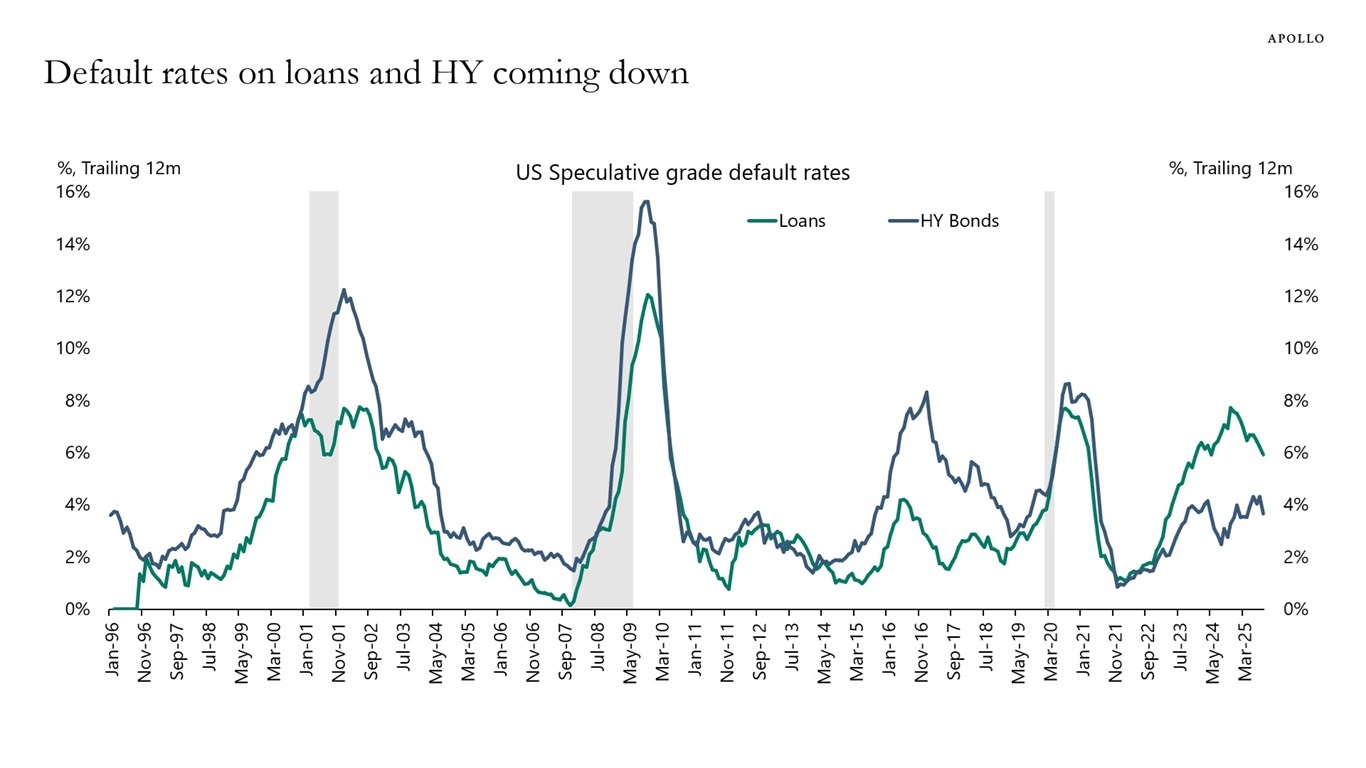
Sources: Moody’s Analytics, Apollo Chief Economist 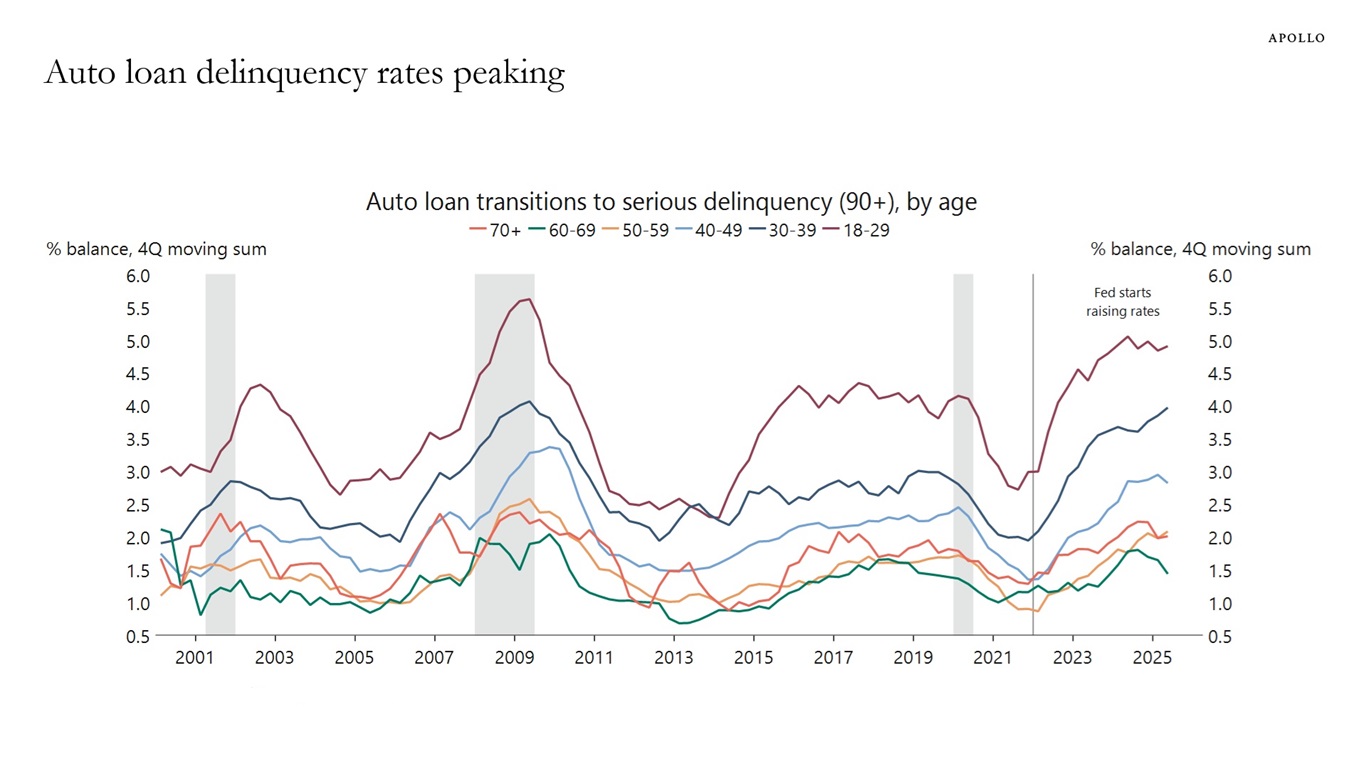
Sources: Federal Reserve Bank of New York, Macrobond, Apollo Chief Economist 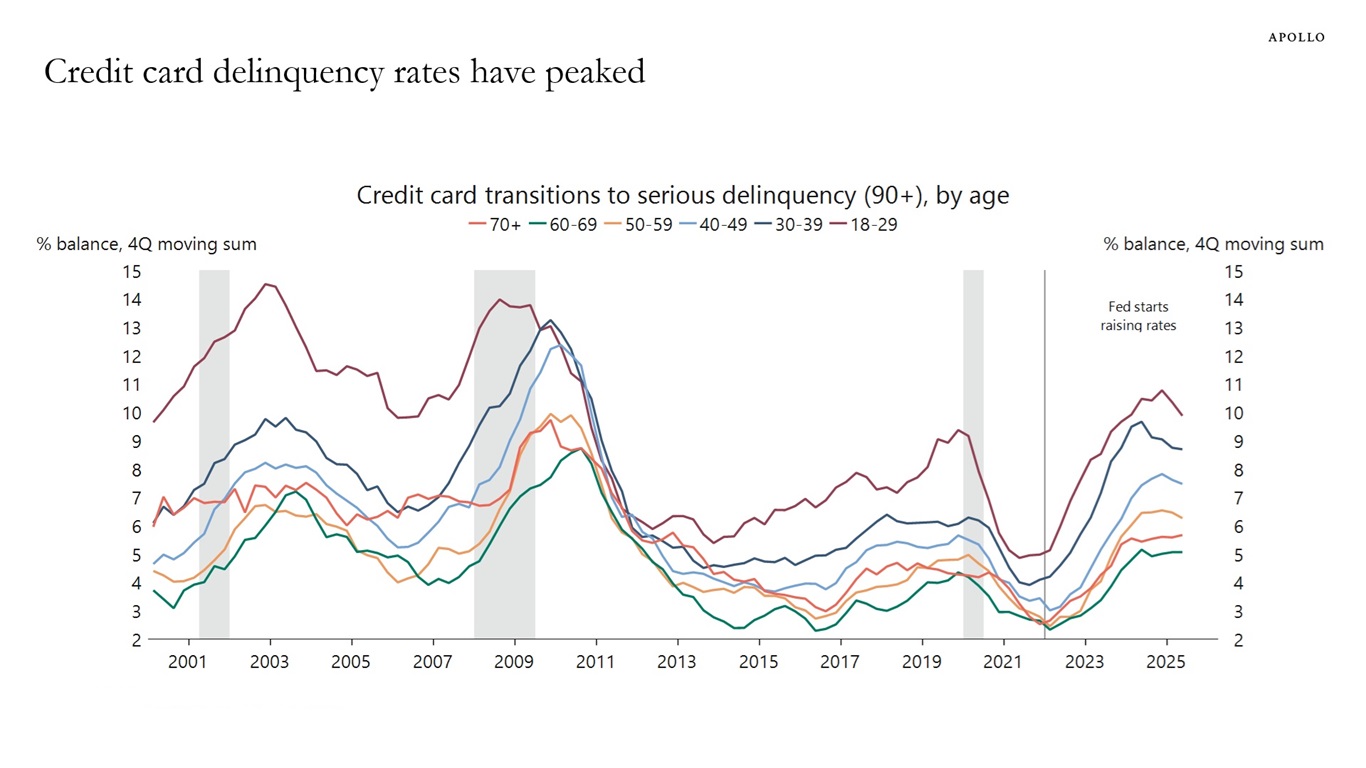
Sources: Federal Reserve Bank of New York, Macrobond, Apollo Chief Economist See important disclaimers at the bottom of the page.
-
Investing in companies with no earnings, no revenue or no cash flow is risky in both public and private markets.
Put differently, you can invest in investment grade and high yield credit in both public and private markets.
The bottom line is that investors are starting to appreciate that in public markets there are safe and risky investments, and in private markets there are safe and risky investments, see chart below.
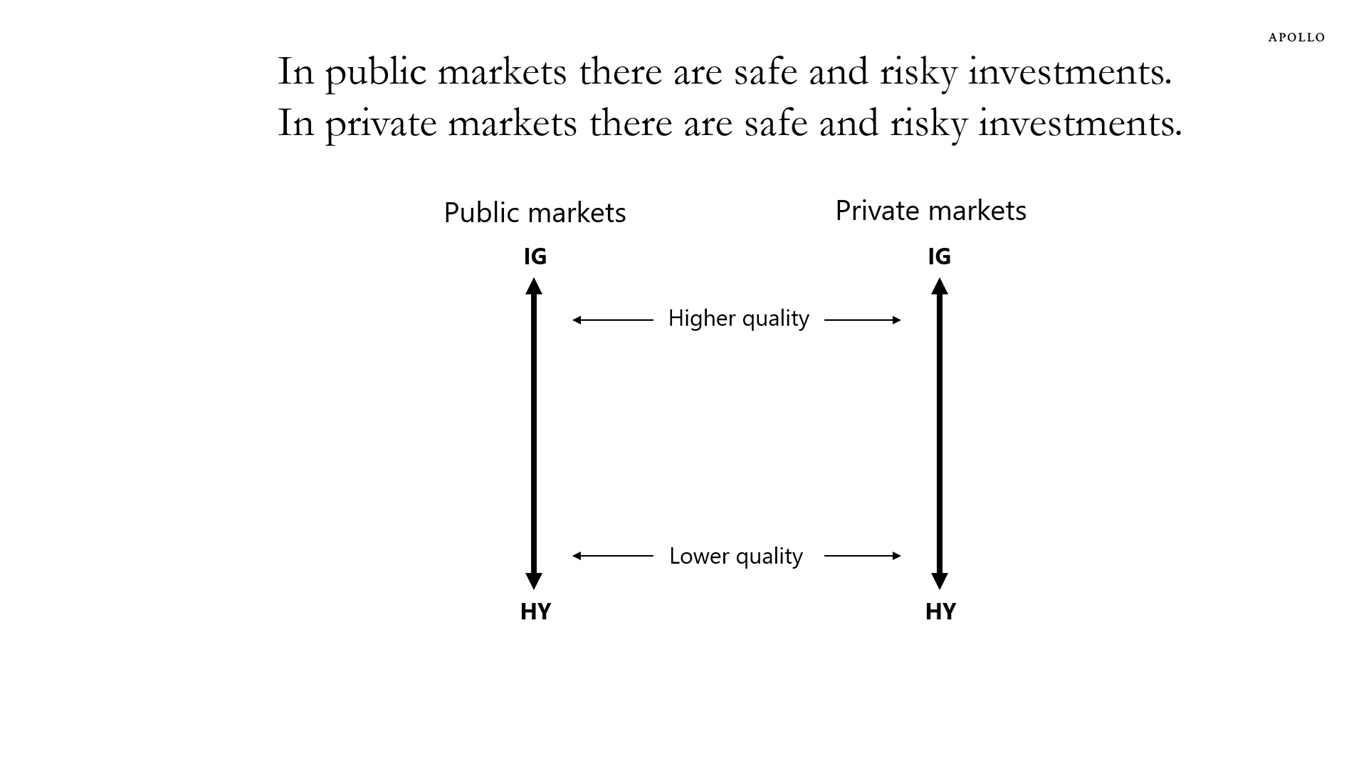
Source: Apollo Chief Economist See important disclaimers at the bottom of the page.

This presentation may not be distributed, transmitted or otherwise communicated to others in whole or in part without the express consent of Apollo Global Management, Inc. (together with its subsidiaries, “Apollo”).
Apollo makes no representation or warranty, expressed or implied, with respect to the accuracy, reasonableness, or completeness of any of the statements made during this presentation, including, but not limited to, statements obtained from third parties. Opinions, estimates and projections constitute the current judgment of the speaker as of the date indicated. They do not necessarily reflect the views and opinions of Apollo and are subject to change at any time without notice. Apollo does not have any responsibility to update this presentation to account for such changes. There can be no assurance that any trends discussed during this presentation will continue.
Statements made throughout this presentation are not intended to provide, and should not be relied upon for, accounting, legal or tax advice and do not constitute an investment recommendation or investment advice. Investors should make an independent investigation of the information discussed during this presentation, including consulting their tax, legal, accounting or other advisors about such information. Apollo does not act for you and is not responsible for providing you with the protections afforded to its clients. This presentation does not constitute an offer to sell, or the solicitation of an offer to buy, any security, product or service, including interest in any investment product or fund or account managed or advised by Apollo.
Certain statements made throughout this presentation may be “forward-looking” in nature. Due to various risks and uncertainties, actual events or results may differ materially from those reflected or contemplated in such forward-looking information. As such, undue reliance should not be placed on such statements. Forward-looking statements may be identified by the use of terminology including, but not limited to, “may”, “will”, “should”, “expect”, “anticipate”, “target”, “project”, “estimate”, “intend”, “continue” or “believe” or the negatives thereof or other variations thereon or comparable terminology.