


The Daily Spark is moving to Apollo.com— read the latest from Torsten Slok here.
Want it delivered daily to your inbox?
-
Apartment rents in Manhattan have started to increase again, with the median rent reaching a record high of $4,471 in February, see chart below.
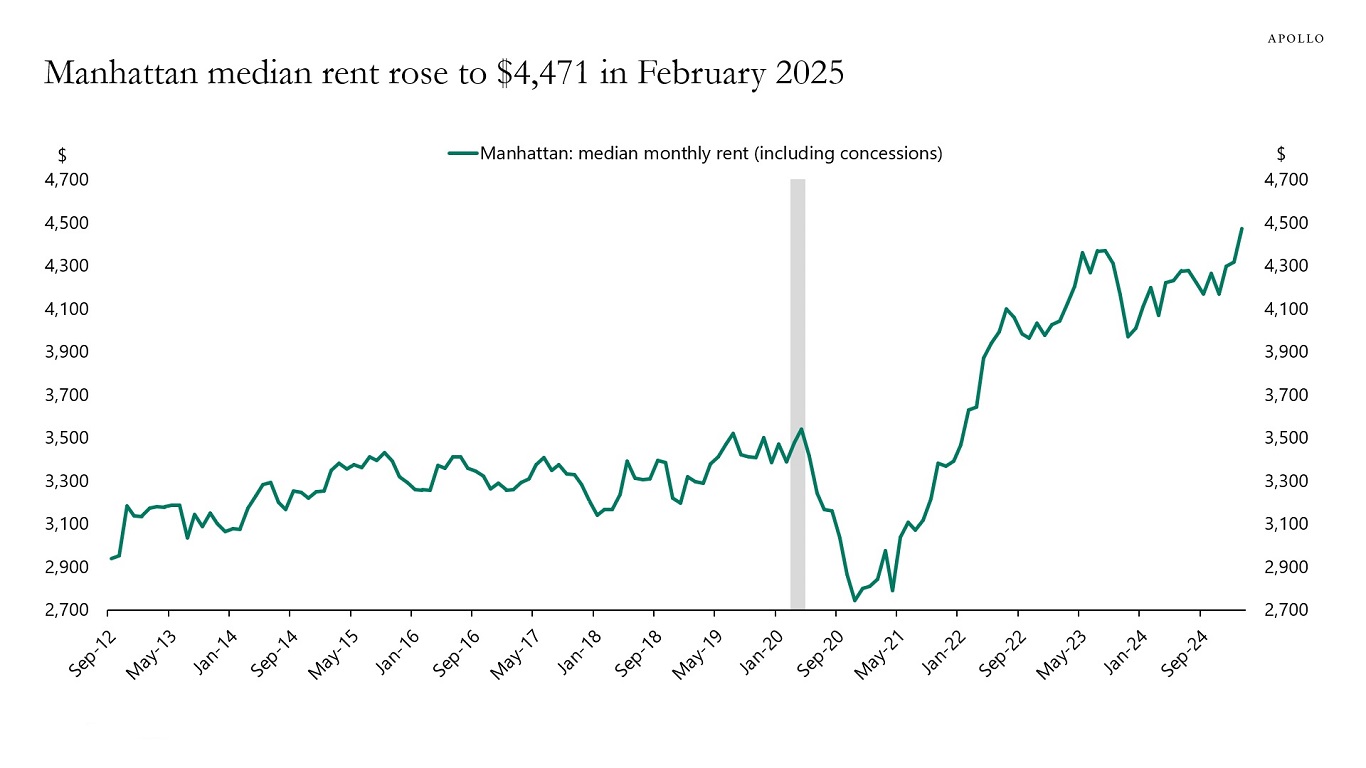
Sources: Elliman, Apollo Chief Economist See important disclaimers at the bottom of the page.
-
Data from the Fed shows that households’ ability to come up with $2,000 for an emergency expense within the next month is at the lowest level since the survey started in Q4 of 2015. Taking into account that the CPI level today is 35% higher than in 2015, the situation is even worse.
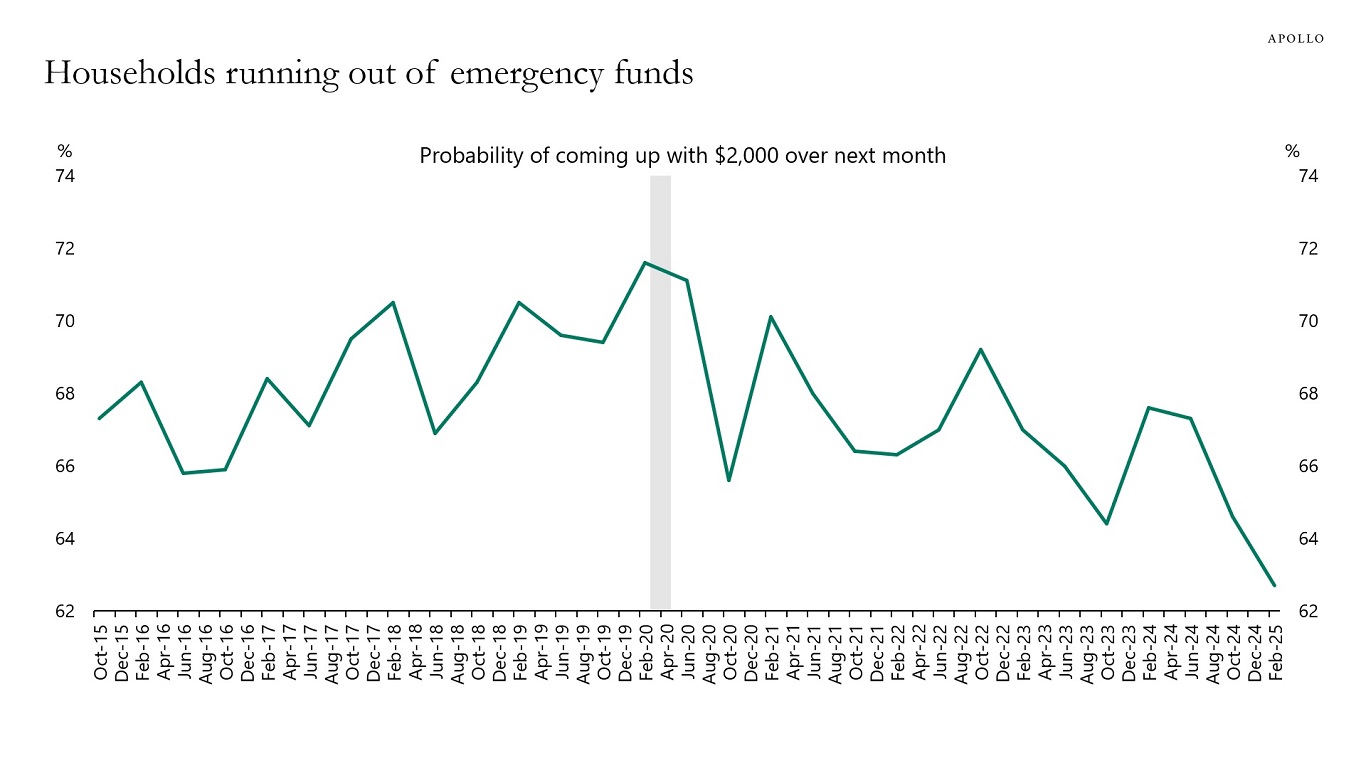
Sources: SCE, Federal Reserve Bank of New York, Haver Analytics, Apollo Chief Economist See important disclaimers at the bottom of the page.
-
There have been significant inflows from abroad into US equity markets, see the first chart below, and foreign investors are now significantly overweight US equities, see the second chart below. Combined with the dollar’s decline and the ongoing overvaluation of the Magnificent 7, see the third chart, the downside risks to the S&P 500 as a result of foreigners selling are significant.
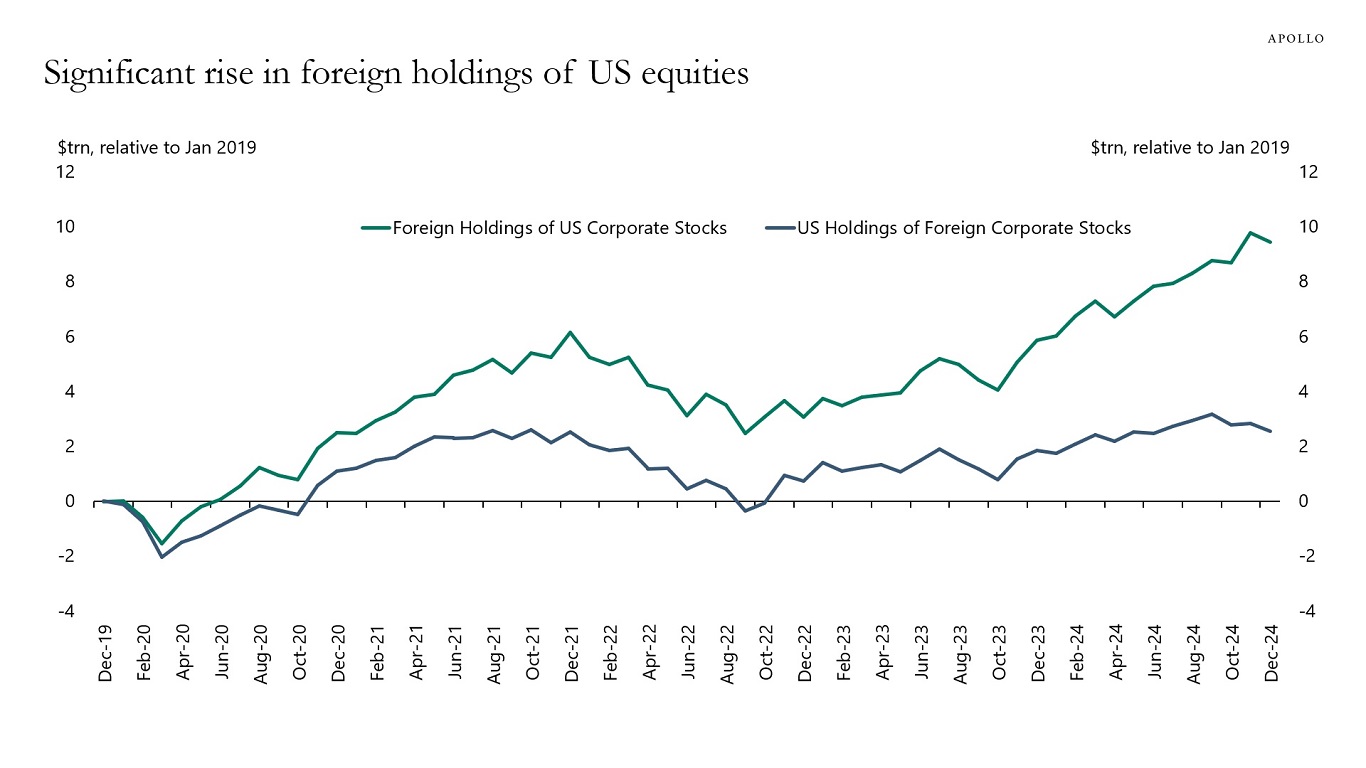
Sources: US Treasury, Haver Analytics, Apollo Chief Economist 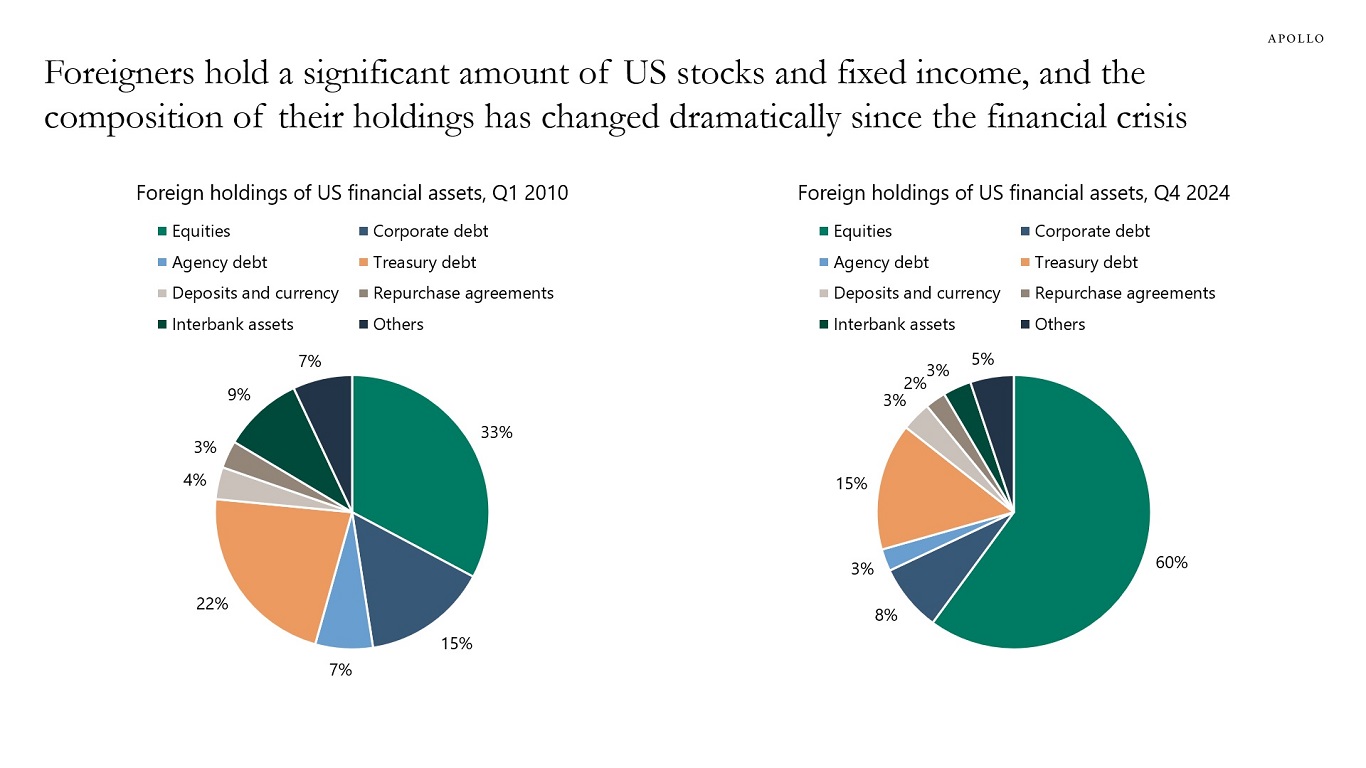
Note: Figures may not sum to 100% due to rounding. Sources: Federal Reserve Board, Haver Analytics, Apollo Chief Economist 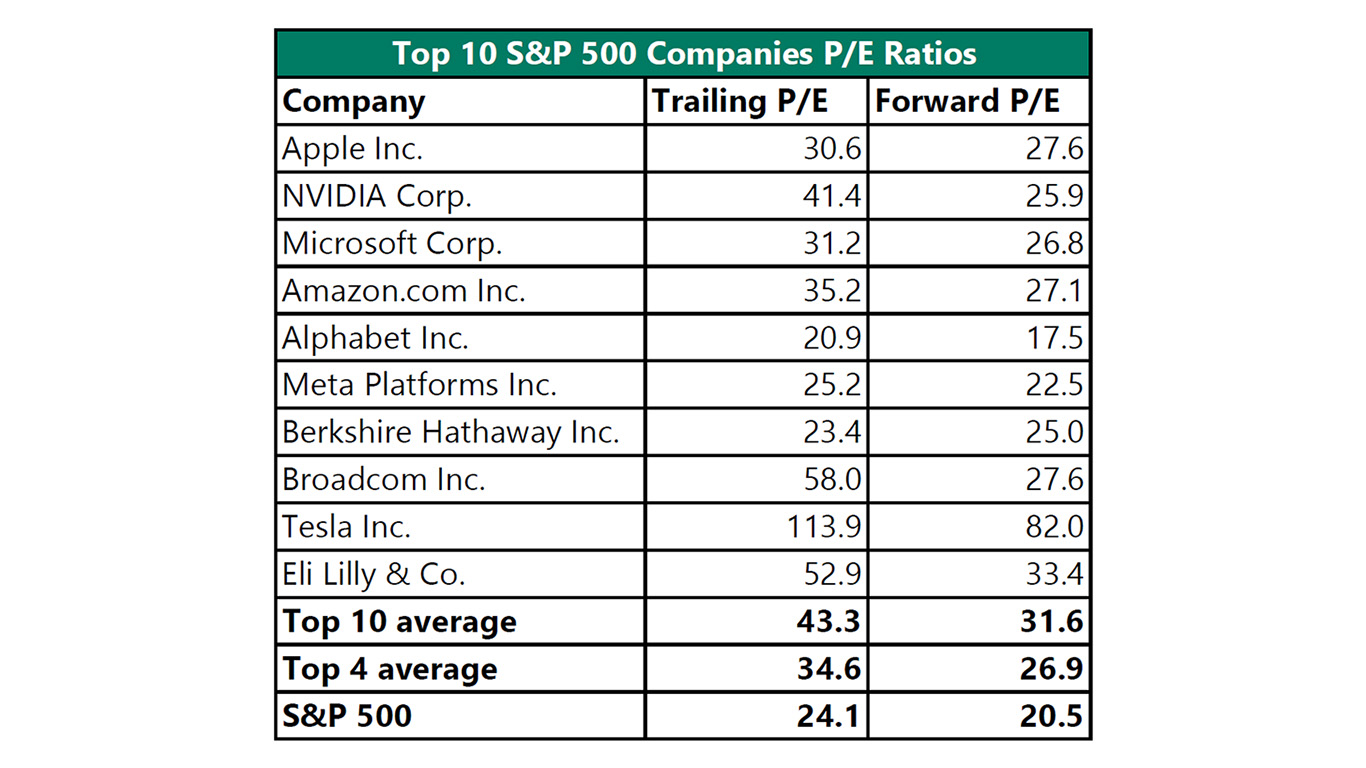
Note: The Magnificent 7 consists of Alphabet, Amazon, Apple, Meta Platforms, Microsoft, NVIDIA, and Tesla. Sources: Bloomberg, Apollo Chief Economist See important disclaimers at the bottom of the page.
-
In 2023, the US had the lowest tariff levels in the world, lower than the European Union, Canada, Mexico, and China, see the first two charts below.
The US also has fewer non-tariff barriers than China, Mexico, Canada, and many European countries, see the third chart below.
When some countries have lower barriers to trade, the gains from trade are not distributed evenly, and the US is currently investigating tariffs and non-tariff barriers with individual countries.
The bottom line is that the purpose of the trade war is to create a more level playing field so that the benefits from trade are more evenly distributed, including to the US manufacturing sector.
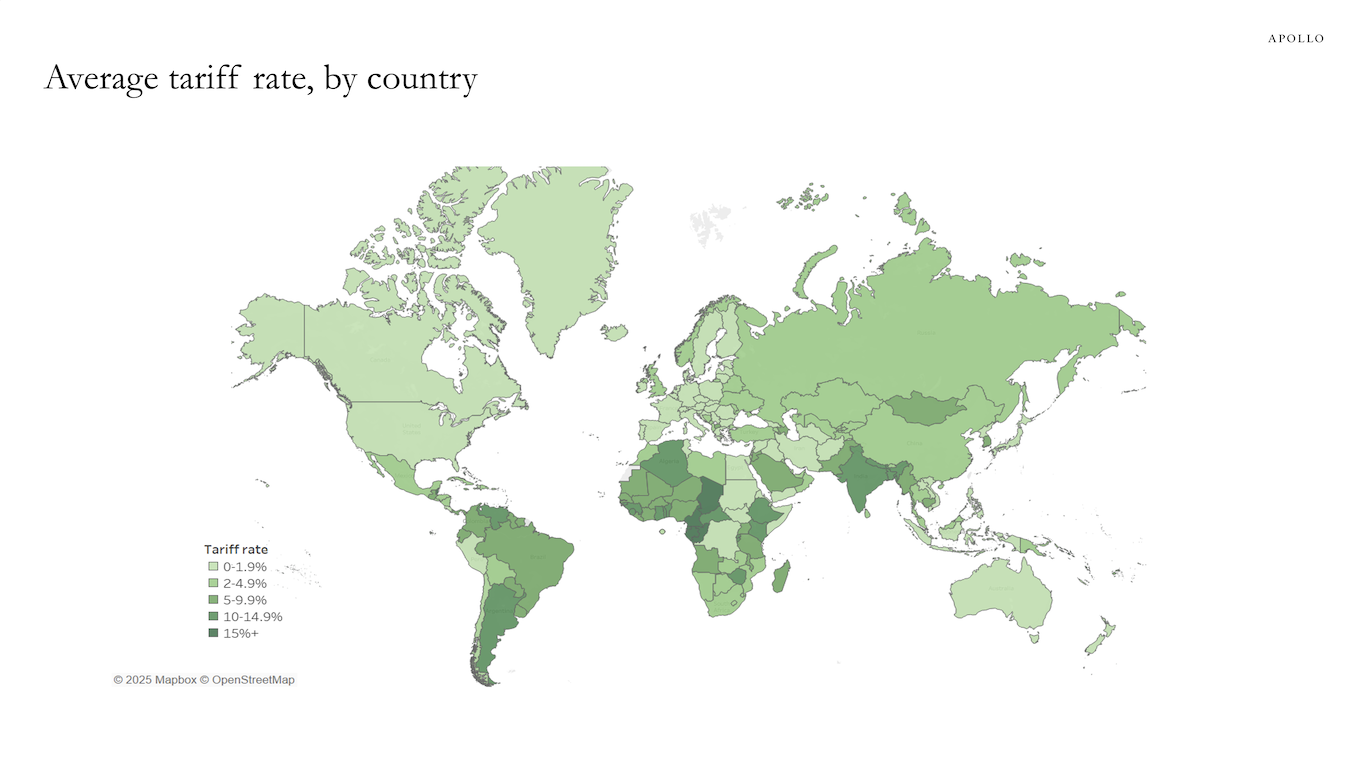
Data as of 2022. Sources: World Bank, Apollo Chief Economist 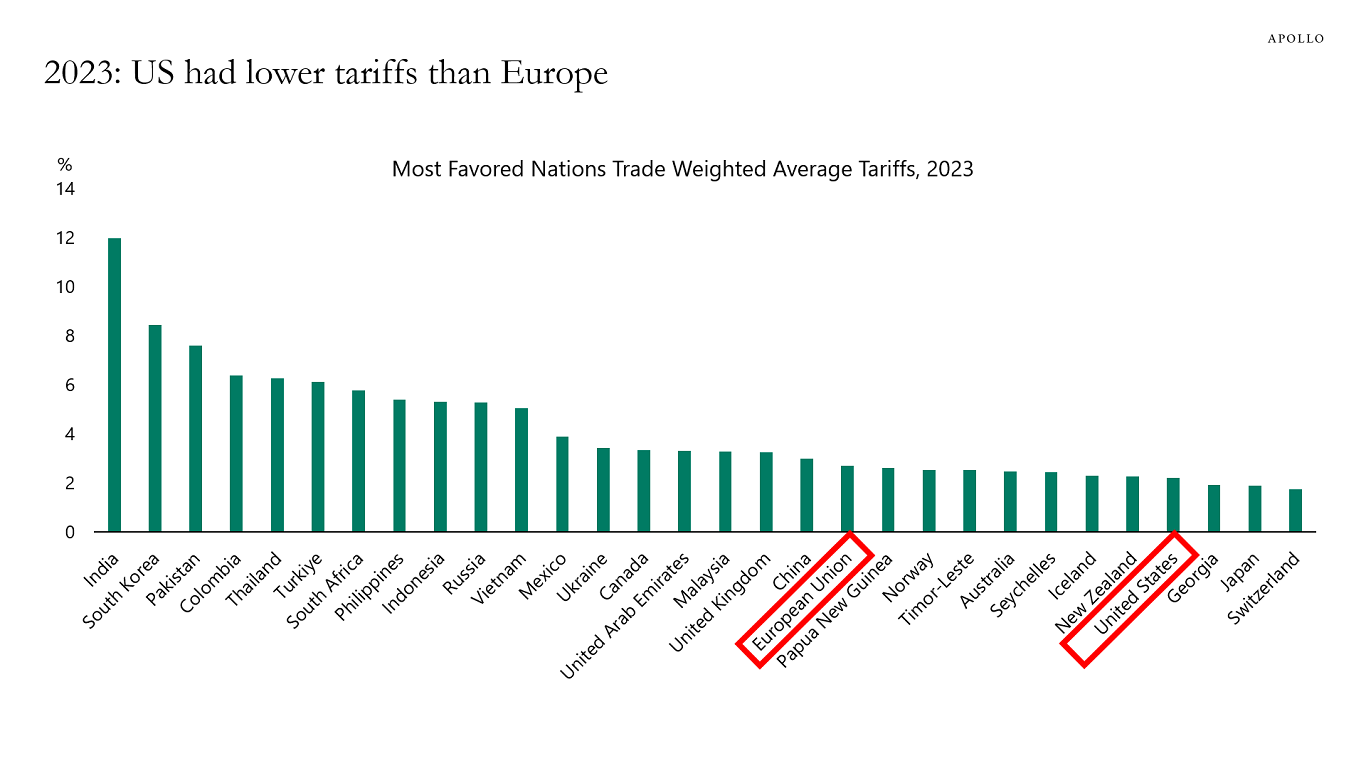
Sources: WTO, Haver Analytics, Apollo Chief Economist 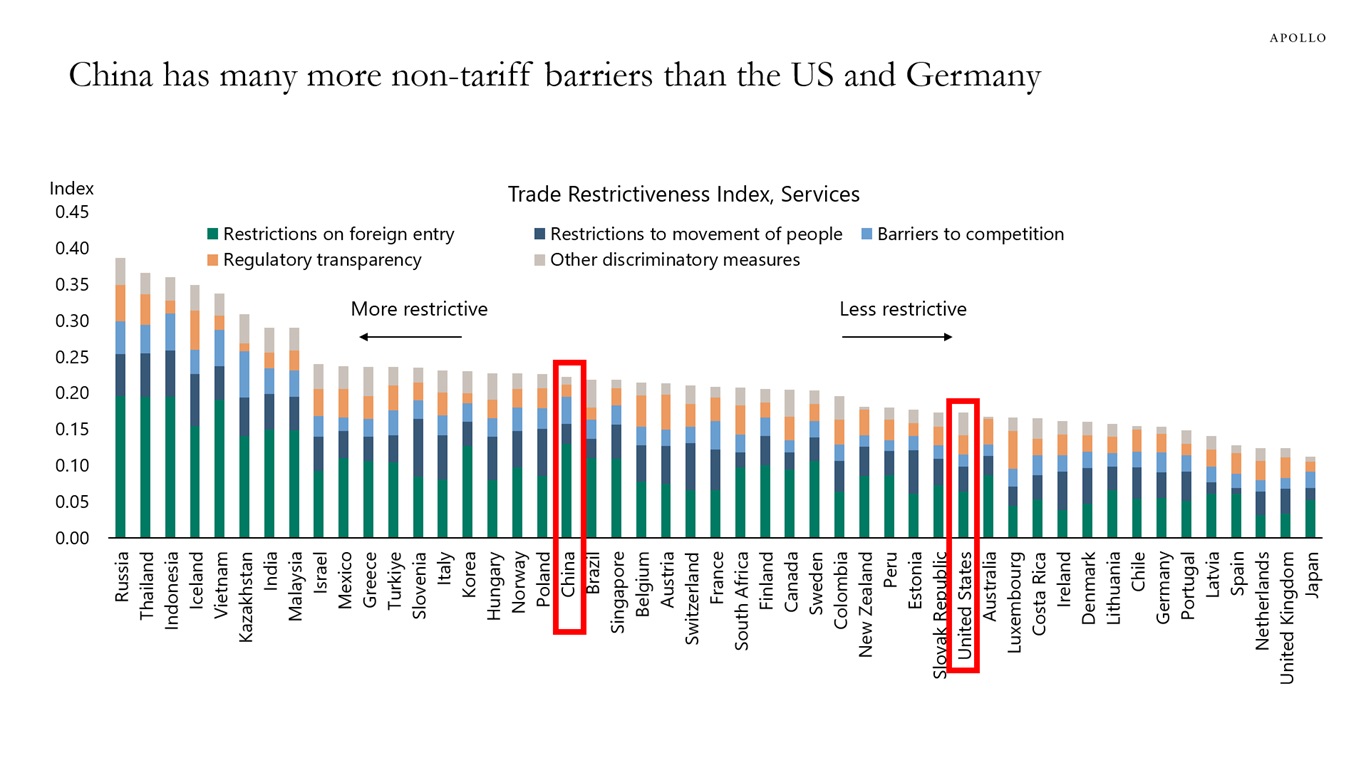
Data as of 2024. Sources: OECD, Apollo Chief Economist See important disclaimers at the bottom of the page.
-
Household surveys, entry swipes, and location data show that work from home has become a new permanent feature of the labor market, with all indicators moving sideways since 2023, see charts below.
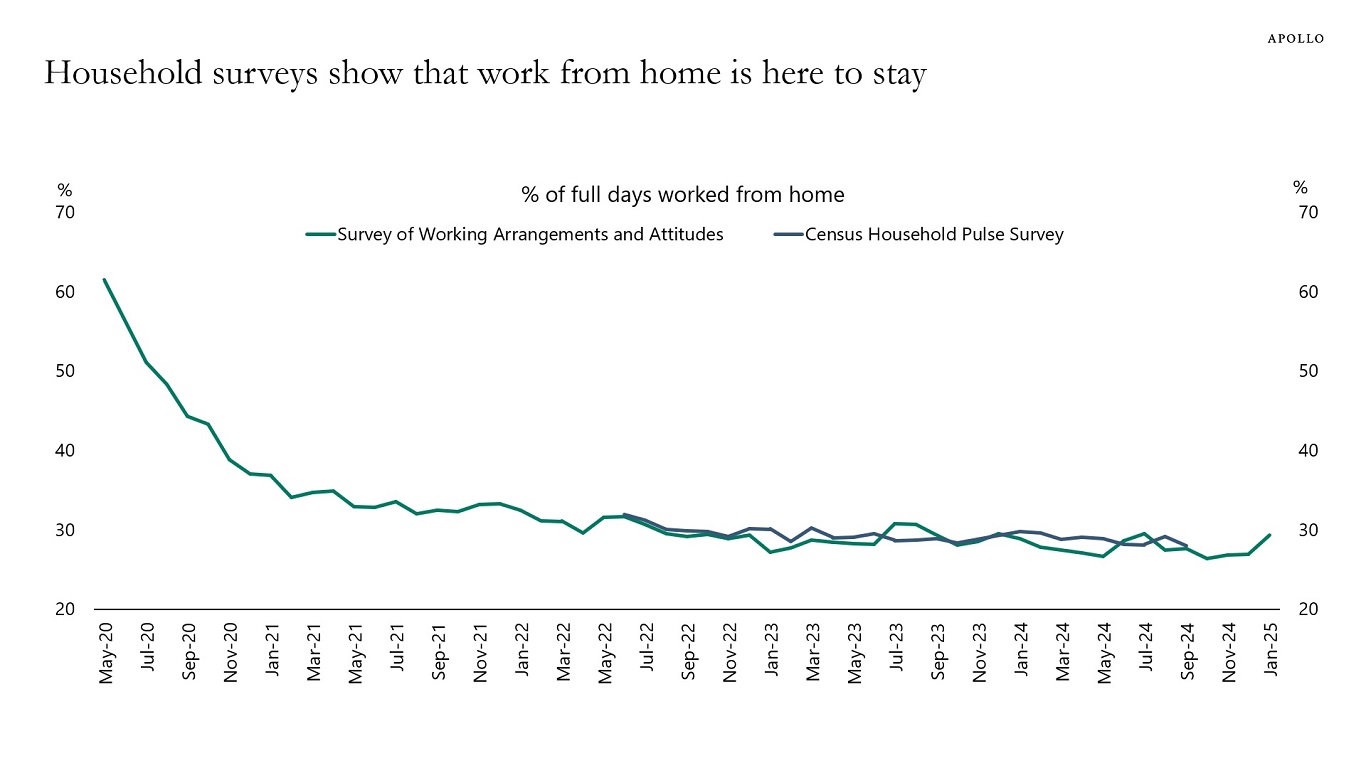
Source: US Census Bureau; WFH Research; Barrero, Jose Maria, Nicholas Bloom, and Steven J. Davis, 2021 – “Why working from home will stick,” National Bureau of Economic Research Working Paper 28731 (WFH Research | Survey of Working Arrangements and Attitudes); Apollo Chief Economist 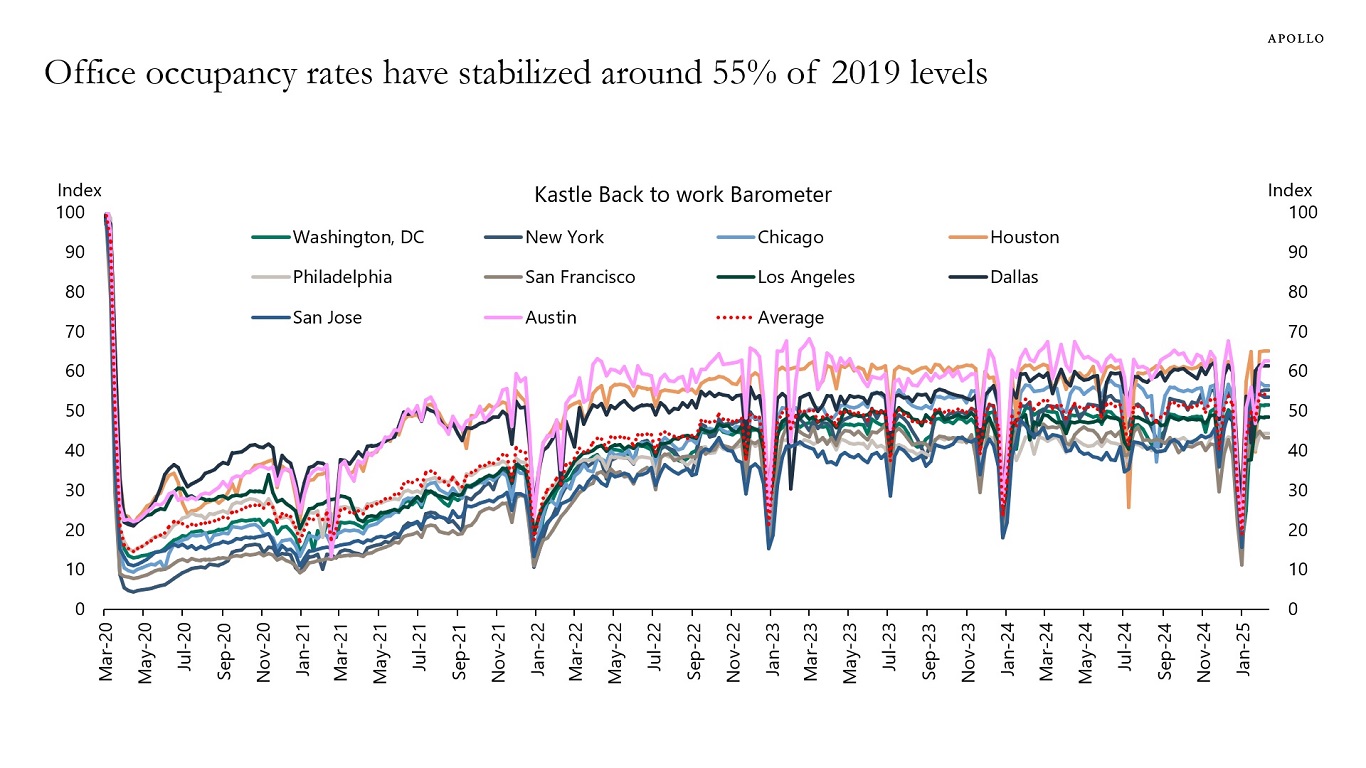
Note: Kastle Systems Back-to-Work Barometer is a weekly report that tracks office occupancy rates across 10 major US cities by analyzing aggregated and anonymized building access data. Source: Kastle Systems, Apollo Chief Economist 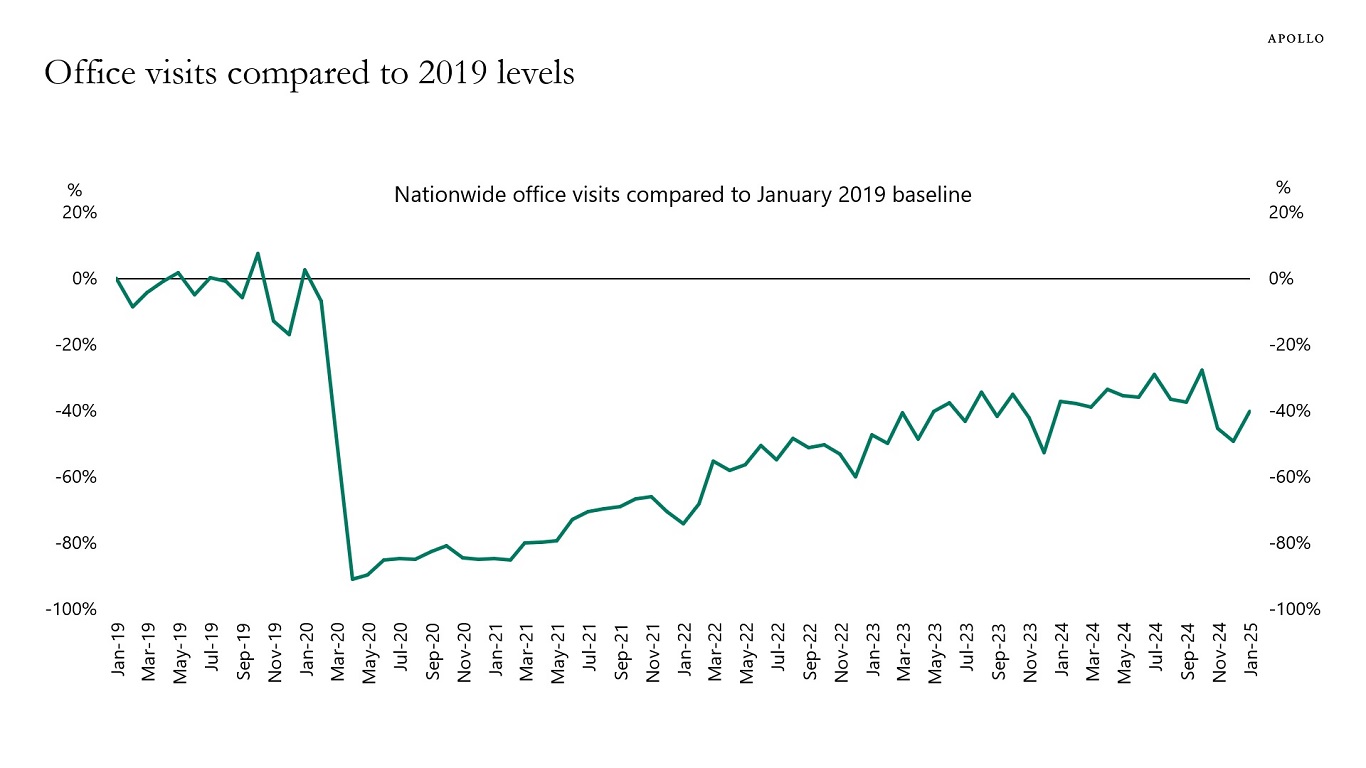
Note: The office building index analyzes foot traffic data from over 700 office buildings across the country. It only includes commercial office buildings and commercial office buildings with retail offerings on the first floor. It does not include mixed-use buildings that are both residential and commercial. Source: Placer.ai Blog Location Intelligence & Foot Traffic Blog, Apollo Chief Economist See important disclaimers at the bottom of the page.
-
The March survey of consumer sentiment from the University of Michigan shows the following:
- Consumer sentiment is declining rapidly both for households making more than $100,000 and less than $100,000 (see the first chart).
- Consumer worries about losing their jobs are at levels normally seen during recessions (see the second chart).
- A record-high share of consumers think business conditions are worsening (see the third chart).
- Households’ income expectations are declining (see the fourth chart).
- Inflation expectations are rising at an unprecedented speed (see the fifth chart).
The bottom line is that consumer sentiment is deteriorating at an alarming rate.
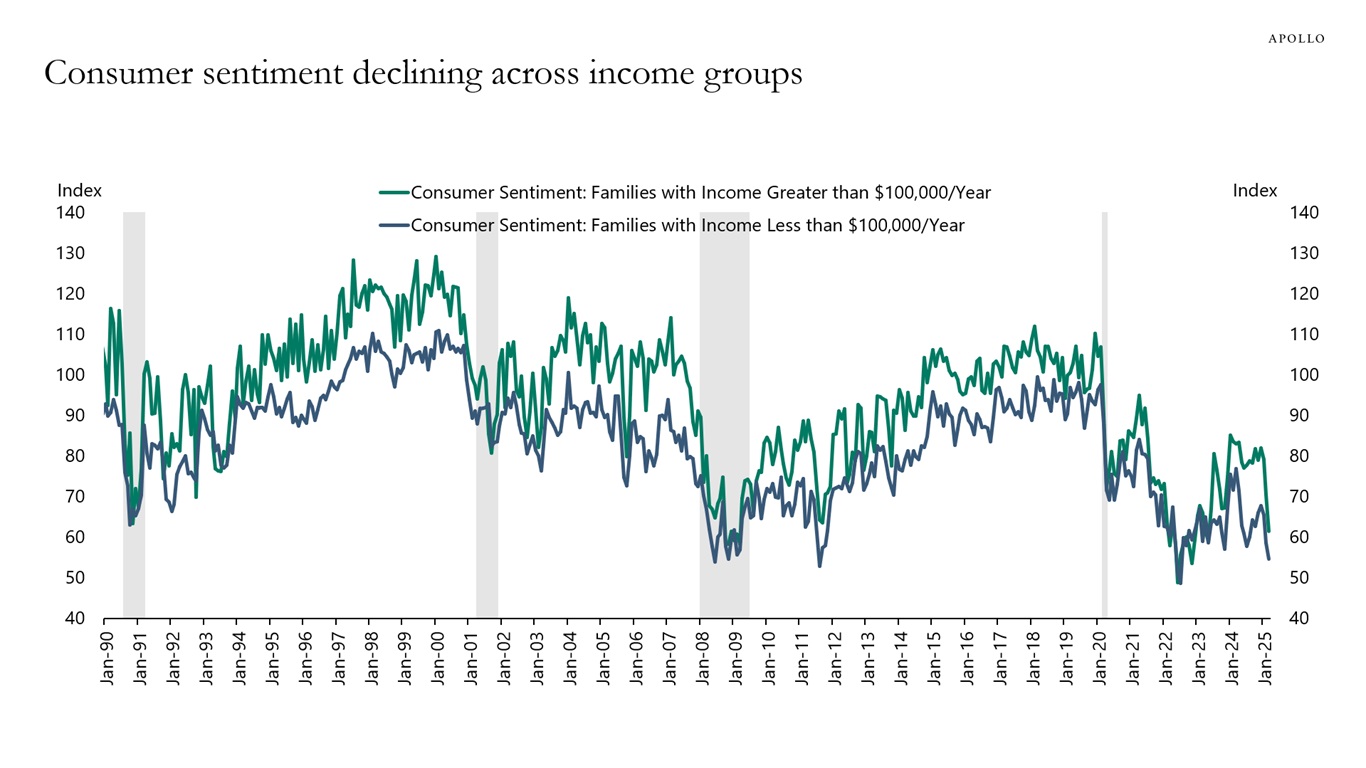
Source: University of Michigan, Haver Analytics, Apollo Chief Economist 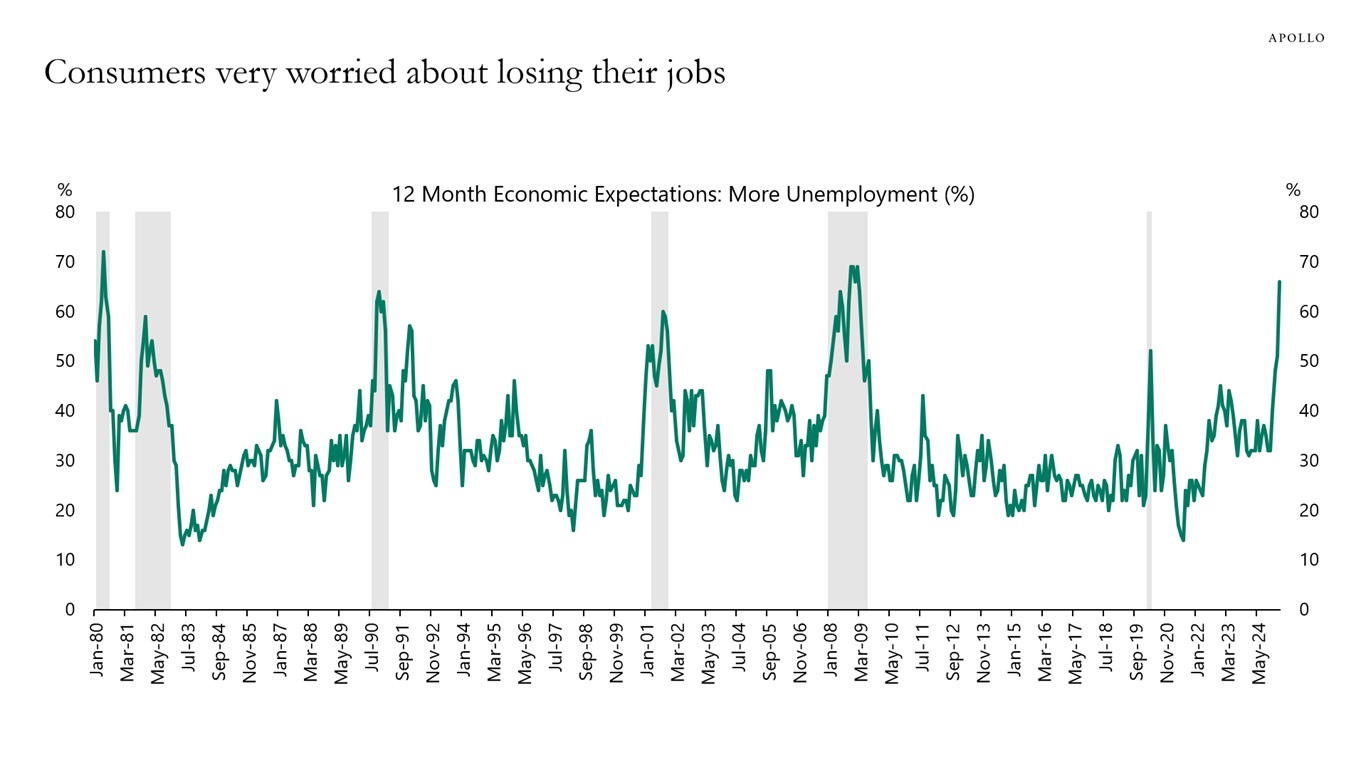
Source: University of Michigan, Haver Analytics, Apollo Chief Economist 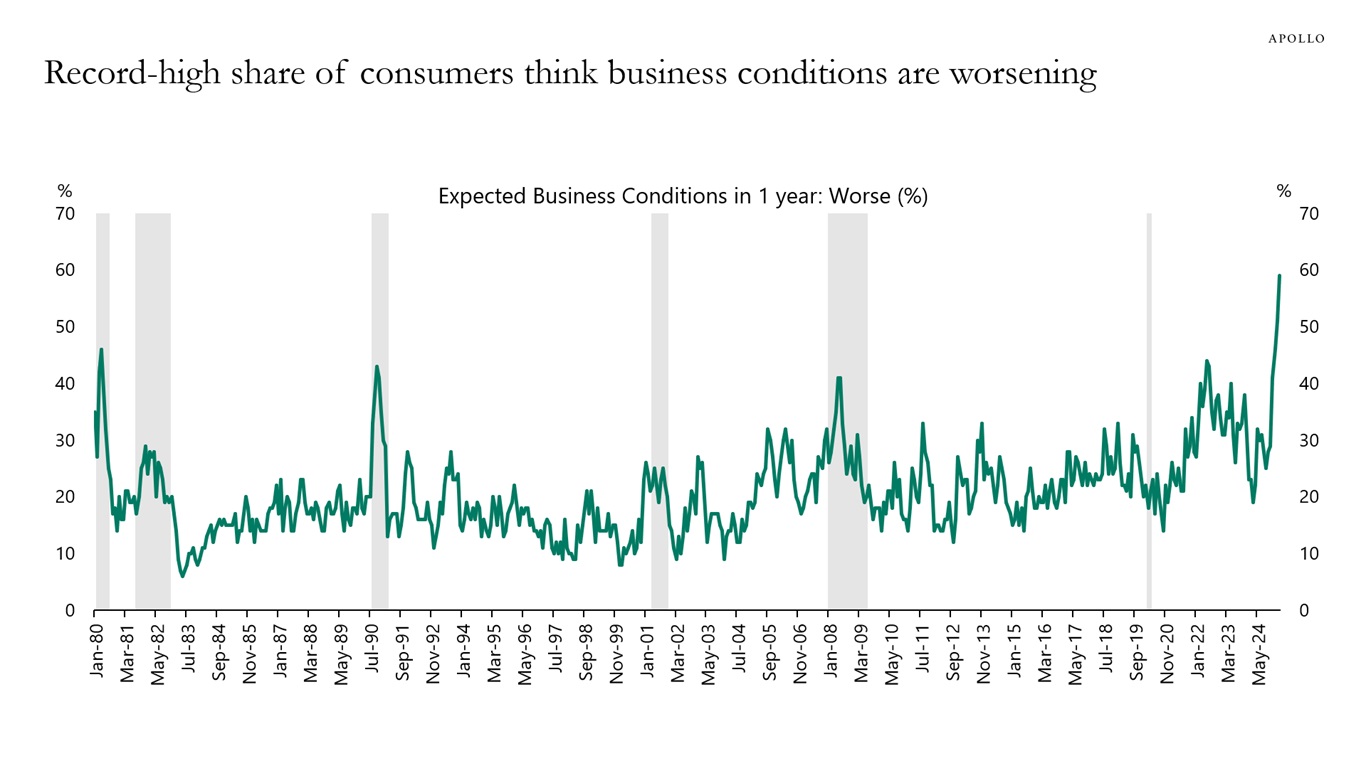
Source: University of Michigan, Haver Analytics, Apollo Chief Economist 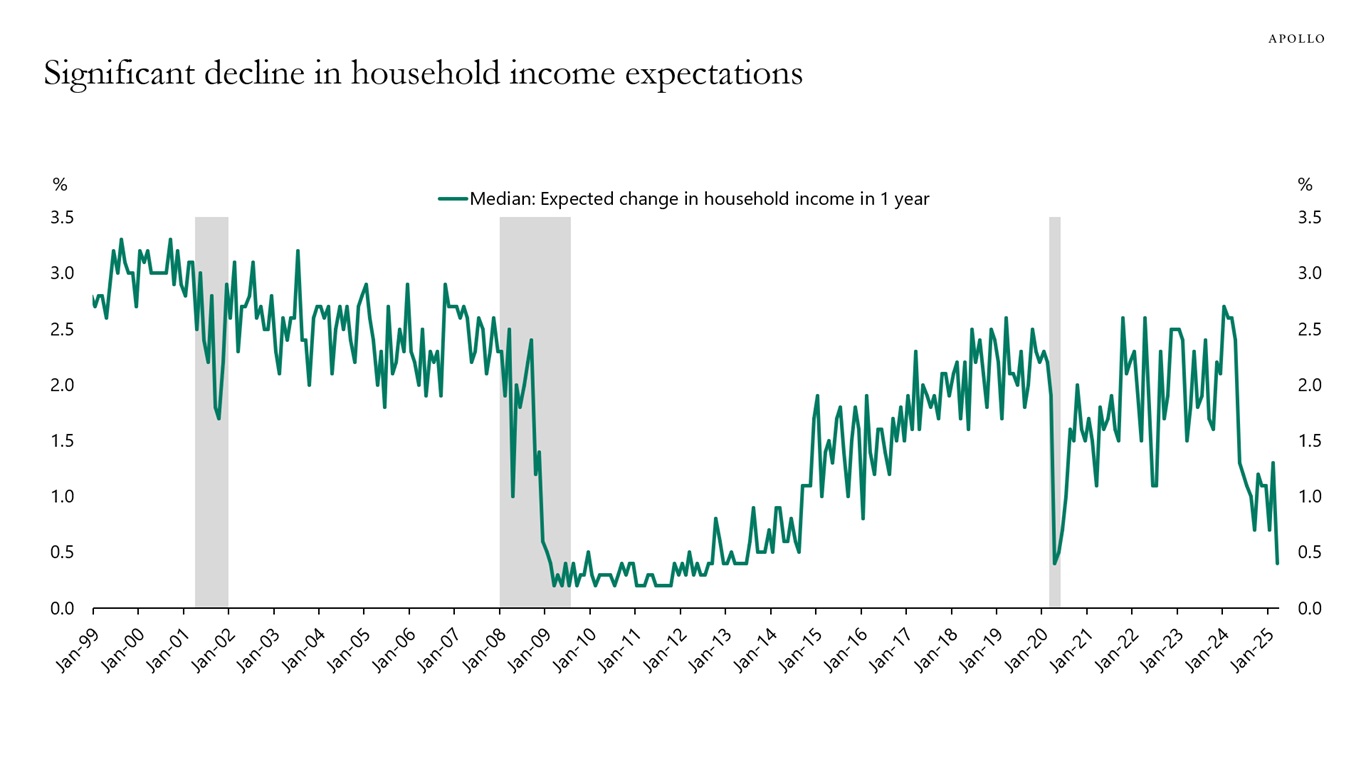
Source: University of Michigan, Bloomberg, Apollo Chief Economist 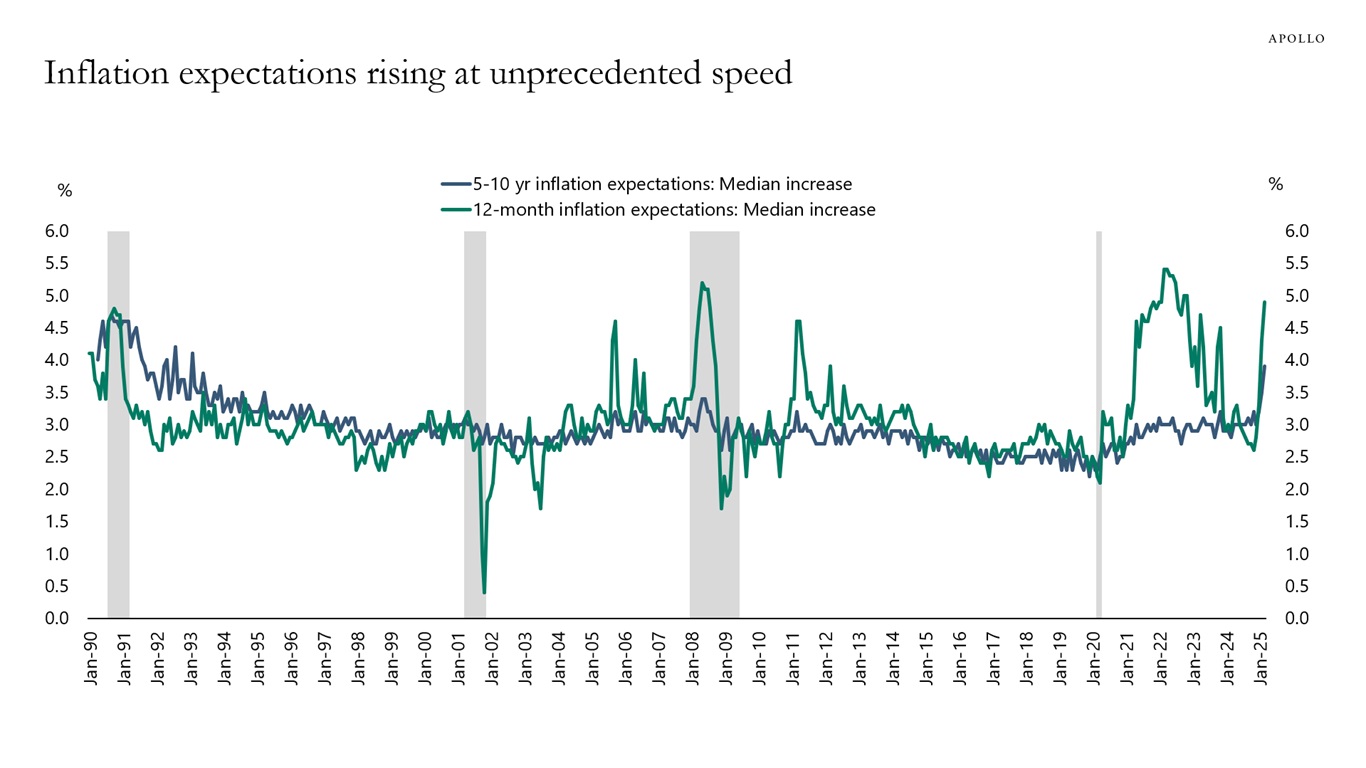
Source: University of Michigan, Haver Analytics, Apollo Chief Economist See important disclaimers at the bottom of the page.
-
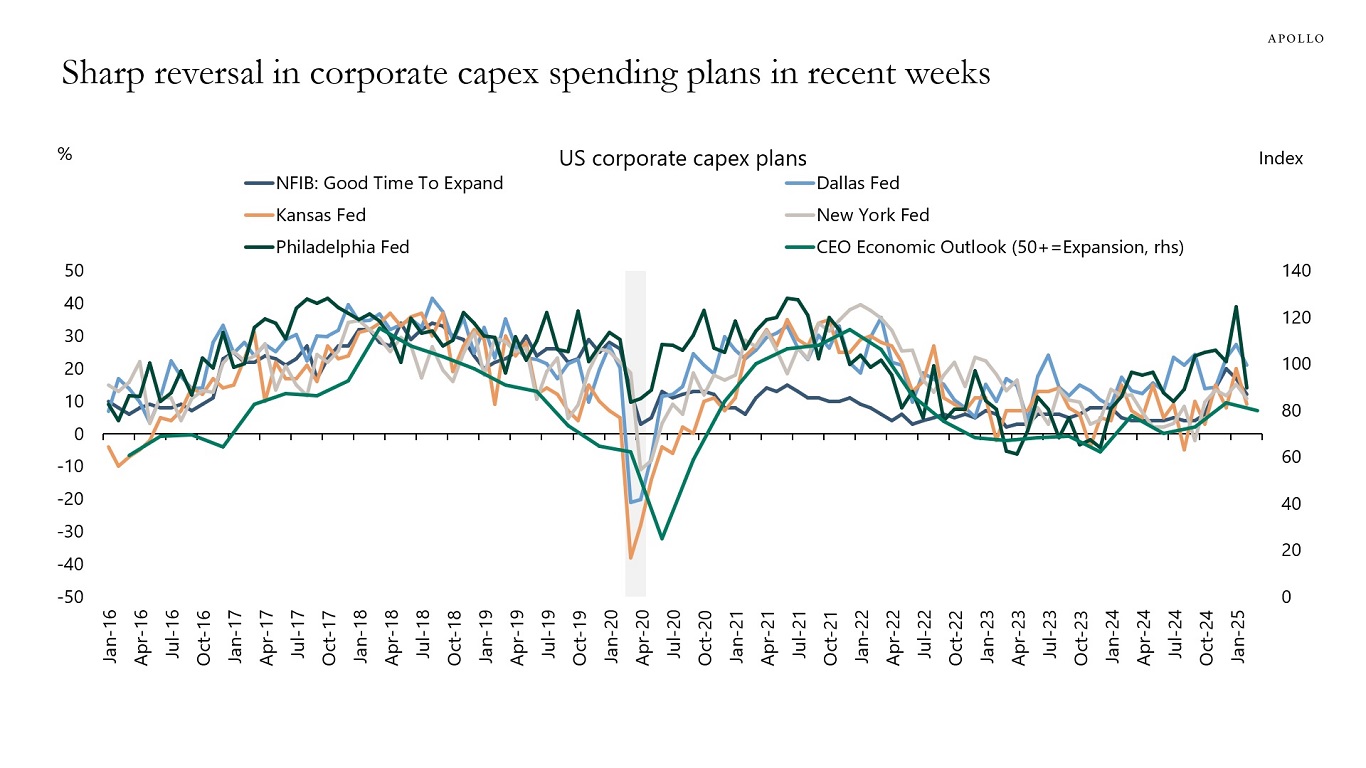
Surveys of firms show that companies have in recent weeks started to pull back capex plans, and consumers are getting more worried about their jobs, see the first two charts below. At the same time, leading indicators point to higher inflation ahead, see the third chart.
Furthermore, airlines this week reported a slowdown in bookings, and the latest credit card data points to broad-based weakness across all categories except online sales.
The bottom line is that the soft data points to weakness coming in the hard data. In addition, this past week was the survey week for the March employment report, and with uncertainty elevated, the downside risks to March nonfarm payrolls—when it is released on Friday, April 4—are significant.
Our updated chart book with daily and weekly indicators for the US economy is available here.
Sources: Apollo Chief Economist, Business Roundtable, NFIB, Federal Reserve Banks of Dallas, Kansas, New York, Philadelphia, and Richmond 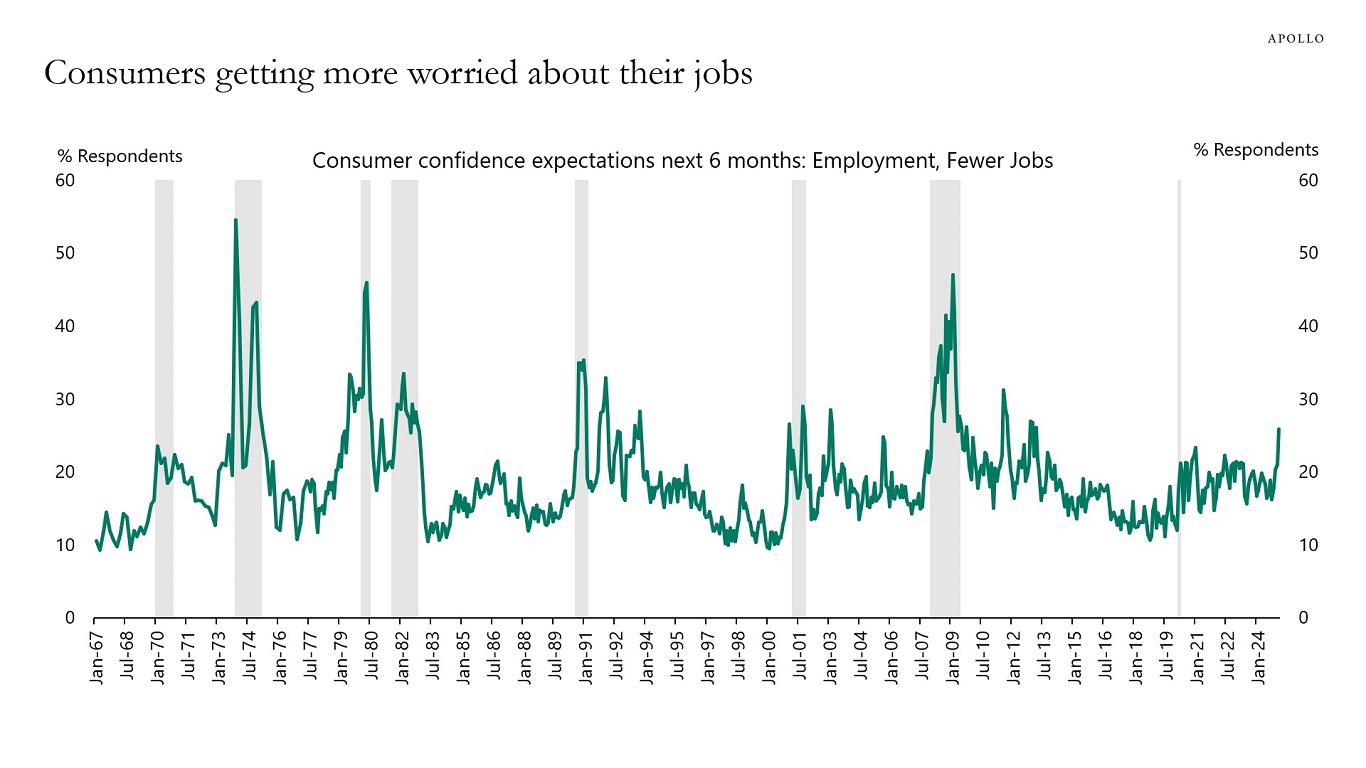
Sources: Apollo Chief Economist, Conference Board, Haver Analytics 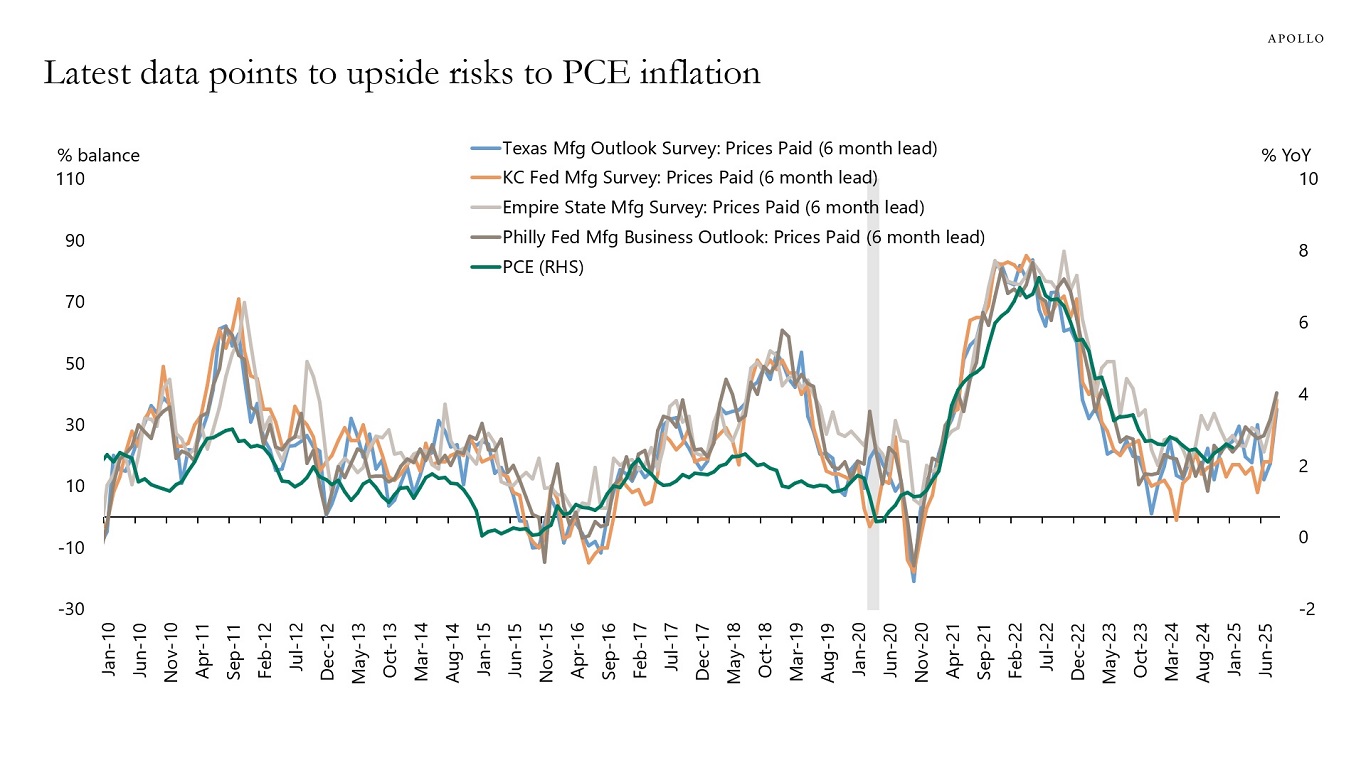
Sources: Apollo Chief Economist, BEA, FRBNY, Haver Analytics, Federal Reserve Banks of Dallas, Kansas City, New York, Philadelphia, and Richmond See important disclaimers at the bottom of the page.
-
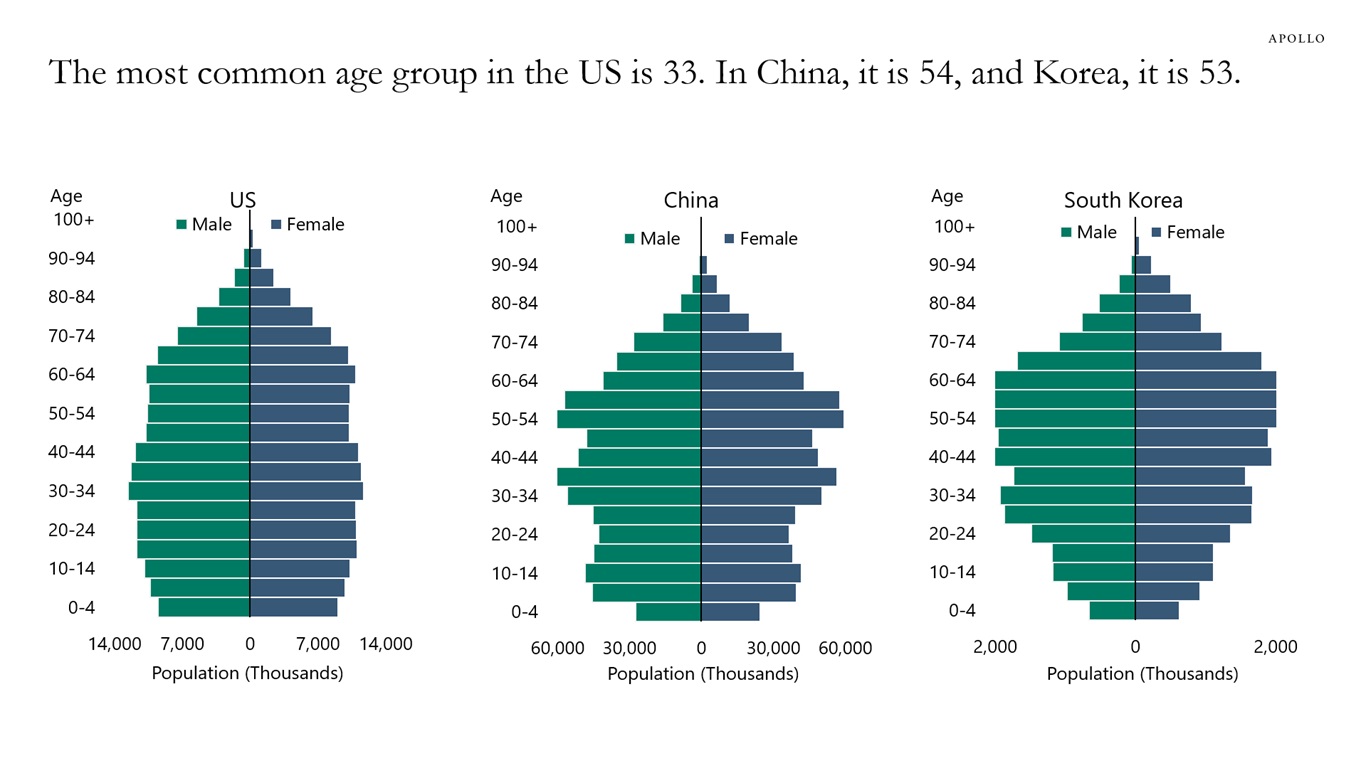
There are more 33-year-olds in the US than any other age group, see chart below.
For China, there are more 54-year-olds, and for Korea, there are more 53-year-olds.
Source: PopulationPyramid.net, Apollo Chief Economist See important disclaimers at the bottom of the page.
-
What characterizes a wait-and-see economy is that consumers and firms are more cautious about spending decisions. Consumers are more reluctant to plan vacations, to buy cars, and to buy new washers and dryers. Similarly, firms are more reluctant to hire and more reluctant to do capex.
The wait-and-see economy is no longer just for companies directly involved in trade with Canada and Mexico. Uncertainty for small businesses is near all-time high levels. This is a problem because small businesses are the foundation of the economy, accounting for more than 80% of total US employment, see the first chart below.
Markets are not yet pricing in the coming slowdown in the hard data. The spread between CCC and single-B has only widened modestly and is still significantly tighter than where it was during the summer of 2022—when the economy was doing just fine—see the second chart. In a slowdown scenario, investors would start to migrate to higher-quality names.
The bottom line is that a wait-and-see economy eventually leads to a slowdown in the hard data. And markets should prepare for that scenario.
Source: Bloomberg, BLS, Apollo Chief Economist 
Source: Bloomberg, ICE BofA, Apollo Chief Economist See important disclaimers at the bottom of the page.
-
The February NFIB survey of small businesses shows that business uncertainty is near the highest levels since the survey started in the 1970s, see chart below.
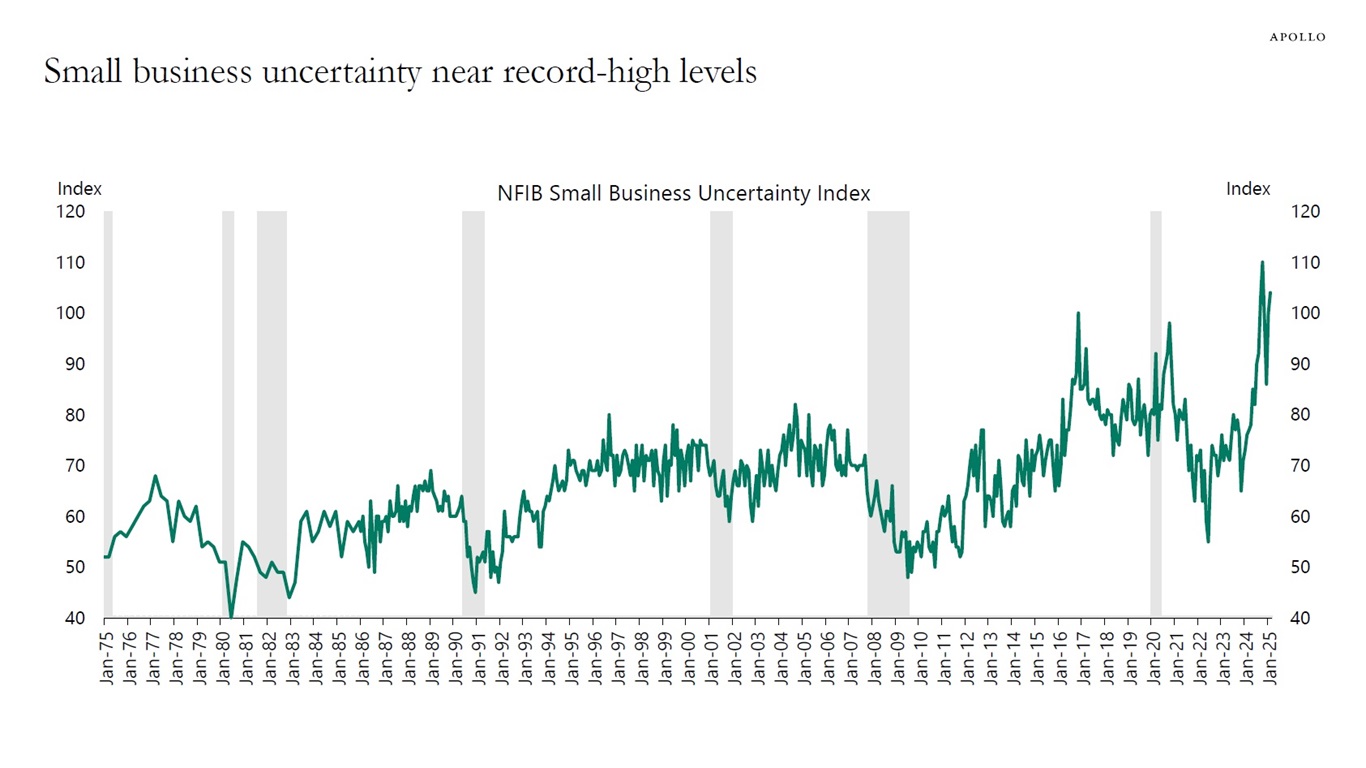
Source: NFIB, Bloomberg, Apollo Chief Economist See important disclaimers at the bottom of the page.

This presentation may not be distributed, transmitted or otherwise communicated to others in whole or in part without the express consent of Apollo Global Management, Inc. (together with its subsidiaries, “Apollo”).
Apollo makes no representation or warranty, expressed or implied, with respect to the accuracy, reasonableness, or completeness of any of the statements made during this presentation, including, but not limited to, statements obtained from third parties. Opinions, estimates and projections constitute the current judgment of the speaker as of the date indicated. They do not necessarily reflect the views and opinions of Apollo and are subject to change at any time without notice. Apollo does not have any responsibility to update this presentation to account for such changes. There can be no assurance that any trends discussed during this presentation will continue.
Statements made throughout this presentation are not intended to provide, and should not be relied upon for, accounting, legal or tax advice and do not constitute an investment recommendation or investment advice. Investors should make an independent investigation of the information discussed during this presentation, including consulting their tax, legal, accounting or other advisors about such information. Apollo does not act for you and is not responsible for providing you with the protections afforded to its clients. This presentation does not constitute an offer to sell, or the solicitation of an offer to buy, any security, product or service, including interest in any investment product or fund or account managed or advised by Apollo.
Certain statements made throughout this presentation may be “forward-looking” in nature. Due to various risks and uncertainties, actual events or results may differ materially from those reflected or contemplated in such forward-looking information. As such, undue reliance should not be placed on such statements. Forward-looking statements may be identified by the use of terminology including, but not limited to, “may”, “will”, “should”, “expect”, “anticipate”, “target”, “project”, “estimate”, “intend”, “continue” or “believe” or the negatives thereof or other variations thereon or comparable terminology.