


The Daily Spark is moving to Apollo.com— read the latest from Torsten Slok here.
Want it delivered daily to your inbox?
-
The term premium for 10-year Treasuries has increased 75 basis points (bps) over the past three months, see chart below.
In other words, 10-year rates have increased an additional 75 bps more than what can be justified by changing Fed expectations, which is likely a reflection of emerging fears in markets about US fiscal sustainability.
Combined with the significant decline in the Fed’s Reverse Repo Facility (RRP) usage and the dramatic increase in T-bill issuance in 2024 (which needs to be rolled over into longer duration), the risks are rising that rates markets will be more volatile in 2025.
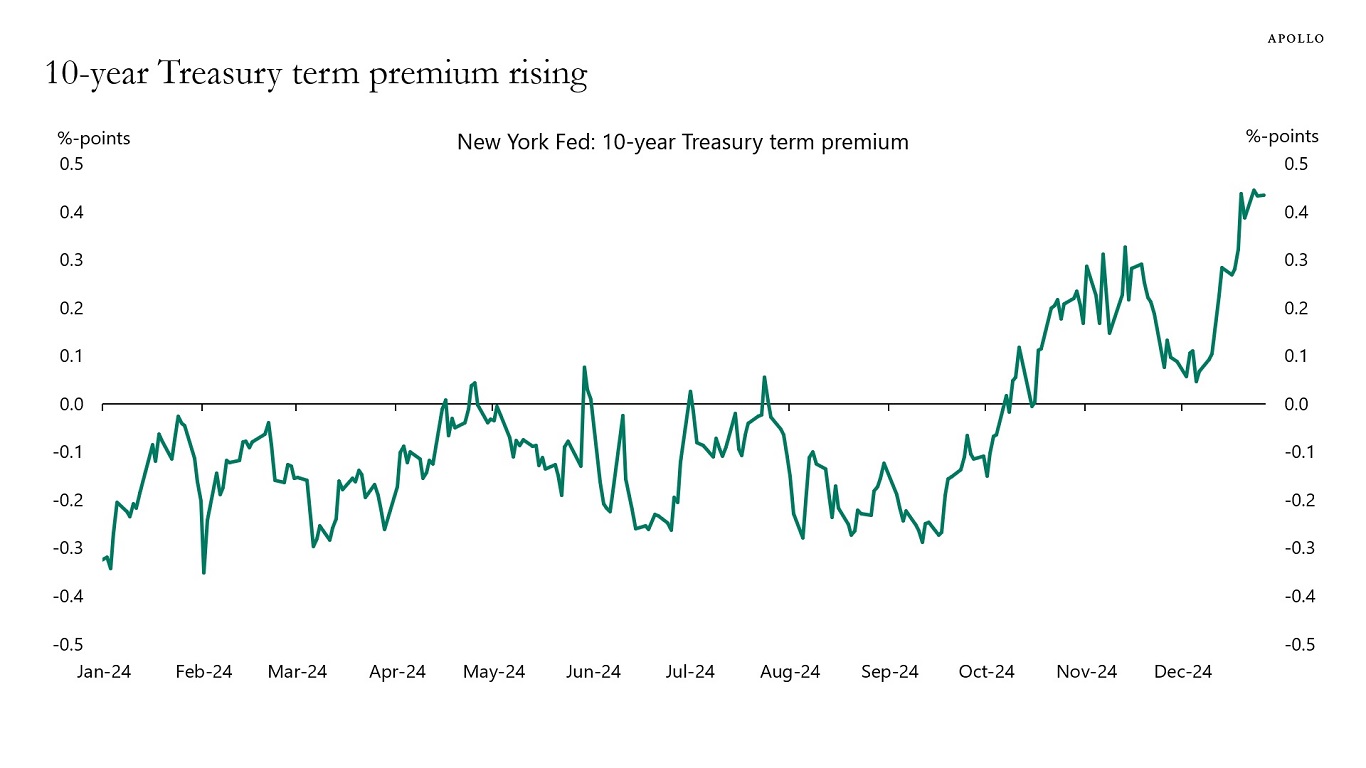
Note: The NY Fed measure for the term premium is based on a five-factor, no-arbitrage term structure model. Source: New York Fed, Bloomberg, Apollo Chief Economist See important disclaimers at the bottom of the page.
-
The average daily rate for a hotel in New York is at a record-high of $417, see chart below.
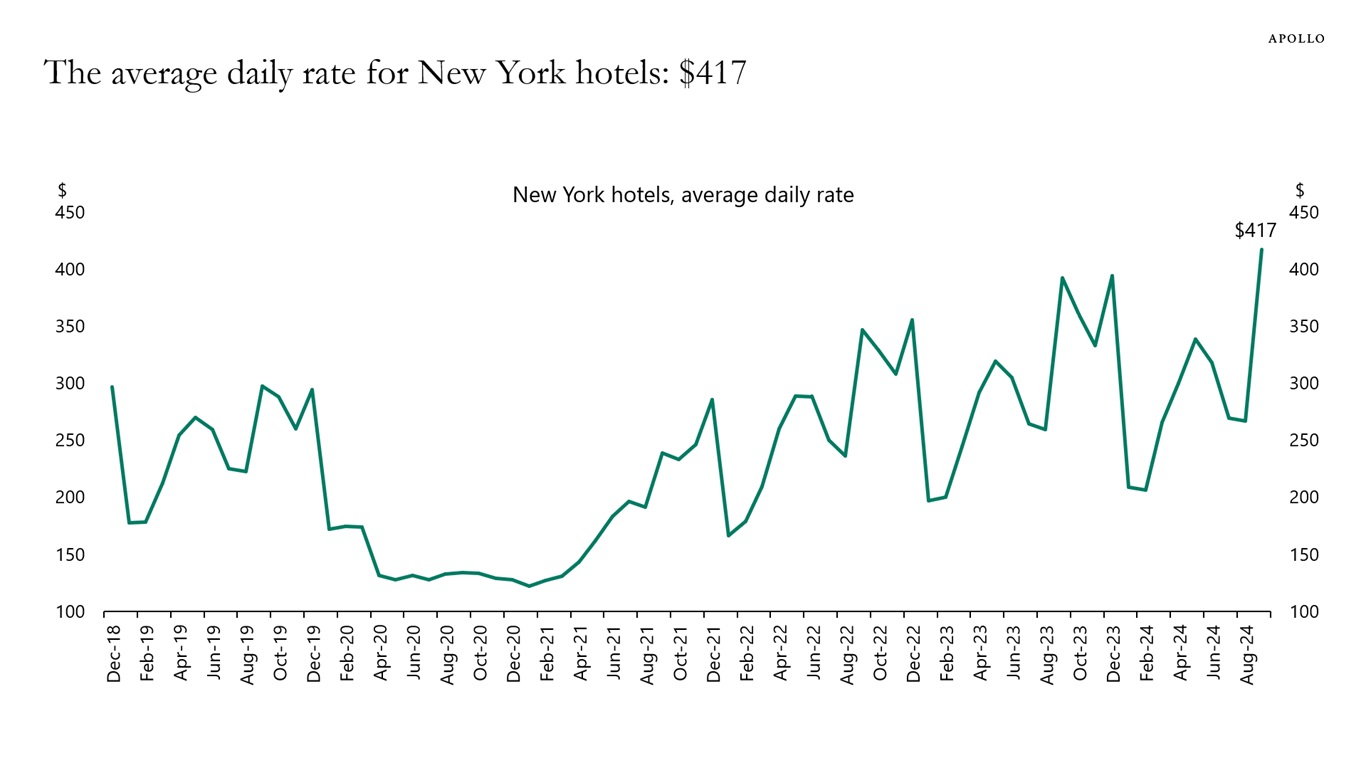
Source: CoStar, Apollo Chief Economist See important disclaimers at the bottom of the page.
-
The US and European business cycles are decoupling, it is highly unusual, see chart below.
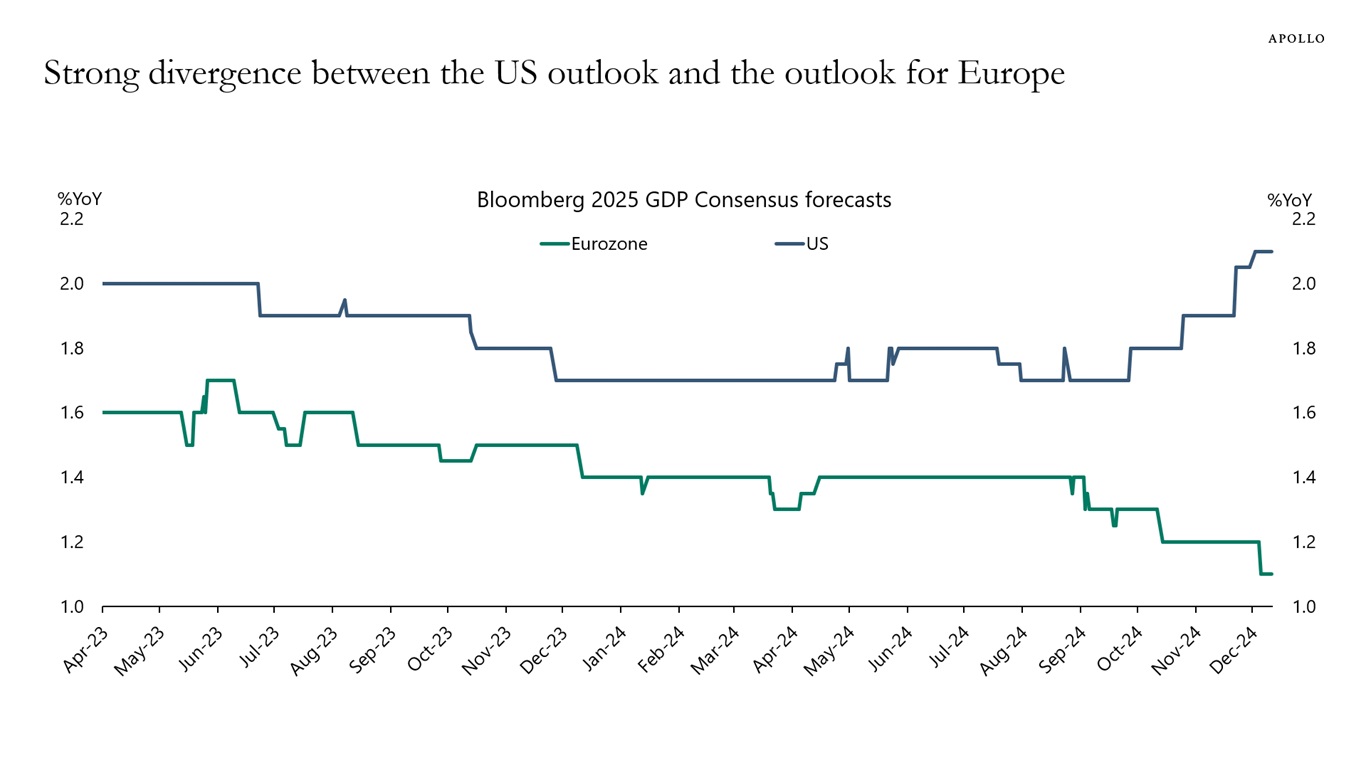
Source: Bloomberg, Apollo Chief Economist See important disclaimers at the bottom of the page.
-
The housing stock in the US is getting older, and the median age of a home is now 40 years, up from 31 years in 2005, see chart below.

Source: 2005-2019, 2021-2022 American Community Survey Estimates, Apollo Chief Economist See important disclaimers at the bottom of the page.
-
The latest CFO survey by Duke University and the Federal Reserve Banks of Richmond and Atlanta shows rising optimism regarding the economy and their own company, see chart below.
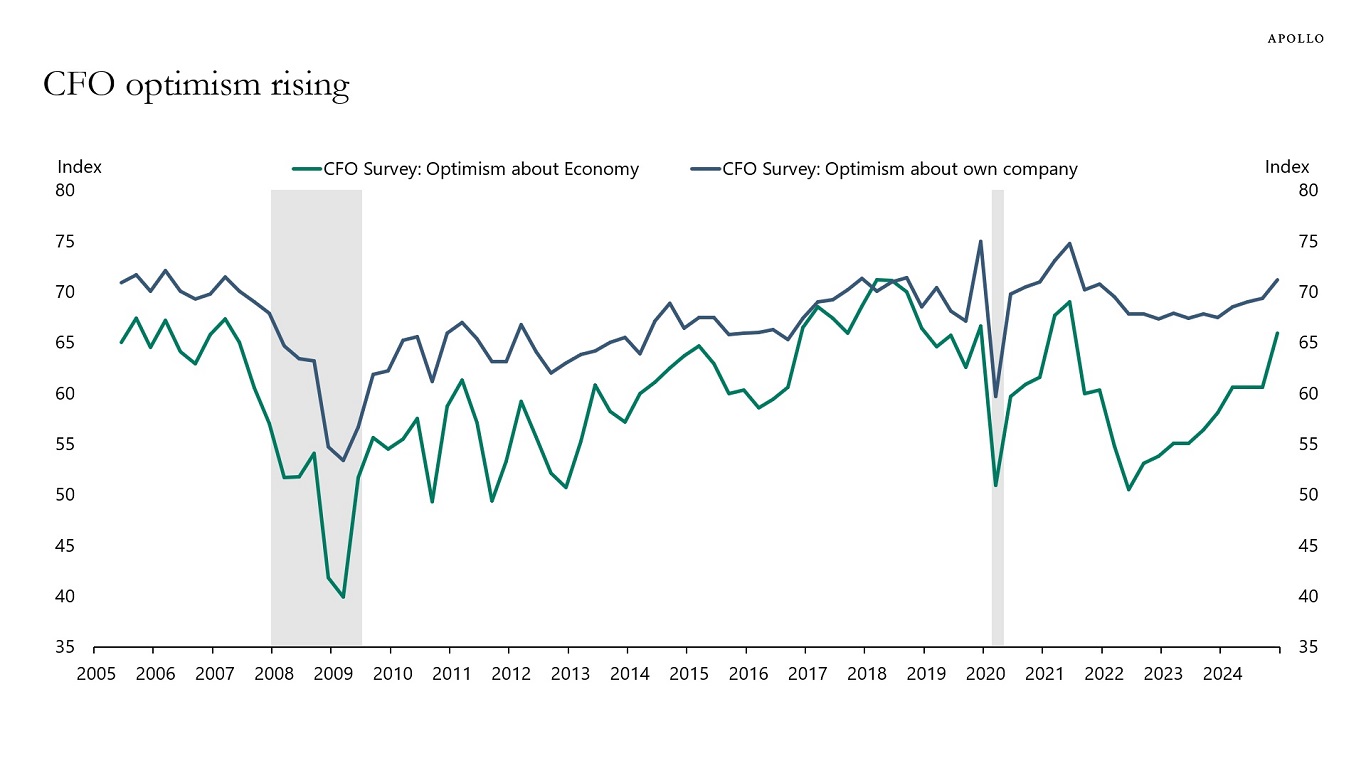
Source: Duke University, FRB Richmond, FRB Atlanta, Haver Analytics, Apollo Chief Economist See important disclaimers at the bottom of the page.
-
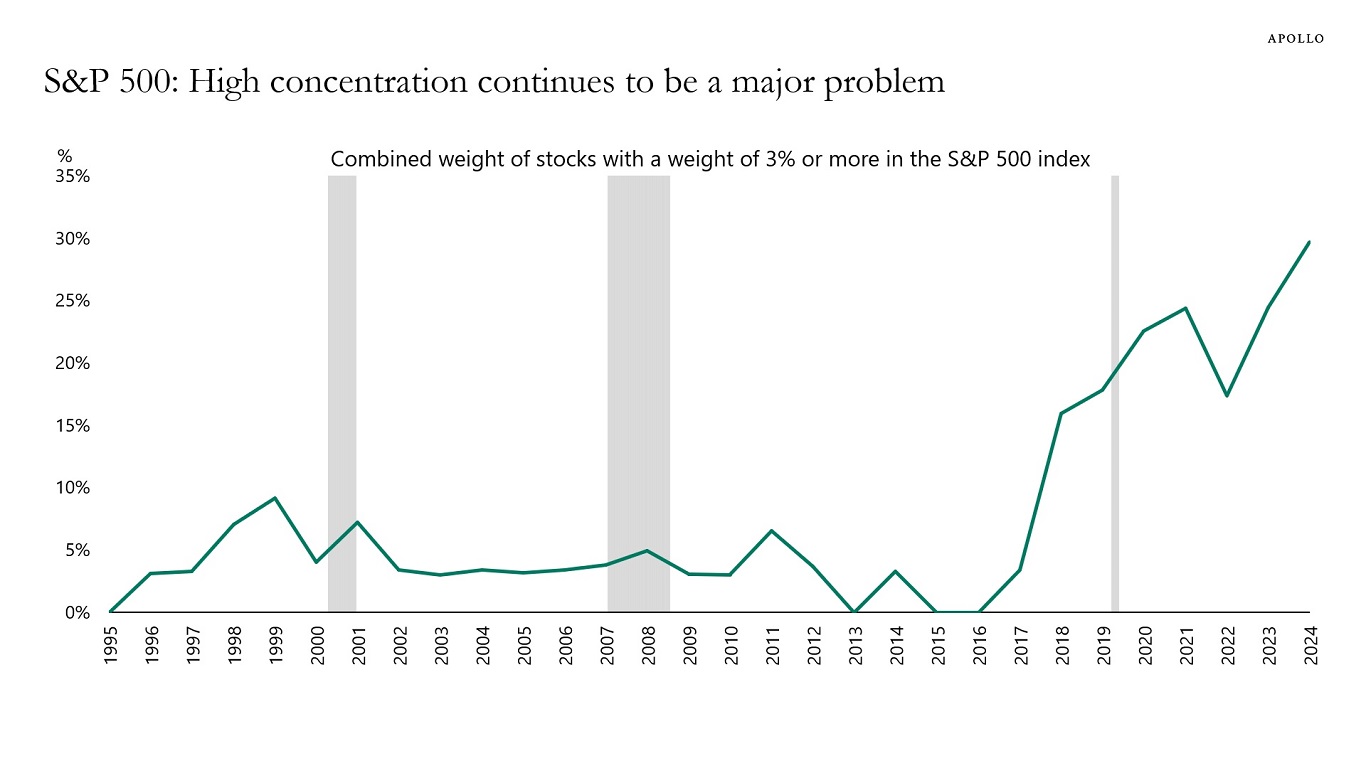
The finance textbook says that investors should diversify their investments. But there is little diversification today when buying the S&P 500. The combined weight of stocks with a weight of 3% or more in the S&P 500 index is at an all-time high and continues to rise, see chart below.
The bottom line is that buying the S&P 500 gives the impression that you are buying 500 different stocks and diversifying your investments. But the reality is that the high and growing concentration in the S&P 500 continues to be a major problem.
In short, investors should ensure that their portfolio is not all levered to Nvidia earnings.
Sources: Bloomberg, Apollo Chief Economist See important disclaimers at the bottom of the page.
-
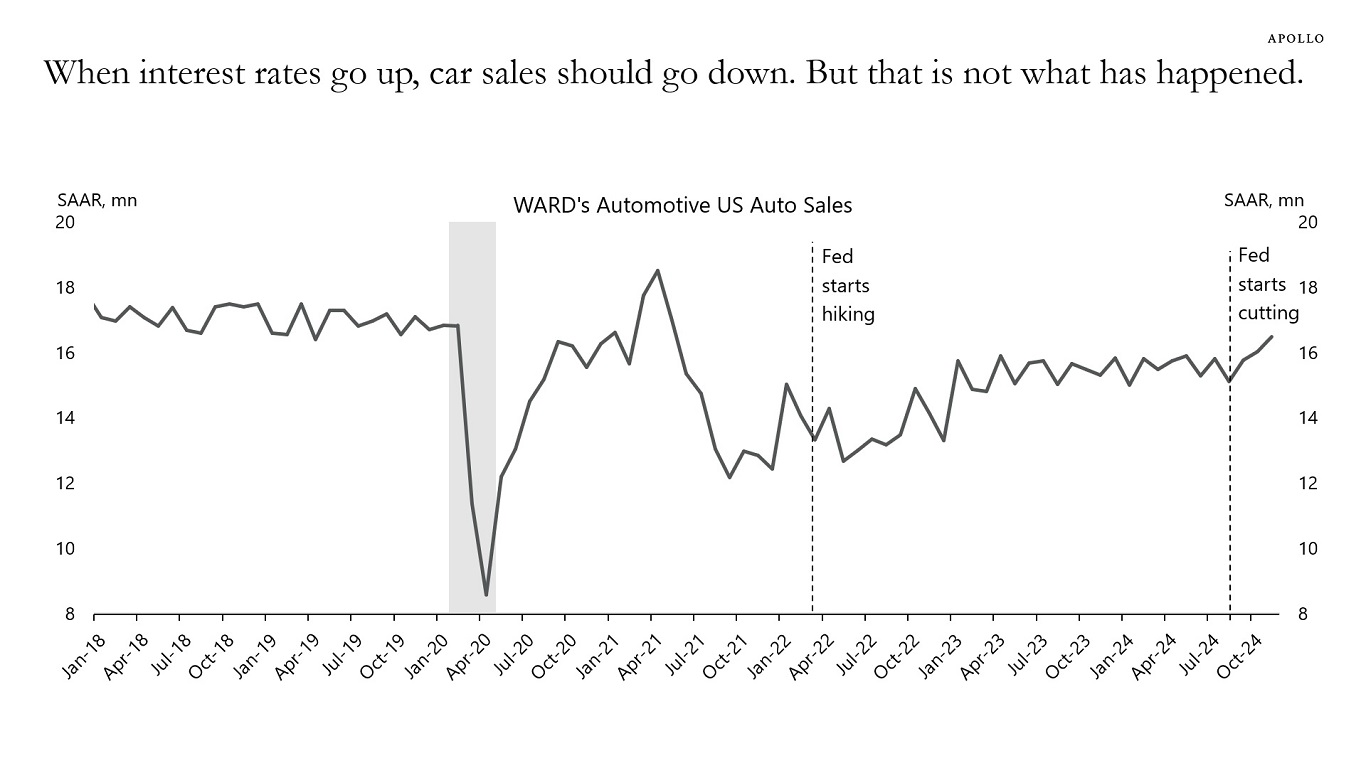
Autos are usually one of the most interest-rate-sensitive sectors in the economy. When the Fed raises interest rates, you would expect car sales to decline.
But that is not what has happened during this cycle.
Instead, car sales have been going up despite the Fed raising interest rates from zero to 5.5% over a short period.
The source of strong demand for cars has been robust income growth, low unemployment, households having excess savings after the pandemic, and significant increases in stock prices and home prices, leading to a higher share of cars purchased with cash.
Combined with the Fed now cutting interest rates, the outlook for car sales continues to be strong, see also the steady increase in car sales since the Fed began to cut interest rates in September.
Source: WARD’s Automotive Group, Bloomberg, Apollo Chief Economist See important disclaimers at the bottom of the page.
-
Below is a list of risks to markets in 2025, including the probability that each risk materializes.

Note: Probabilities do not add up to 100%. Several risks can materialize at the same time. Source: Apollo Chief Economist See important disclaimers at the bottom of the page.
-
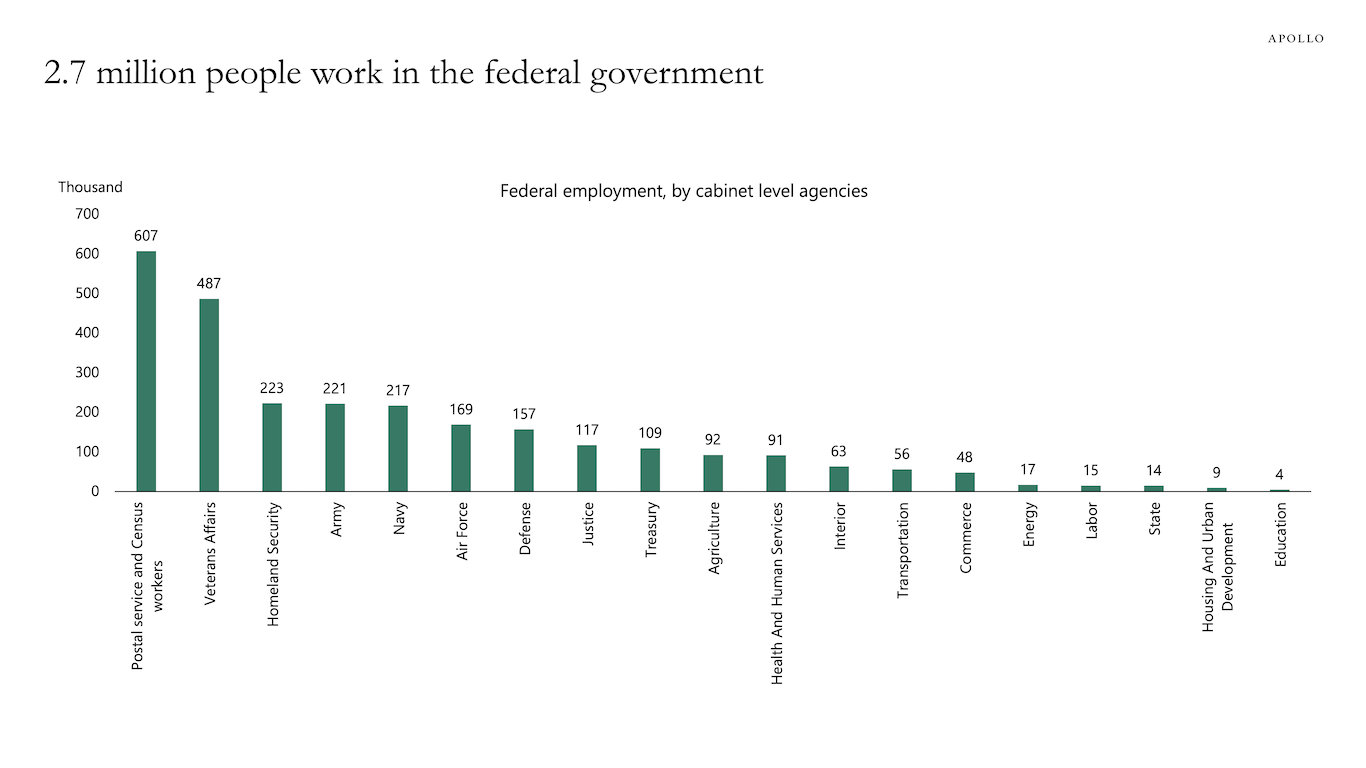
Total employment in the federal government is 2.7 million, and the total cost of wages and salaries is roughly $400 billion.
The chart below shows that most federal government workers are in the US Postal Service, Veterans Affairs, Homeland Security, and the Army, Navy, Air Force, and Department of Defense.
Source: US Office of Personnel Management, BLS, Haver Analytics, Apollo Chief Economist See important disclaimers at the bottom of the page.
-
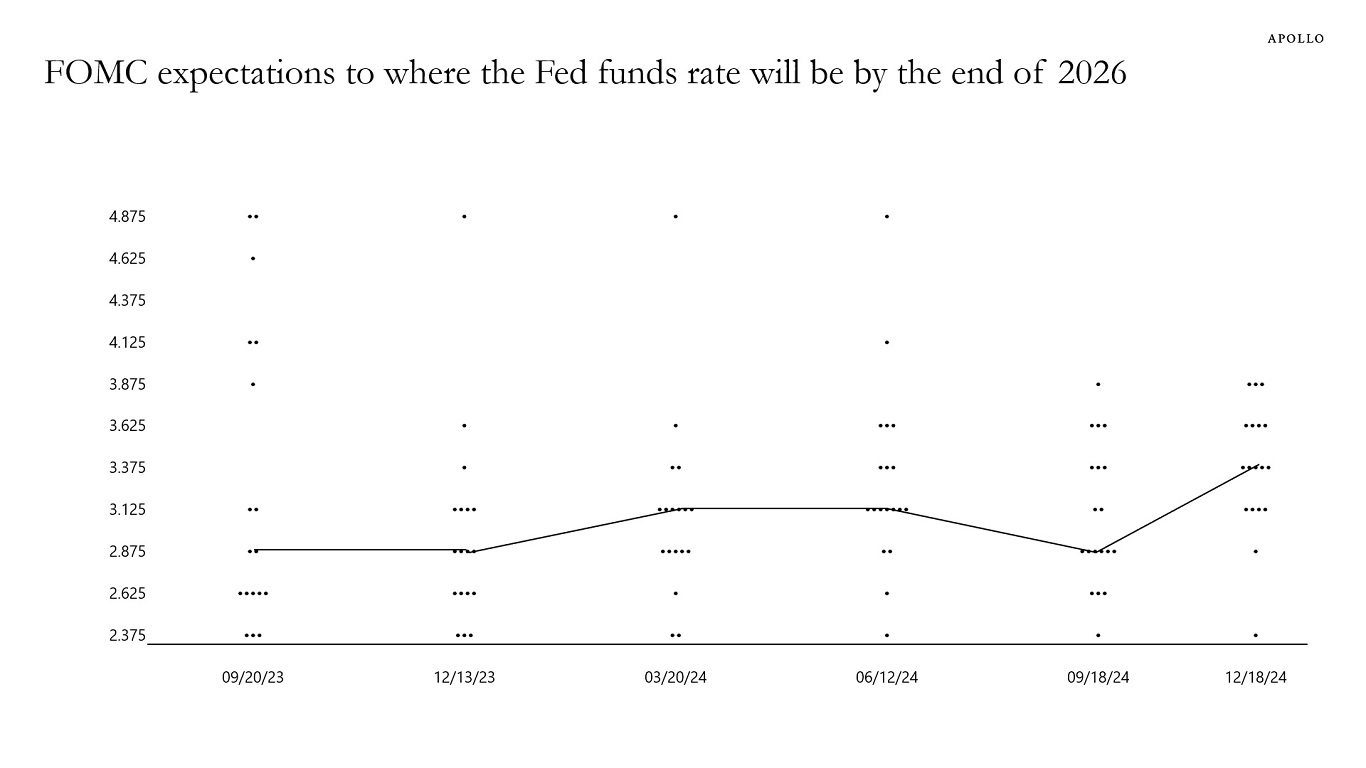
The first chart below shows that the FOMC continues to revise higher where they think the Fed funds rate will be by the end of 2026.
The second chart shows that the Fed continues to revise higher where they think the Fed funds rate will be in the long run.
The third chart shows that the market continues to revise higher where it thinks the Fed funds rate is going.
The entire purpose of the Fed in keeping interest rates higher for longer is to slow down consumer spending, capex spending, and corporate earnings so that inflation begins to move lower toward the Fed’s 2% inflation target.
The bottom line is that interest rates staying higher for longer is the number one theme in markets as we enter 2025.
This has significant implications for asset allocation and portfolio construction because the most important variable in the finance textbook is the risk-free interest rate. When the risk-free rate goes up, it raises the bar for returns on equities, particularly in a situation where returns in equities have been driven entirely by a handful of tech stocks. In short, higher for longer has important implications for how investors should think about debt versus equity in 2025.
Sources: Bloomberg, Apollo Chief Economist 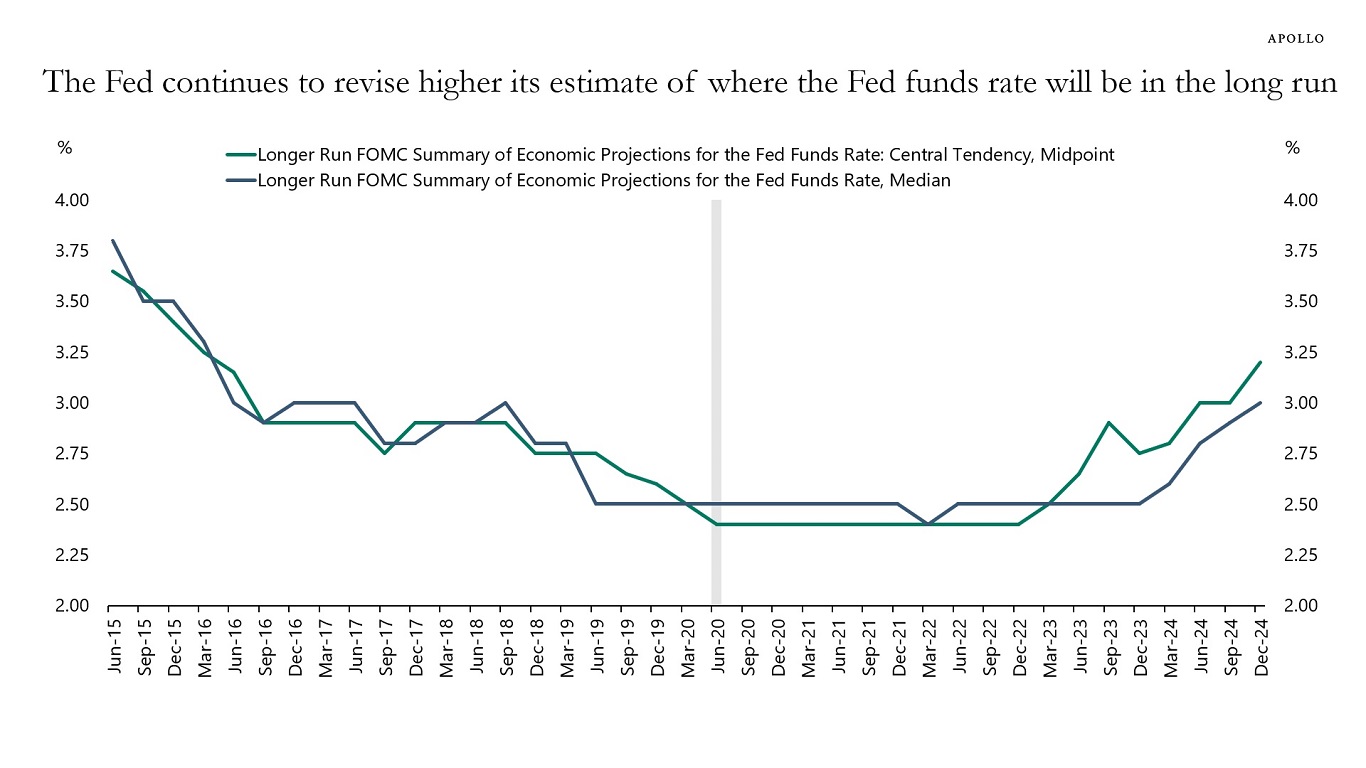
Sources: Federal Reserve Board, Apollo Chief Economist 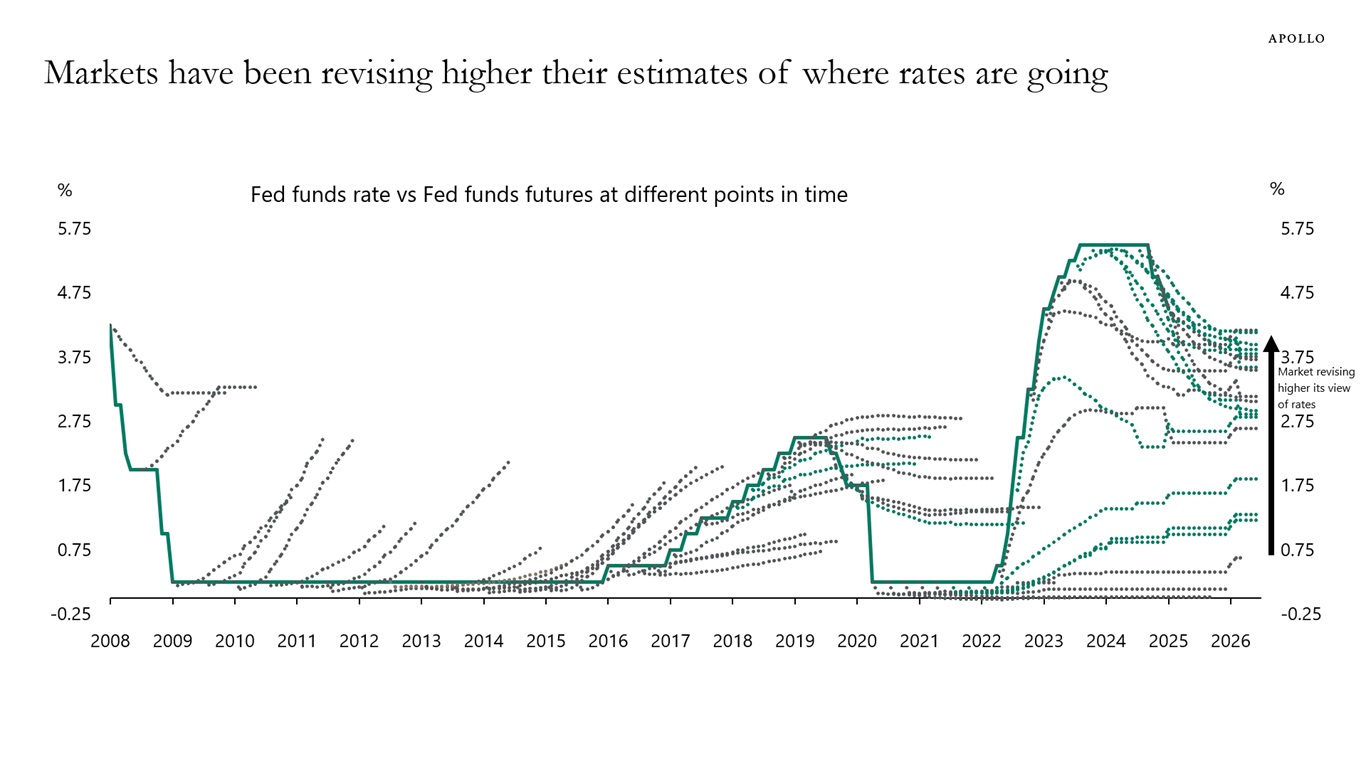
Sources: Federal Reserve Board, Bloomberg, Apollo Chief Economist See important disclaimers at the bottom of the page.

This presentation may not be distributed, transmitted or otherwise communicated to others in whole or in part without the express consent of Apollo Global Management, Inc. (together with its subsidiaries, “Apollo”).
Apollo makes no representation or warranty, expressed or implied, with respect to the accuracy, reasonableness, or completeness of any of the statements made during this presentation, including, but not limited to, statements obtained from third parties. Opinions, estimates and projections constitute the current judgment of the speaker as of the date indicated. They do not necessarily reflect the views and opinions of Apollo and are subject to change at any time without notice. Apollo does not have any responsibility to update this presentation to account for such changes. There can be no assurance that any trends discussed during this presentation will continue.
Statements made throughout this presentation are not intended to provide, and should not be relied upon for, accounting, legal or tax advice and do not constitute an investment recommendation or investment advice. Investors should make an independent investigation of the information discussed during this presentation, including consulting their tax, legal, accounting or other advisors about such information. Apollo does not act for you and is not responsible for providing you with the protections afforded to its clients. This presentation does not constitute an offer to sell, or the solicitation of an offer to buy, any security, product or service, including interest in any investment product or fund or account managed or advised by Apollo.
Certain statements made throughout this presentation may be “forward-looking” in nature. Due to various risks and uncertainties, actual events or results may differ materially from those reflected or contemplated in such forward-looking information. As such, undue reliance should not be placed on such statements. Forward-looking statements may be identified by the use of terminology including, but not limited to, “may”, “will”, “should”, “expect”, “anticipate”, “target”, “project”, “estimate”, “intend”, “continue” or “believe” or the negatives thereof or other variations thereon or comparable terminology.