


The Daily Spark is moving to Apollo.com— read the latest from Torsten Slok here.
Want it delivered daily to your inbox?
-
After the Global Financial Crisis (GFC), the P/E ratio for US equities was similar to that of the rest of the world, but the surge in tech valuations has now pushed the US P/E ratio 40% higher, see chart below.
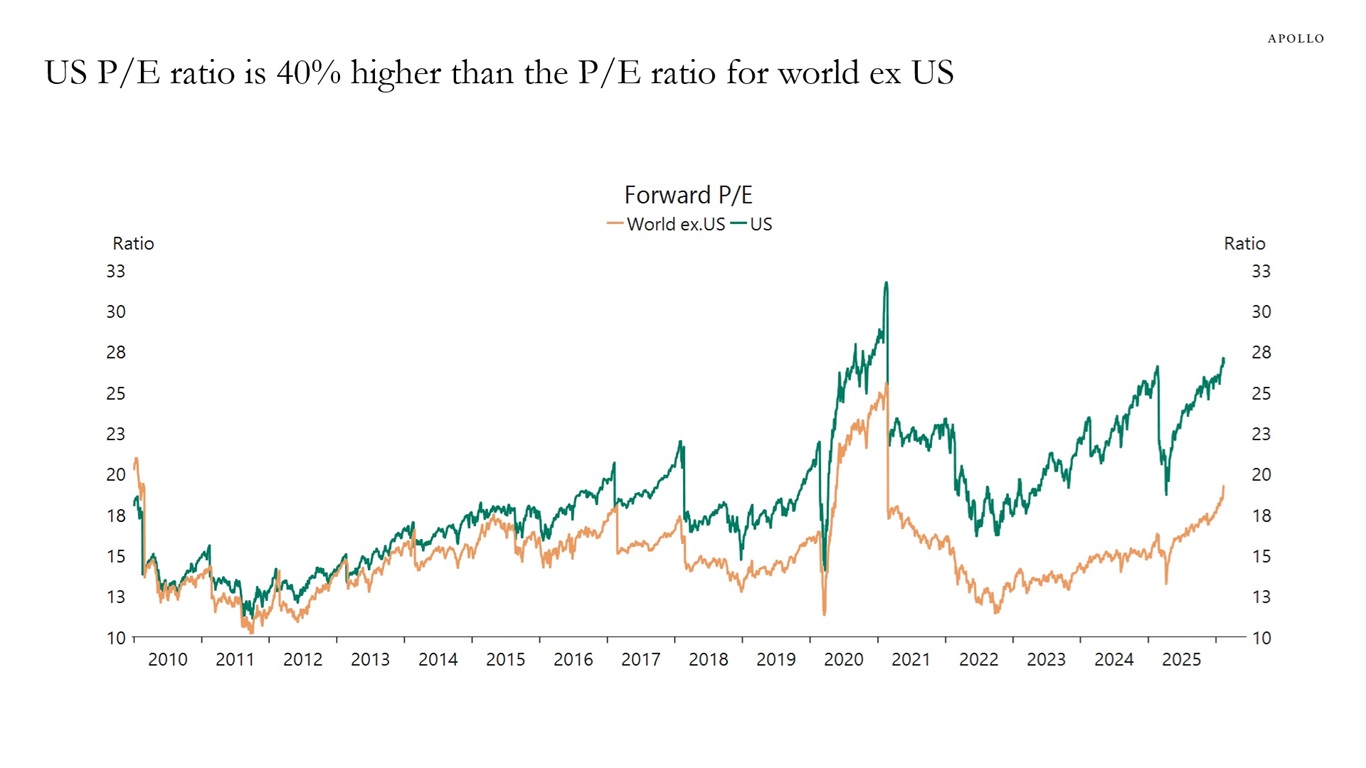
Note: US=SPX Index, World ex-US=MSCI World ex-USA Index. Sources: Bloomberg, Macrobond, Apollo Chief Economist See important disclaimers at the bottom of the page.
-
The Nobel Prize–winning economist Robert Solow said in 1987, “You can see the computer age everywhere but in the productivity statistics.” This observation is the so‑called Solow productivity paradox.
The same can be said today: AI is everywhere except in the incoming macroeconomic data.
Today, you don’t see AI in the employment data, productivity data or inflation data. Similarly, for the S&P 493, there are no signs of AI in profit margins or earnings expectations.
Maybe there is a J‑curve effect for AI, where it takes time for AI to show up in the macro data. Maybe not.
Whether there is a J-curve effect depends on the value creation from AI. There is fierce competition between the builders of large language models (LLMs), which is driving the price of LLMs toward zero for end-users. This is the opposite of what the finance textbook says, namely that an innovator will have monopoly pricing power until others arrive with a similar product. This is what we saw during the computer age in the 1980s.
In other words, from a macro perspective, the value creation is not the product, but how generative AI is used and implemented in different sectors in the economy. The academic literature is still inconclusive about the potential macro effects of AI, see table below.
After three years with ChatGPT and still no signs of AI in the incoming data, it looks like AI will likely be labor enhancing in some sectors rather than labor replacing in all sectors.
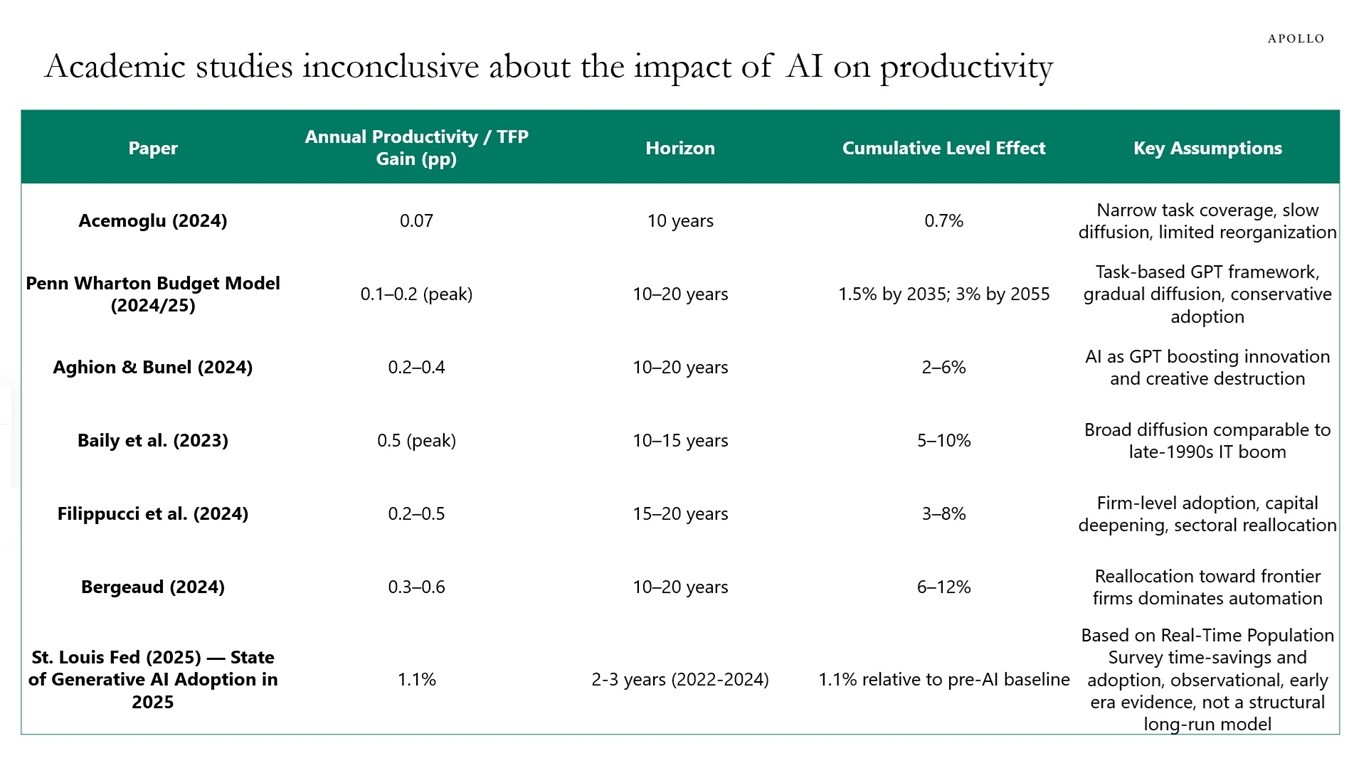
Source: Apollo Chief Economist See important disclaimers at the bottom of the page.
-
For many years, the rest of the world invested significant amounts in China to build factories and assembly lines.
But that has changed in recent years.
China now invests more abroad than the rest of the world invests in China, see chart below.
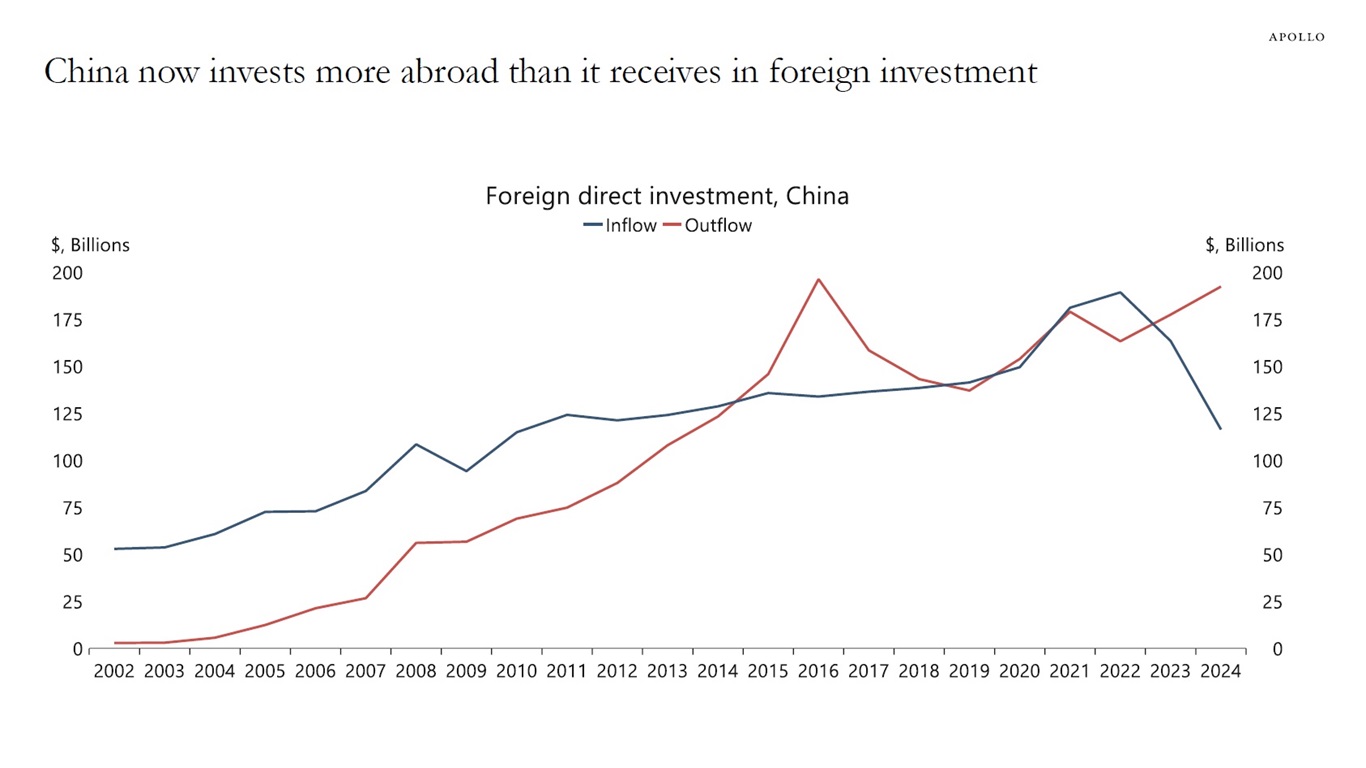
Sources: China Ministry of Commerce, Macrobond, Apollo Chief Economist See important disclaimers at the bottom of the page.
-
There are no signs of AI boosting profit margins for companies outside the tech sector, see chart below.
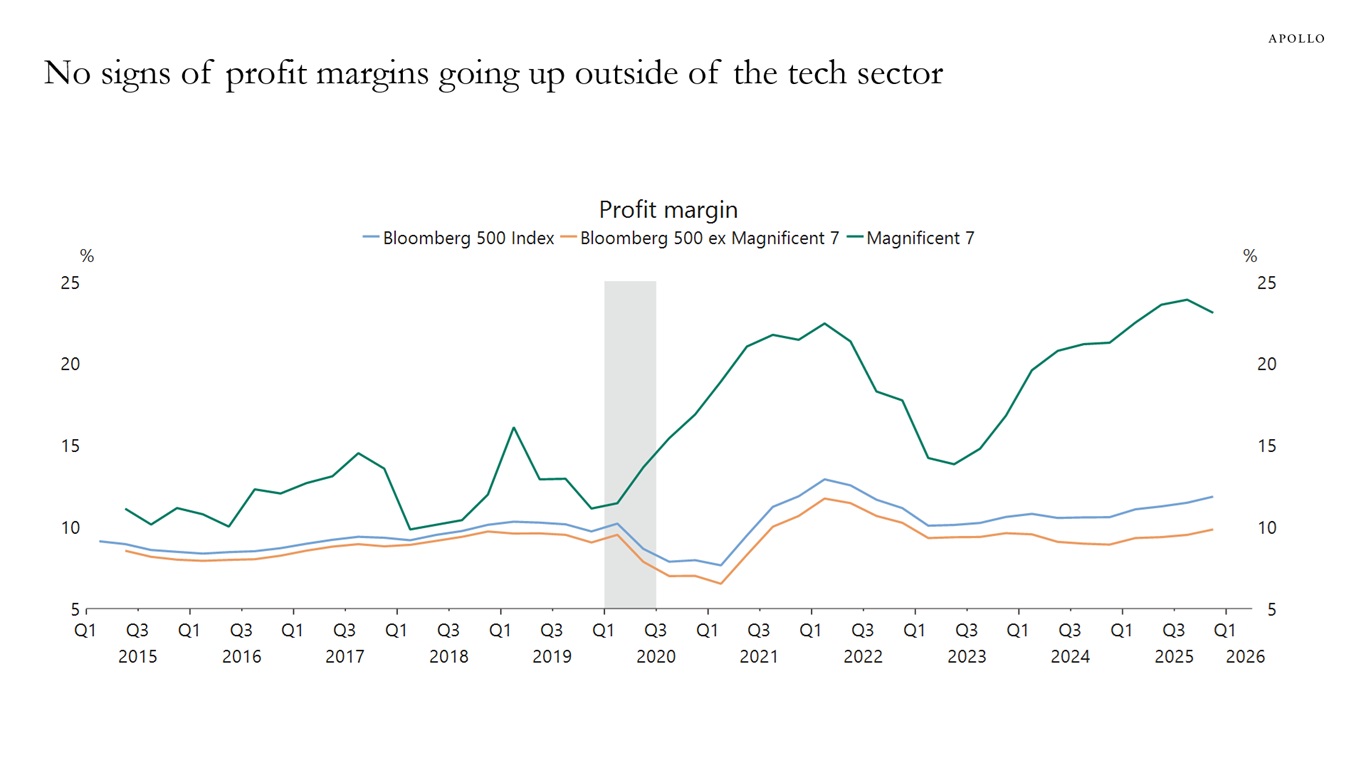
Sources: Bloomberg, Macrobond, Apollo Chief Economist See important disclaimers at the bottom of the page.
-
The incoming data has surprised significantly to the upside in recent weeks, but long rates have not moved higher, see chart below.
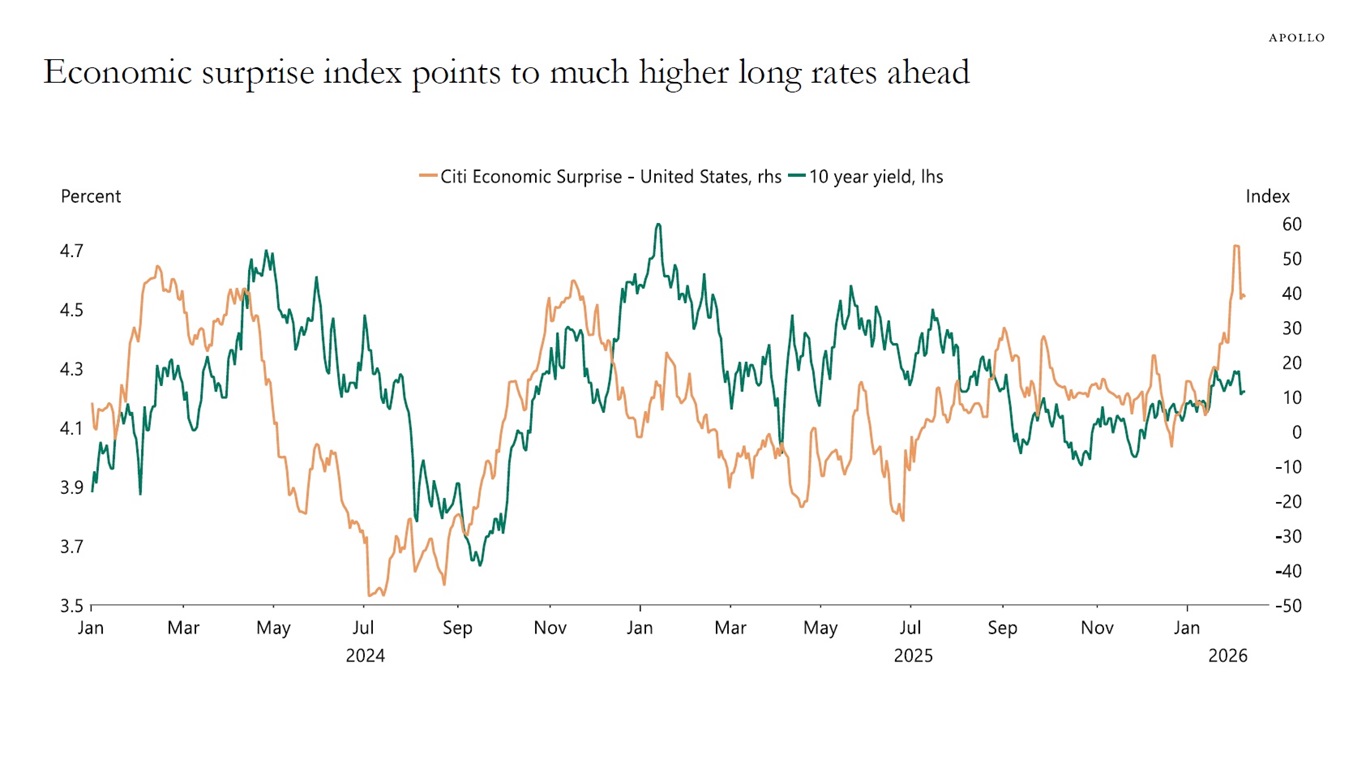
Sources: US Department of Treasury, Bloomberg, Macrobond, Apollo Chief Economist See important disclaimers at the bottom of the page.
-
The chart below shows consensus expectations for earnings for the Magnificent Seven and the S&P 493 since Liberation Day.
Earnings expectations for the Magnificent Seven have increased significantly. But expectations for earnings for the S&P 493 are basically unchanged.
The bottom line is that the consensus does not expect AI to improve profitability for corporate America outside the tech sector.
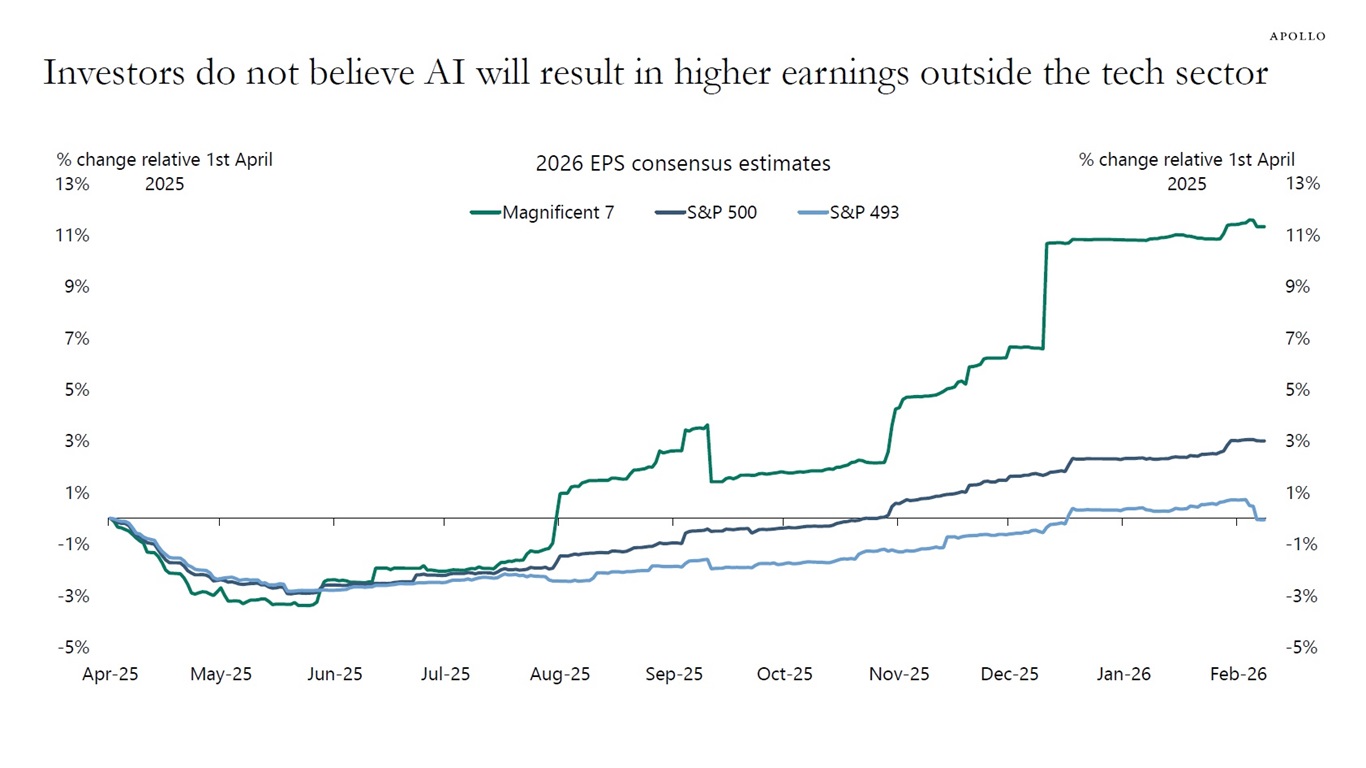
Sources: Bloomberg, Apollo Chief Economist See important disclaimers at the bottom of the page.
-
Much to the frustration of the quant community, when the Fed started raising interest rates in 2022, the strong correlation between gold and real rates broke down, see chart below.
It tells the market that when inflation and rates are high, investors begin to take other factors into consideration when they price future outcomes, and this has been particularly pronounced for the price of gold. In other words, quant models work best when inflation is stable at 2%, but this has not been the case since early 2021.
The bottom line is that new risks emerge when inflation is persistently above the Fed’s 2% target, which is where we continue to be today.
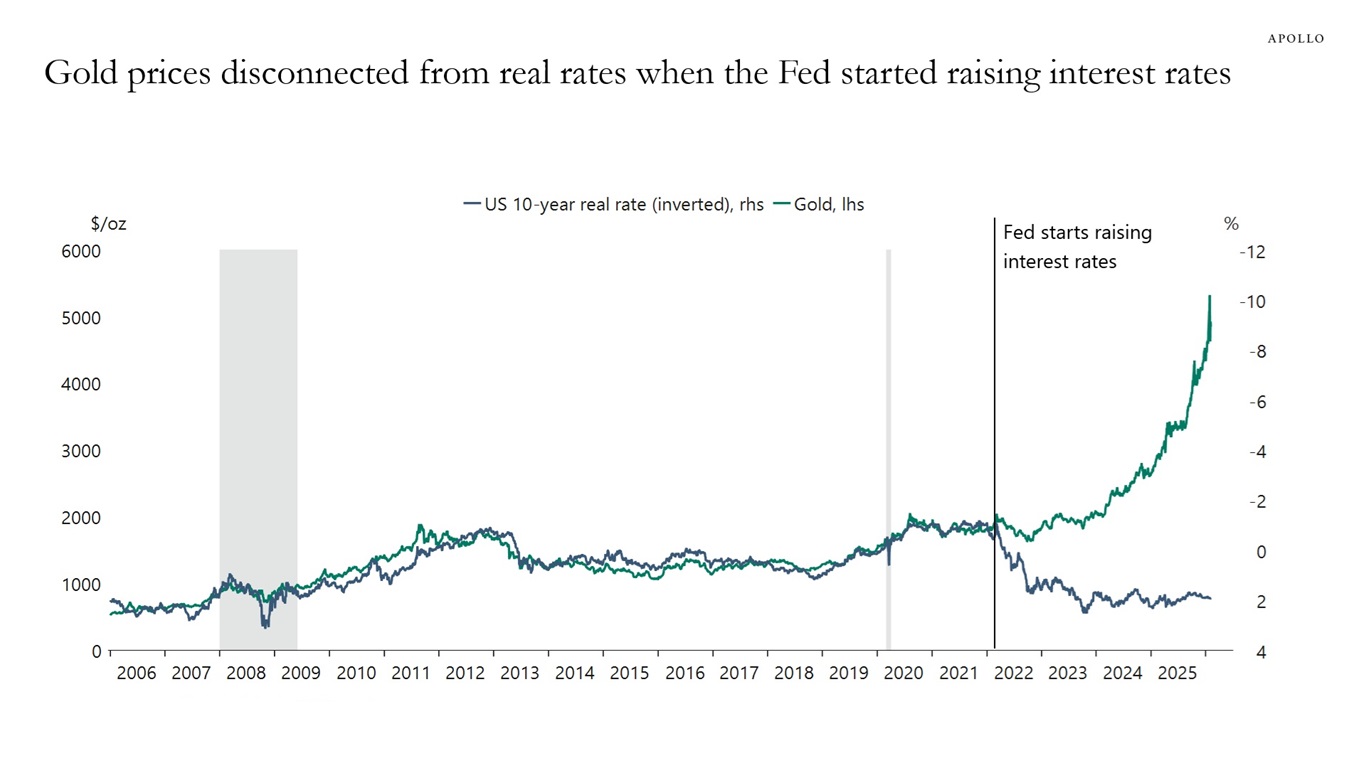
Sources: Bloomberg, Macrobond, Apollo Chief Economist See important disclaimers at the bottom of the page.
-
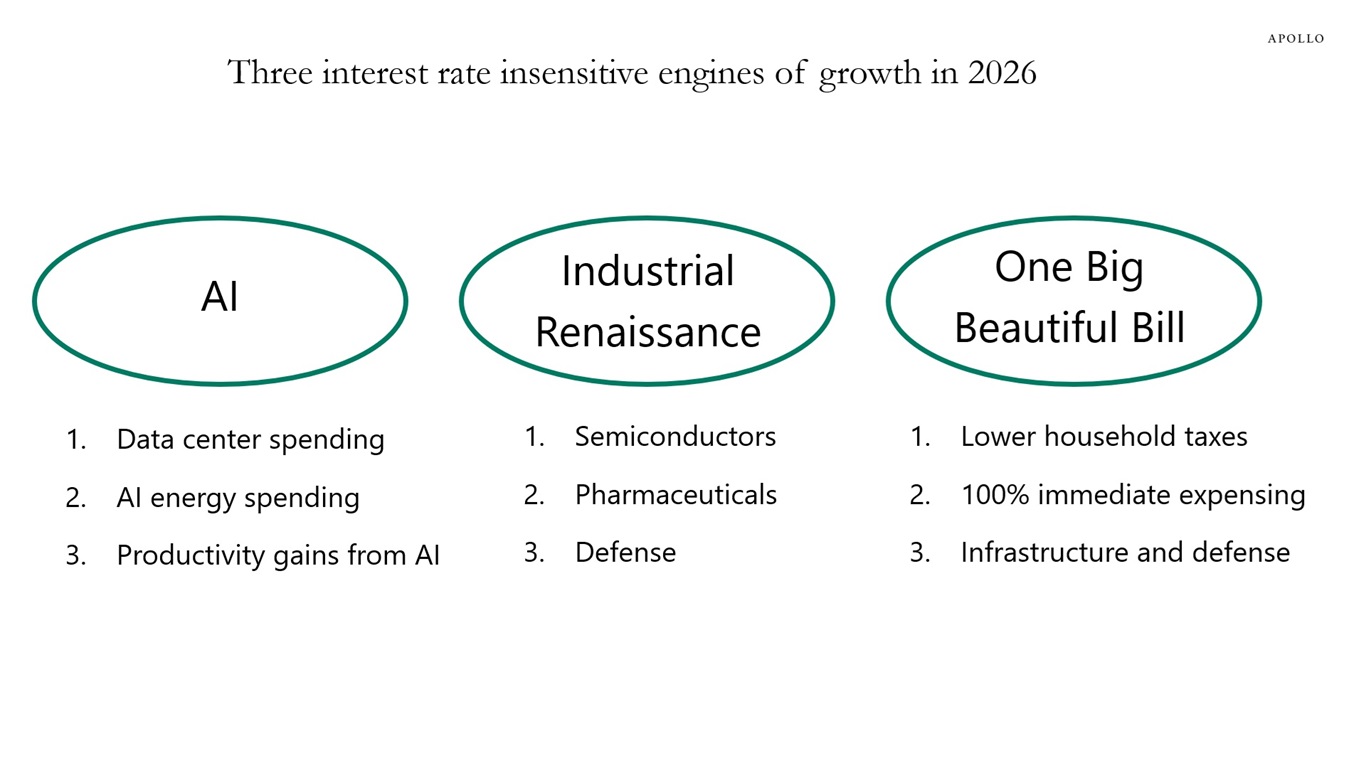
The problems in software will not become a macro problem because the underlying US economy is about to take off.
There are three strong tailwinds to growth over the coming quarters:
1. Many financings for data centers have already been committed for 2026.
2. There is strong political support for bringing back production facilities for semiconductors, pharmaceuticals and defense.
3. Fiscal policy is expansionary and will, according to the CBO, lift GDP growth this year by 0.9 percentage points.
The bottom line is that it is very difficult to be bearish on the US economic outlook, and later this year the conversation in markets will change from talking about Fed cuts to instead talking about the Fed having to hike.
If the Fed is unwilling to hike in response to an overheating economy, it would increase the risk of higher long rates, a steeper curve and a lower dollar.
Source: Apollo Chief Economist See important disclaimers at the bottom of the page.
-
Most of the time in financial markets is spent on discussing Nvidia, Apple and Coca-Cola, but these firms and the rest of the S&P 500 companies only make up a very small part of the US economy, see our chart book available here. For example, employment in S&P 500 companies is only 18% of total US employment. Similarly, capex by S&P 500 companies is only 21% of total capex in the US economy.
Facts about public markets and private markets
- Employment in S&P 500 companies is 18% of total US employment
- Employment in firms with more than 500 employees is 24.9 million, and total US employment is 160 million
- Privately owned firms account for almost 80% of job openings
- 81% of firms with revenues greater than $100 million are private
- Less than half of all corporate debt outstanding is from S&P 500 companies
- S&P 500 profits make up roughly half of economy-wide corporate profits
- Capex by S&P 500 companies is 21% of total capex in the US economy
Bottom line: Public markets are a small part of the overall economy.
See important disclaimers at the bottom of the page.
-
US GDP growth is accelerating because of the One Big Beautiful Bill, the AI boom and the ongoing industrial renaissance. As a result, inflation pressures are building, driven by higher wages, higher commodity prices and a weaker dollar, see charts below.
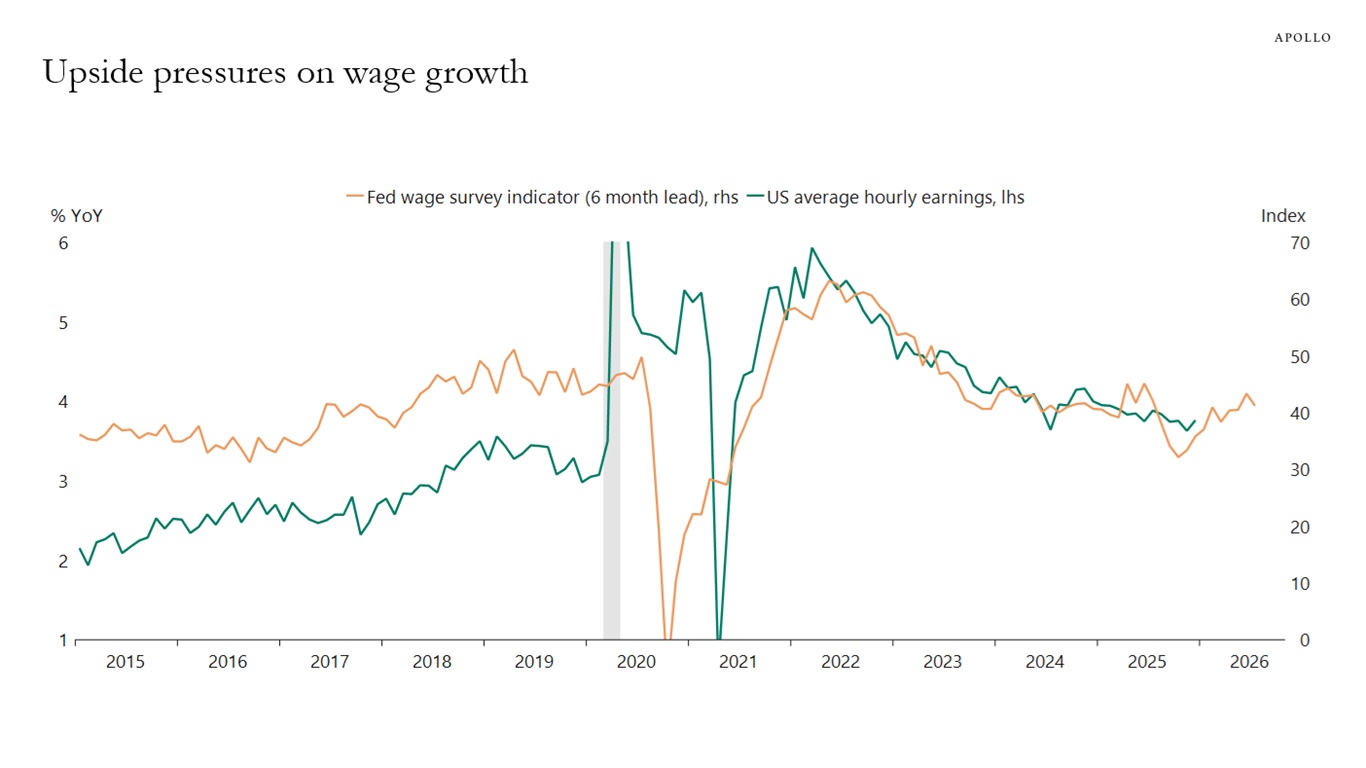
Note: Fed survey indicator is the average of New York Fed, Philadelphia Fed, Dallas Fed, Kansas City Fed and Richmond Fed surveys. Sources: US Bureau of Labor Statistics (BLS), Macrobond, Apollo Chief Economist 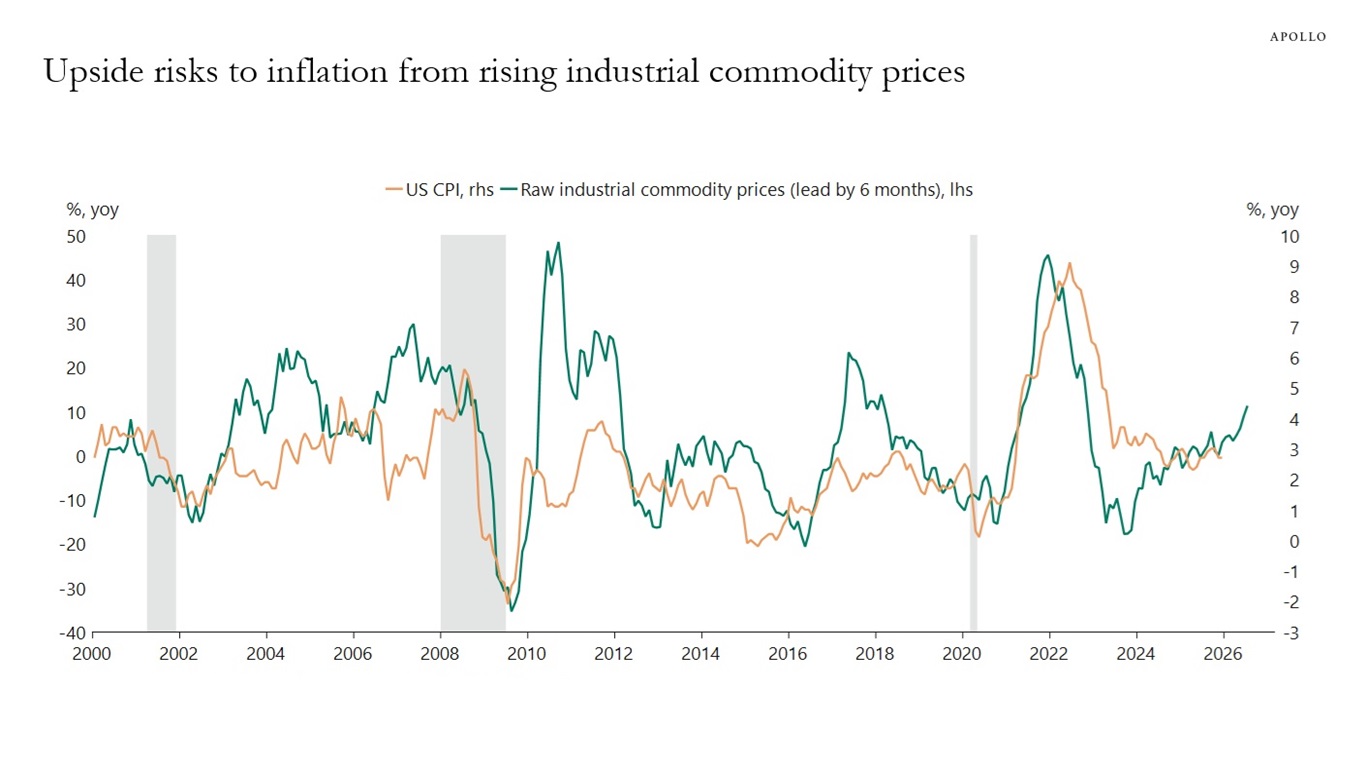
Sources: BLS, Commodity Research Bureau, Bloomberg, Macrobond, Apollo Chief Economist 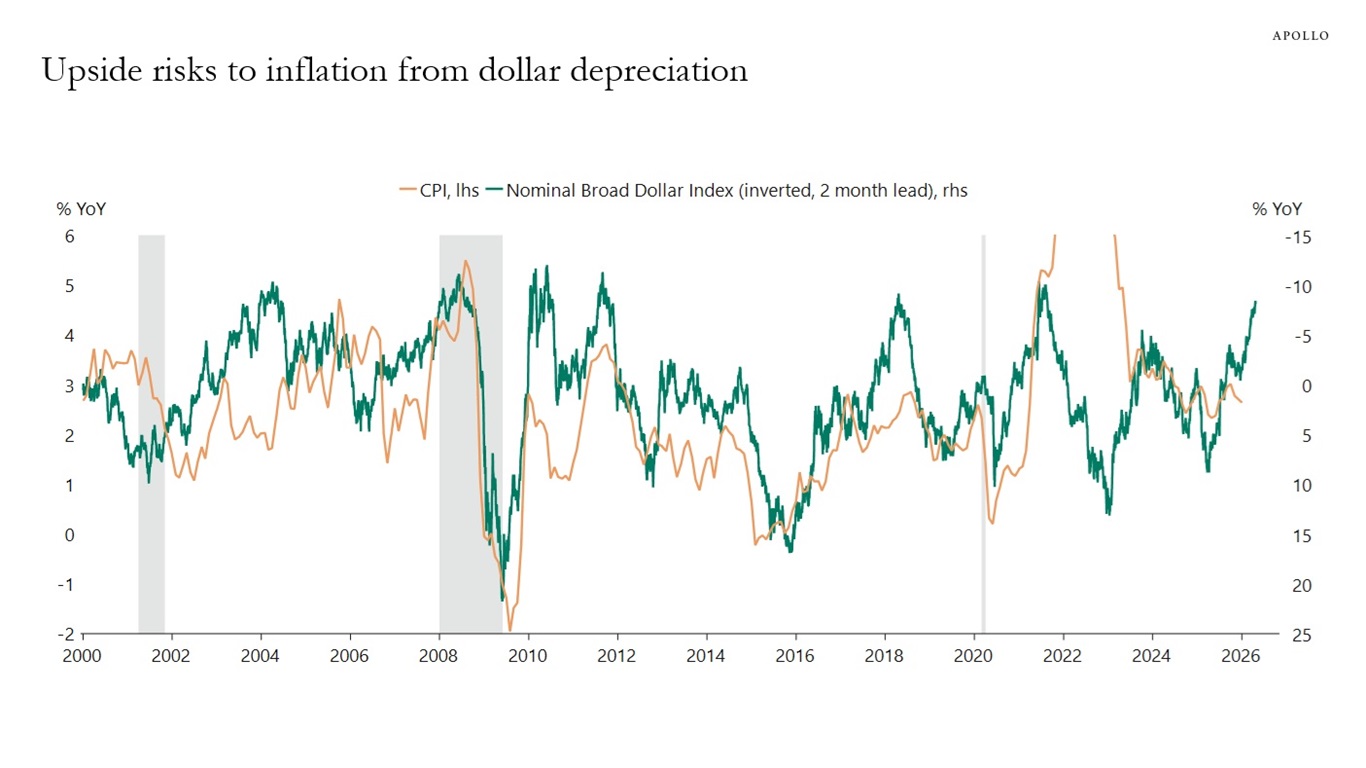
Sources: Federal Reserve, US Bureau of Labor Statistics (BLS), Macrobond, Apollo Chief Economist See important disclaimers at the bottom of the page.

This presentation may not be distributed, transmitted or otherwise communicated to others in whole or in part without the express consent of Apollo Global Management, Inc. (together with its subsidiaries, “Apollo”).
Apollo makes no representation or warranty, expressed or implied, with respect to the accuracy, reasonableness, or completeness of any of the statements made during this presentation, including, but not limited to, statements obtained from third parties. Opinions, estimates and projections constitute the current judgment of the speaker as of the date indicated. They do not necessarily reflect the views and opinions of Apollo and are subject to change at any time without notice. Apollo does not have any responsibility to update this presentation to account for such changes. There can be no assurance that any trends discussed during this presentation will continue.
Statements made throughout this presentation are not intended to provide, and should not be relied upon for, accounting, legal or tax advice and do not constitute an investment recommendation or investment advice. Investors should make an independent investigation of the information discussed during this presentation, including consulting their tax, legal, accounting or other advisors about such information. Apollo does not act for you and is not responsible for providing you with the protections afforded to its clients. This presentation does not constitute an offer to sell, or the solicitation of an offer to buy, any security, product or service, including interest in any investment product or fund or account managed or advised by Apollo.
Certain statements made throughout this presentation may be “forward-looking” in nature. Due to various risks and uncertainties, actual events or results may differ materially from those reflected or contemplated in such forward-looking information. As such, undue reliance should not be placed on such statements. Forward-looking statements may be identified by the use of terminology including, but not limited to, “may”, “will”, “should”, “expect”, “anticipate”, “target”, “project”, “estimate”, “intend”, “continue” or “believe” or the negatives thereof or other variations thereon or comparable terminology.