


Want it delivered daily to your inbox?
-
Demand for housing is slowing because of high home prices, high mortgage rates and declining immigration.
Housing supply is steady because existing homeowners are reluctant to sell their homes, since they’re locked into lower mortgage rates and don’t want to take on higher ones. Housing supply of new homes is rising.
The bottom line is that falling demand and rising supply are putting downward pressure on home prices.
Our latest US housing outlook is available here.
See important disclaimers at the bottom of the page.
-
The IMF estimates that fiscal policy will boost growth by 1% in Germany and 0.5% in Japan in 2026. The CBO estimates that the One Big Beautiful Bill will boost US growth by 0.9%. The bottom line is that fiscal policy in the G3 will be very expansionary over the coming quarters, see chart below.
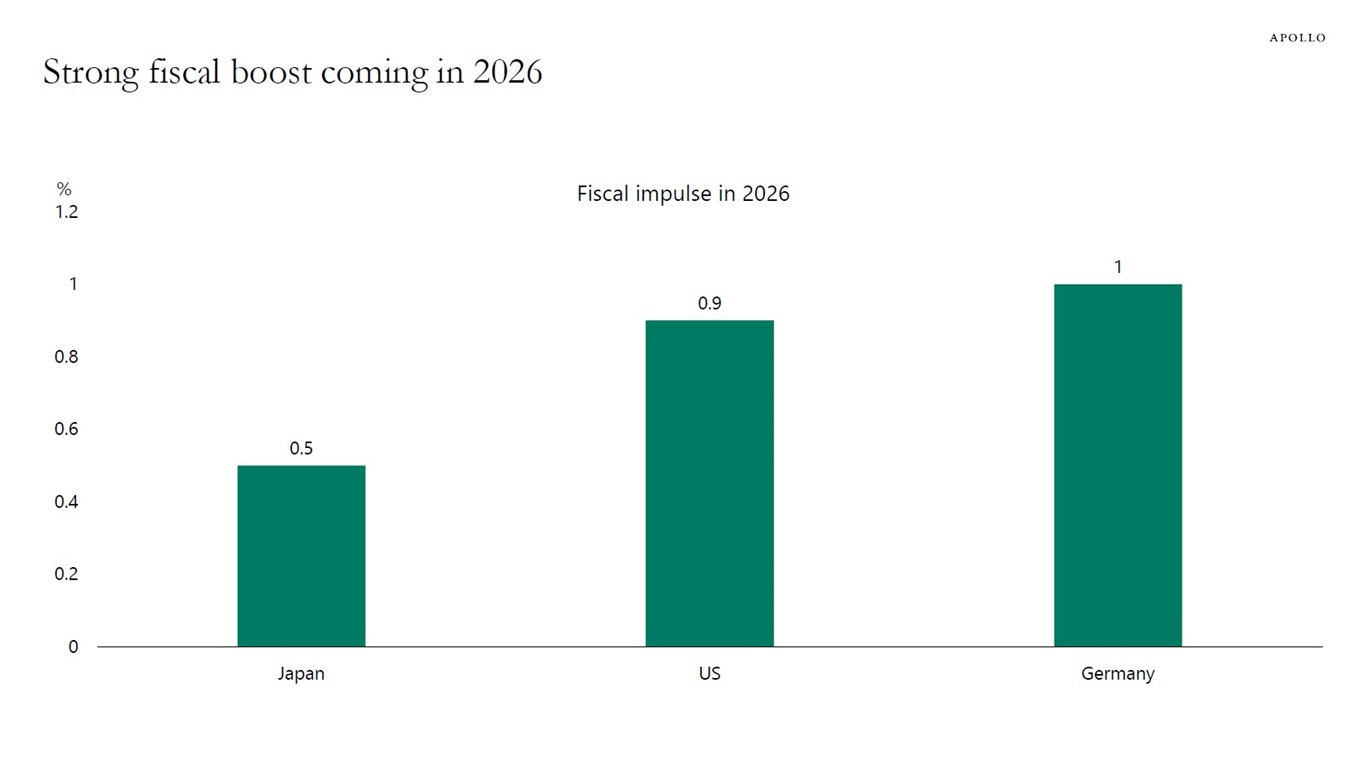
Note: Fiscal impulse calculated using cyclically adjusted primary balance for Japan and Germany, and the estimated Impact of the OBBBA from the CBO. Sources: IMF Fiscal Monitor, CBO, Haver Analytics, Apollo Chief Economist See important disclaimers at the bottom of the page.
-
Venezuela’s self-reported crude oil reserves tripled from around 100 billion barrels in the early 2000s to 300 billion barrels in the late 2000s due to the reclassification of Orinoco Belt heavy oil as “proved,” see the first chart below. Much of the oil is extra-heavy, which has low recovery and a high cost to produce. There was no large new discovery or production increase to justify a tripling of reserves through exploration alone, see the second chart.
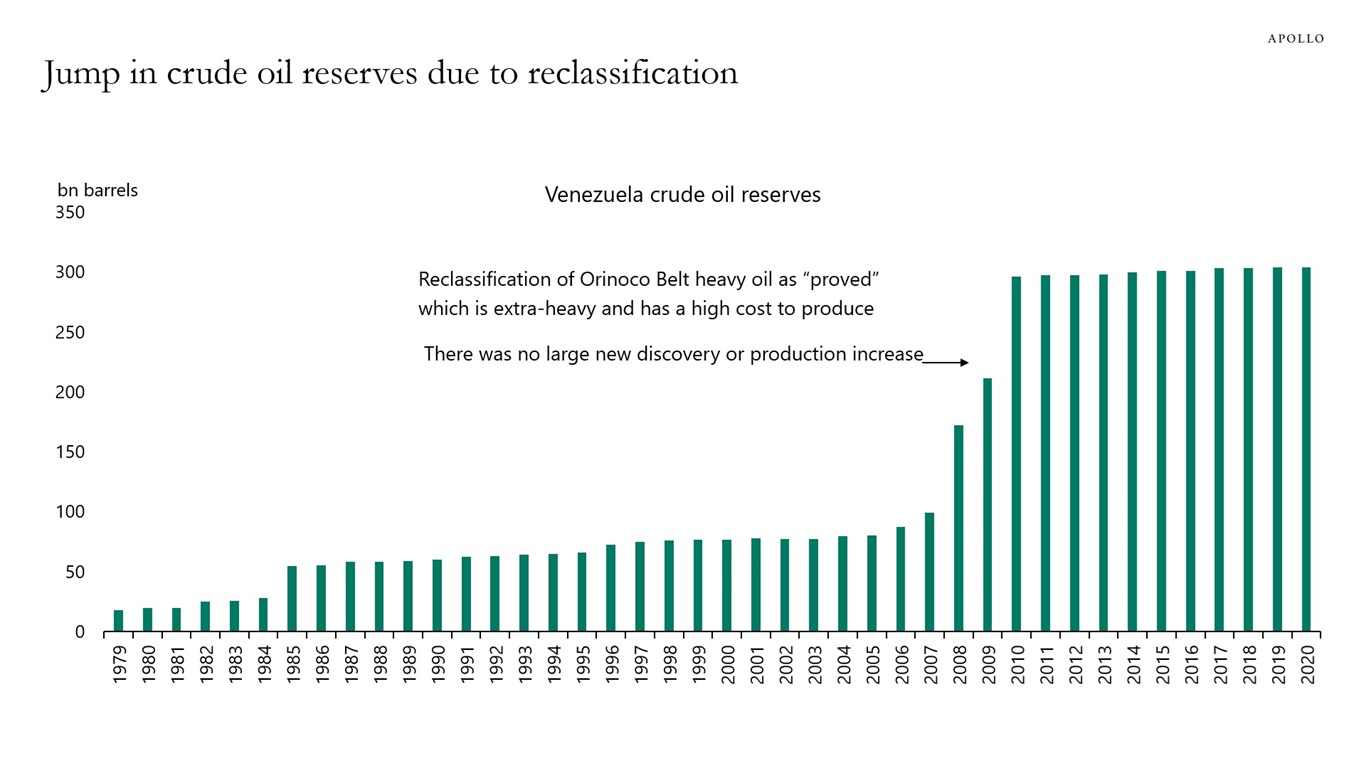
Sources: BP Statistical Review, Bloomberg 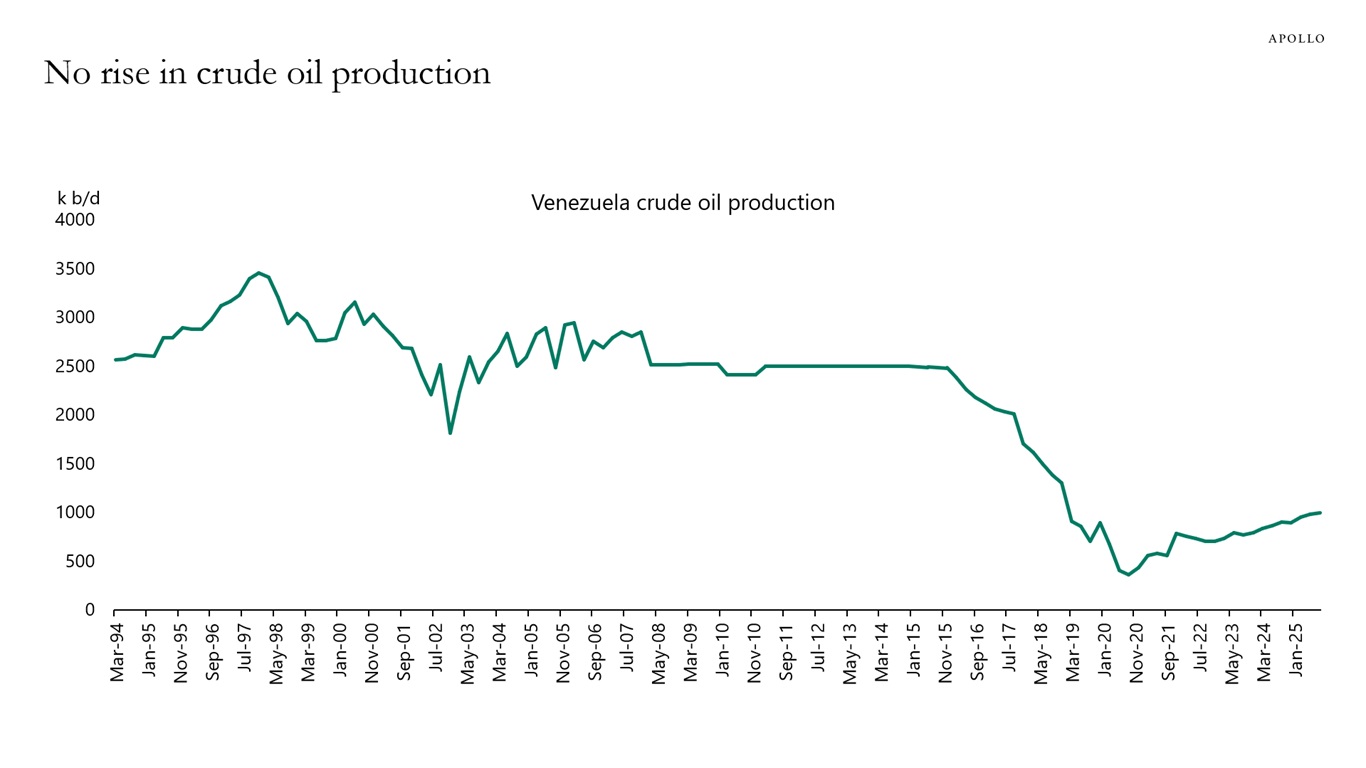
Sources: DOE, Bloomberg See important disclaimers at the bottom of the page.
-
Data for bank lending points to a gradual recovery in the US and Europe, see chart below.
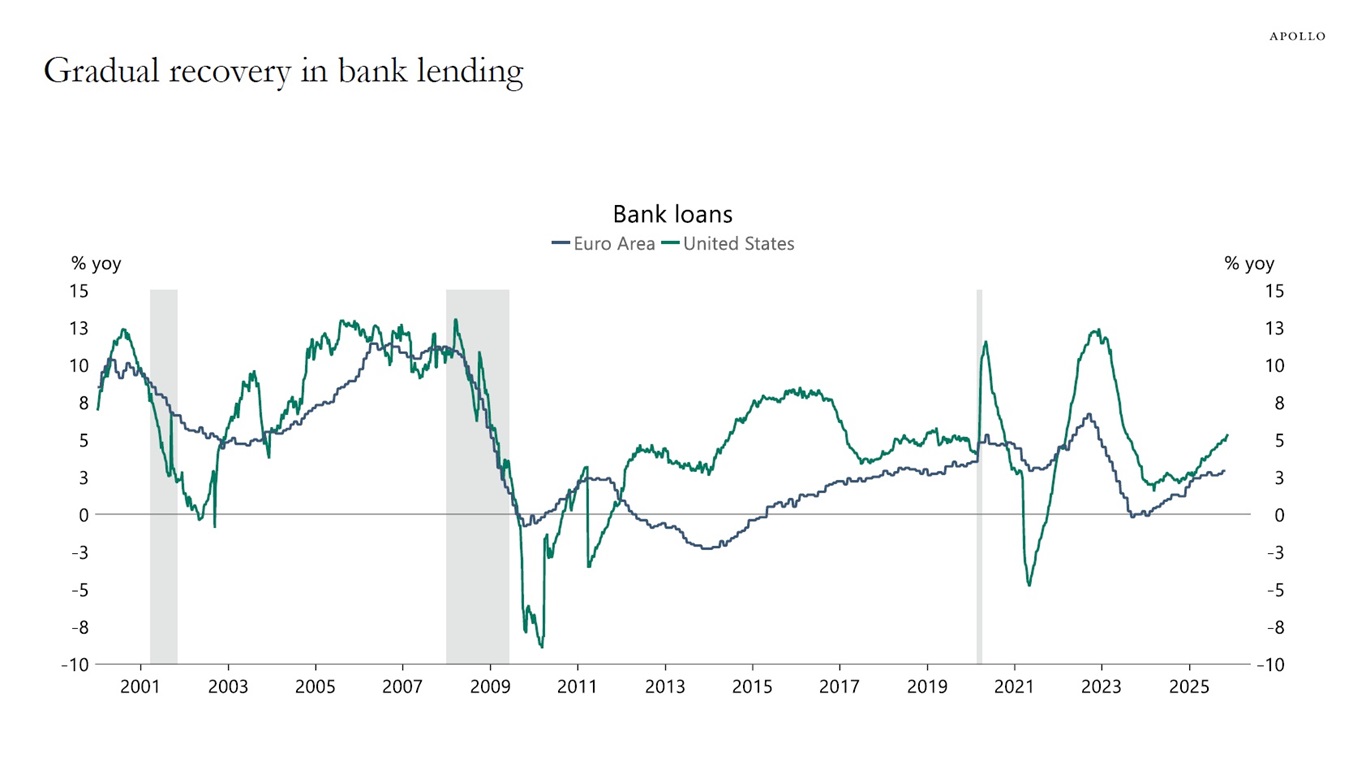
Sources: Federal Reserve, Macrobond, Apollo Chief Economist See important disclaimers at the bottom of the page.
-
Forty percent of US homes don’t have a mortgage, up from 33% in 2010, see chart below.
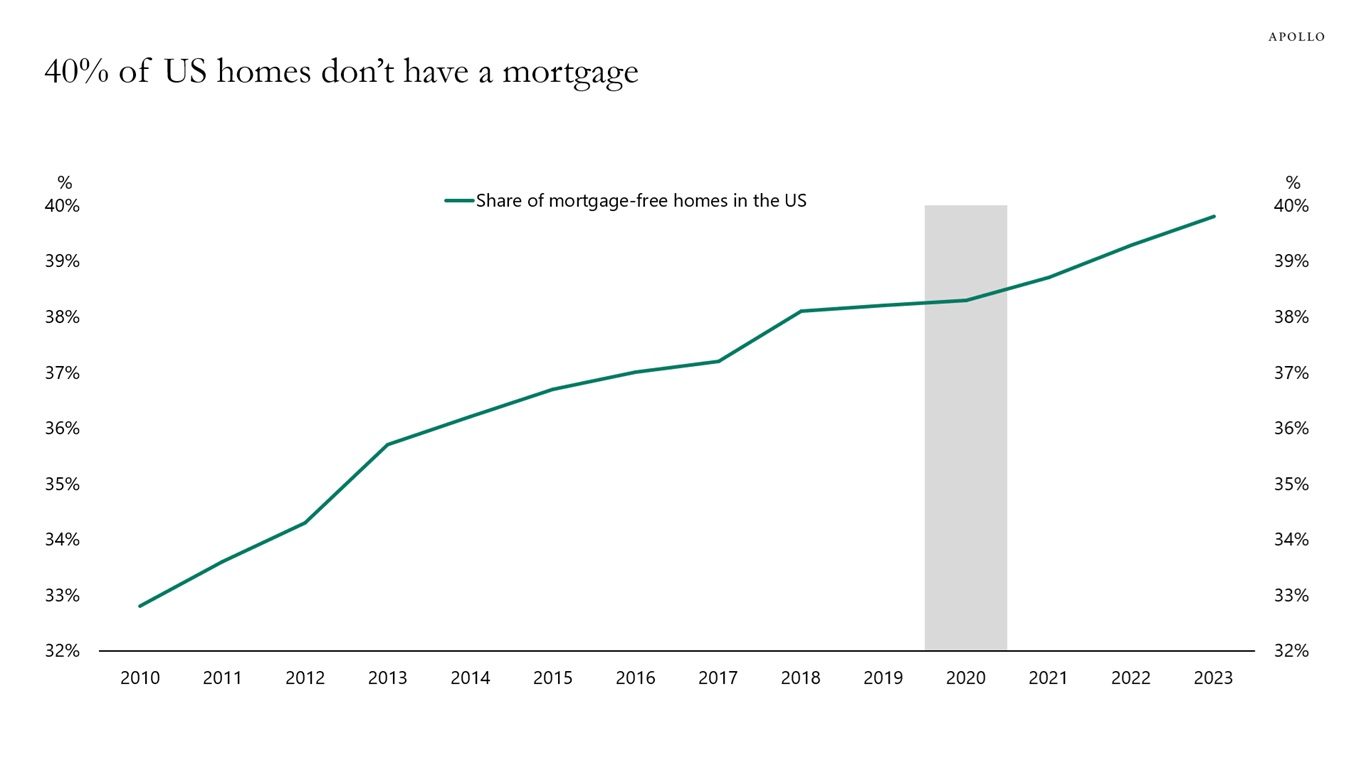
Sources: US Census Bureau, Bloomberg, Apollo Chief Economist See important disclaimers at the bottom of the page.
-
Retail demand for gold has exploded over the past year, see chart below.
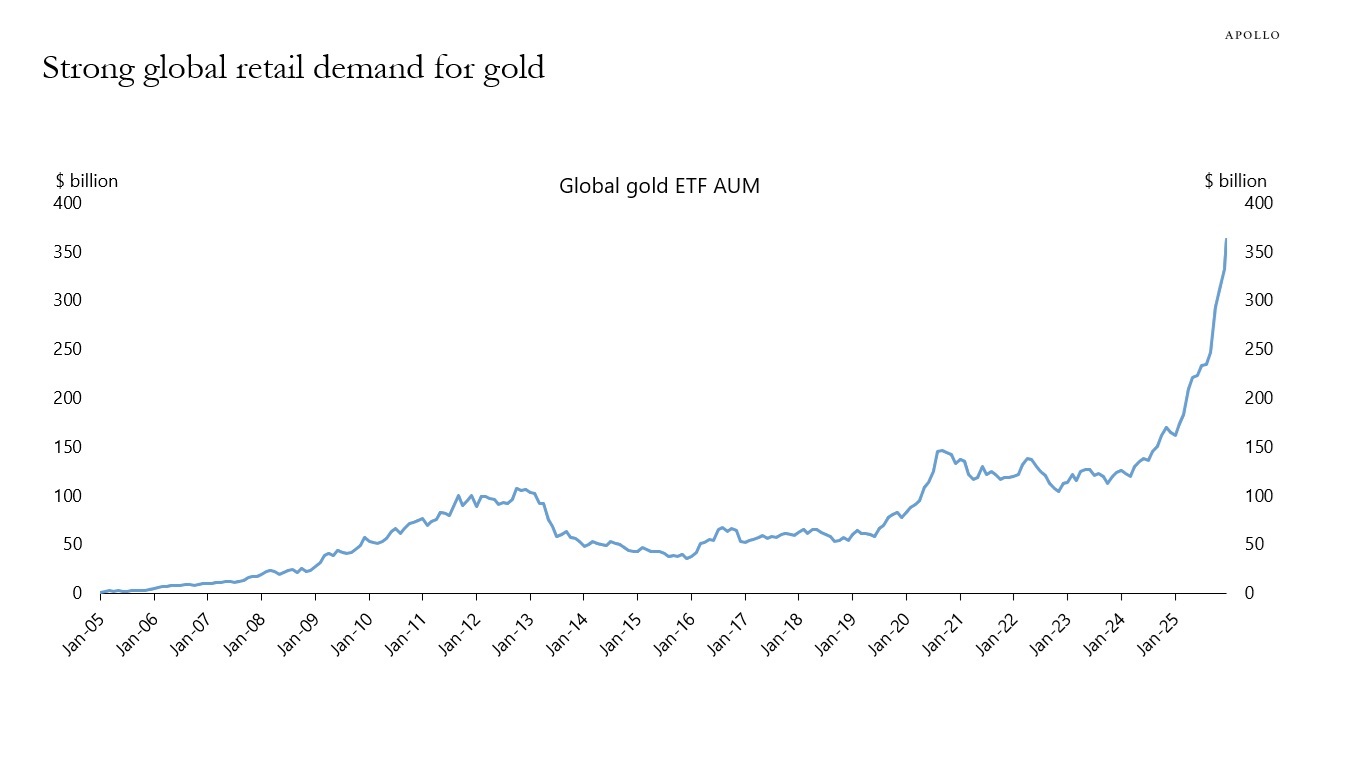
Sources: Bloomberg, Apollo Chief Economist See important disclaimers at the bottom of the page.
-
The median age of companies going public has increased to 14 years, see chart below.
With more companies staying private for longer, and in some cases staying private forever, there is a bigger need for private markets in debt and equity.
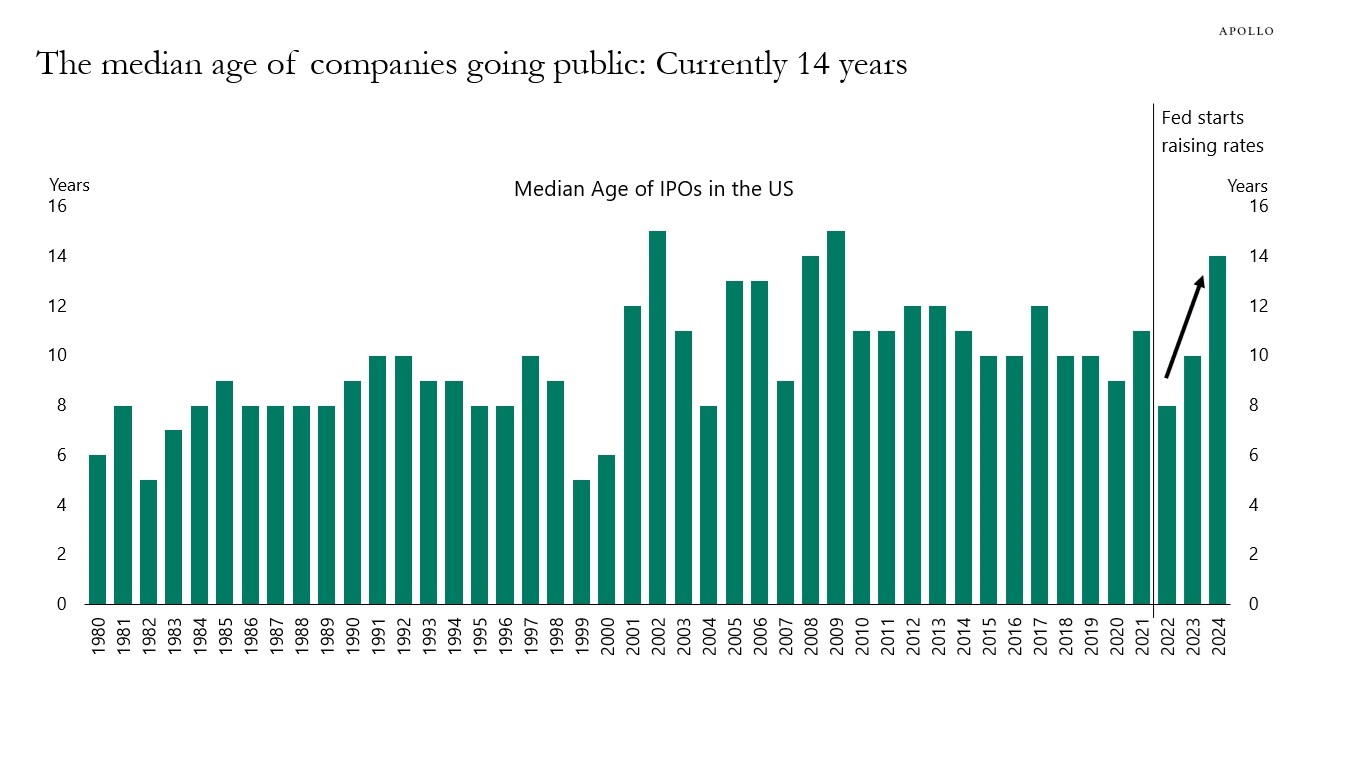
Sources: Jay Ritter, University of Florida, Apollo Chief Economist See important disclaimers at the bottom of the page.
-
Weekly data for GDP and same-store retail sales are showing no signs of a slowdown in the US economy, see charts below.
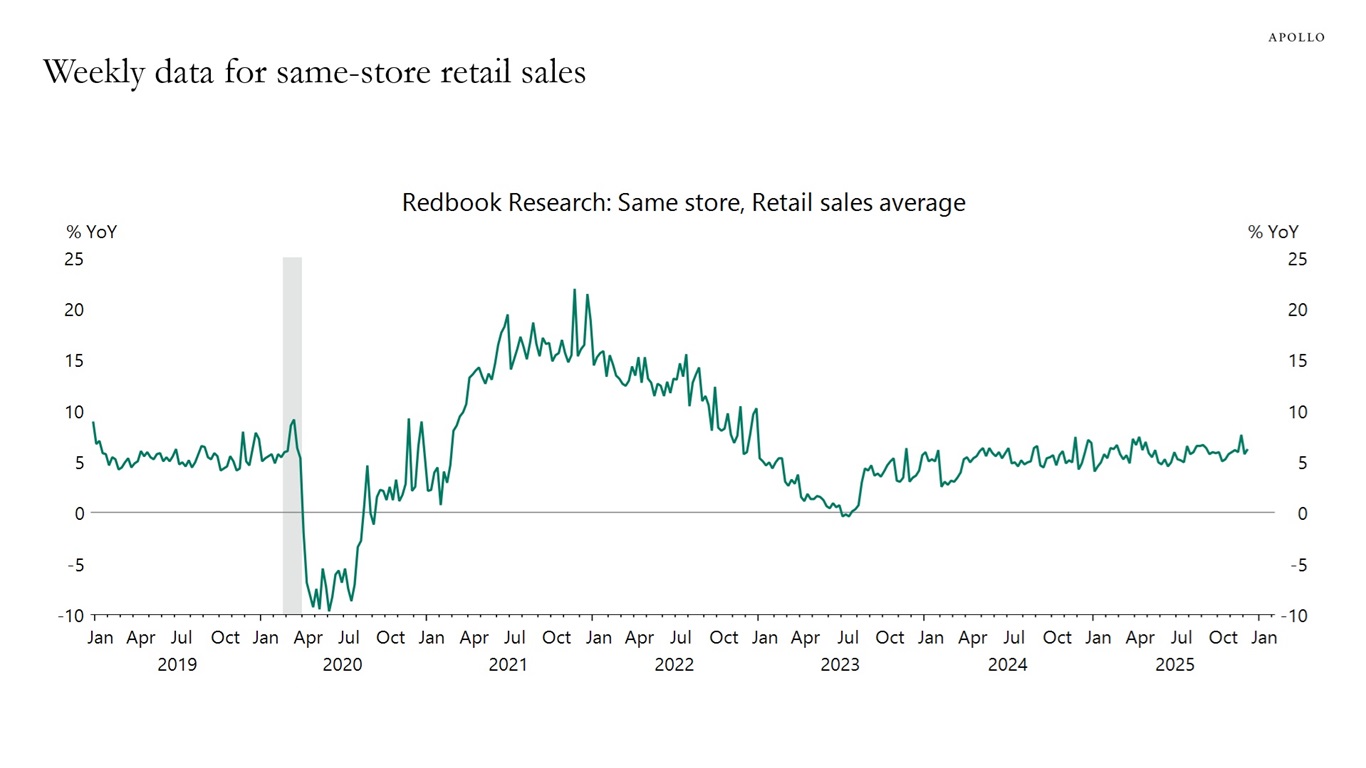
Sources: Redbook Research Inc., Macrobond, Apollo Chief Economist 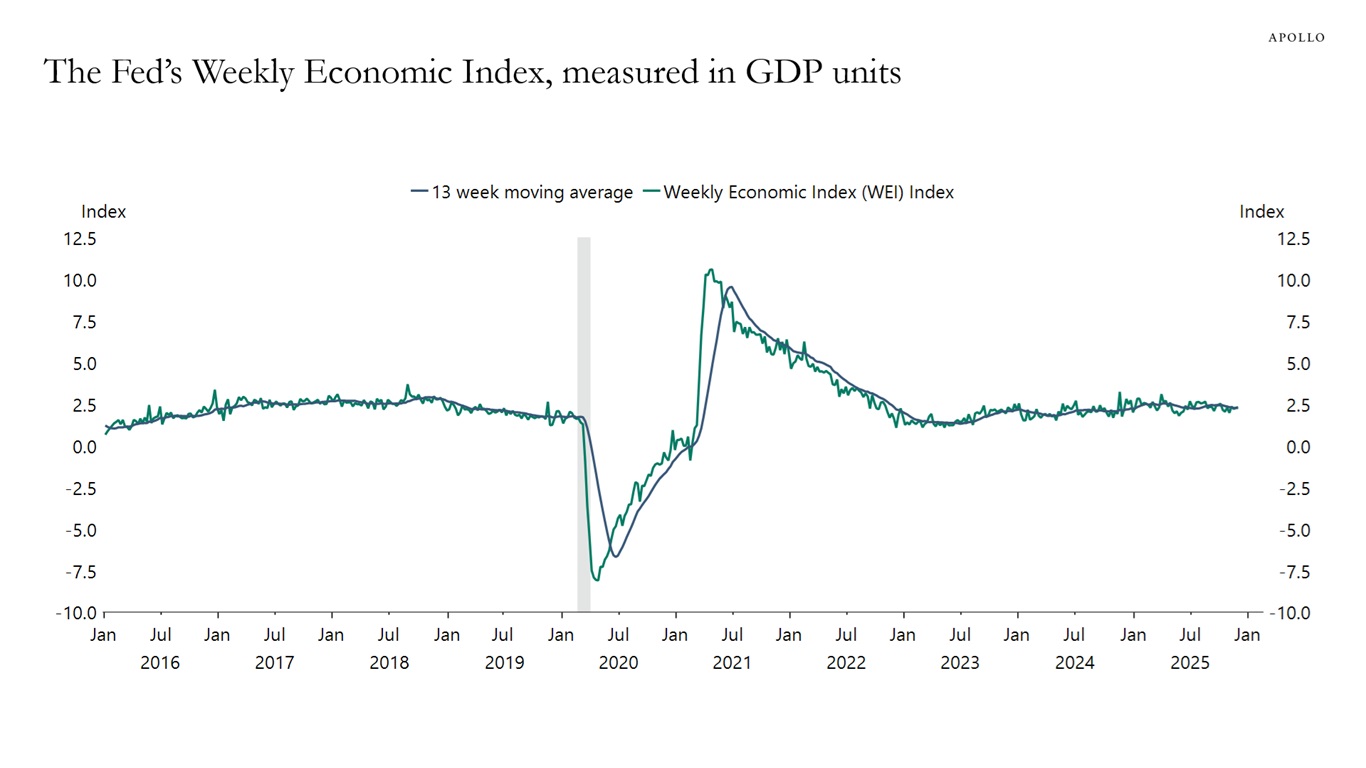
Sources: Federal Reserve Bank of Dallas, Macrobond, Apollo Chief Economist Explore the full 2026 Outlook, featuring our macro view and expert perspectives across regions and asset classes, at apollo.com/outlook.
See important disclaimers at the bottom of the page.
-
Not only are default rates trending lower, but the number of distressed exchanges has also started declining, see chart below.

Sources: PitchBook, Apollo Chief Economist Explore the full 2026 Outlook, featuring our macro view and expert perspectives across regions and asset classes, at apollo.com/outlook.
See important disclaimers at the bottom of the page.
-
When discussing affordability, it is important to note that while the CPI price level has increased 26% since 2019, wages have increased 30%, see chart below.
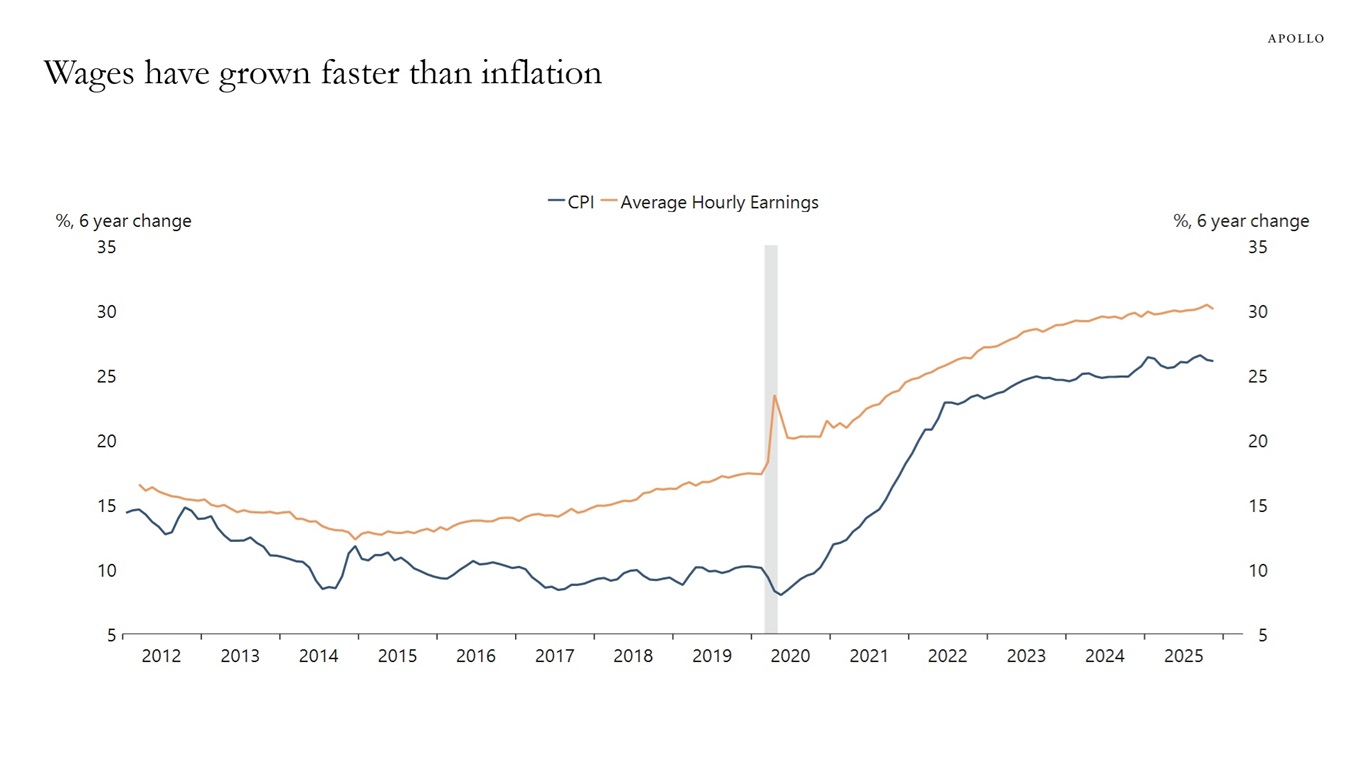
Sources: US Bureau of Labor Statistics (BLS), Macrobond, Apollo Chief Economist Explore the full 2026 Outlook, featuring our macro view and expert perspectives across regions and asset classes, at apollo.com/outlook.
See important disclaimers at the bottom of the page.

This presentation may not be distributed, transmitted or otherwise communicated to others in whole or in part without the express consent of Apollo Global Management, Inc. (together with its subsidiaries, “Apollo”).
Apollo makes no representation or warranty, expressed or implied, with respect to the accuracy, reasonableness, or completeness of any of the statements made during this presentation, including, but not limited to, statements obtained from third parties. Opinions, estimates and projections constitute the current judgment of the speaker as of the date indicated. They do not necessarily reflect the views and opinions of Apollo and are subject to change at any time without notice. Apollo does not have any responsibility to update this presentation to account for such changes. There can be no assurance that any trends discussed during this presentation will continue.
Statements made throughout this presentation are not intended to provide, and should not be relied upon for, accounting, legal or tax advice and do not constitute an investment recommendation or investment advice. Investors should make an independent investigation of the information discussed during this presentation, including consulting their tax, legal, accounting or other advisors about such information. Apollo does not act for you and is not responsible for providing you with the protections afforded to its clients. This presentation does not constitute an offer to sell, or the solicitation of an offer to buy, any security, product or service, including interest in any investment product or fund or account managed or advised by Apollo.
Certain statements made throughout this presentation may be “forward-looking” in nature. Due to various risks and uncertainties, actual events or results may differ materially from those reflected or contemplated in such forward-looking information. As such, undue reliance should not be placed on such statements. Forward-looking statements may be identified by the use of terminology including, but not limited to, “may”, “will”, “should”, “expect”, “anticipate”, “target”, “project”, “estimate”, “intend”, “continue” or “believe” or the negatives thereof or other variations thereon or comparable terminology.