


The Daily Spark is moving to Apollo.com— read the latest from Torsten Slok here.
Want it delivered daily to your inbox?
-
There is a major gap opening up between the mean and the median of long-term inflation expectations, which means that half of the population has long-term inflation expectations that are dramatically higher than the other half, see charts below and in this chart book. This is a very significant challenge for the Fed because it cannot cut interest rates when inflation expectations are out of control.
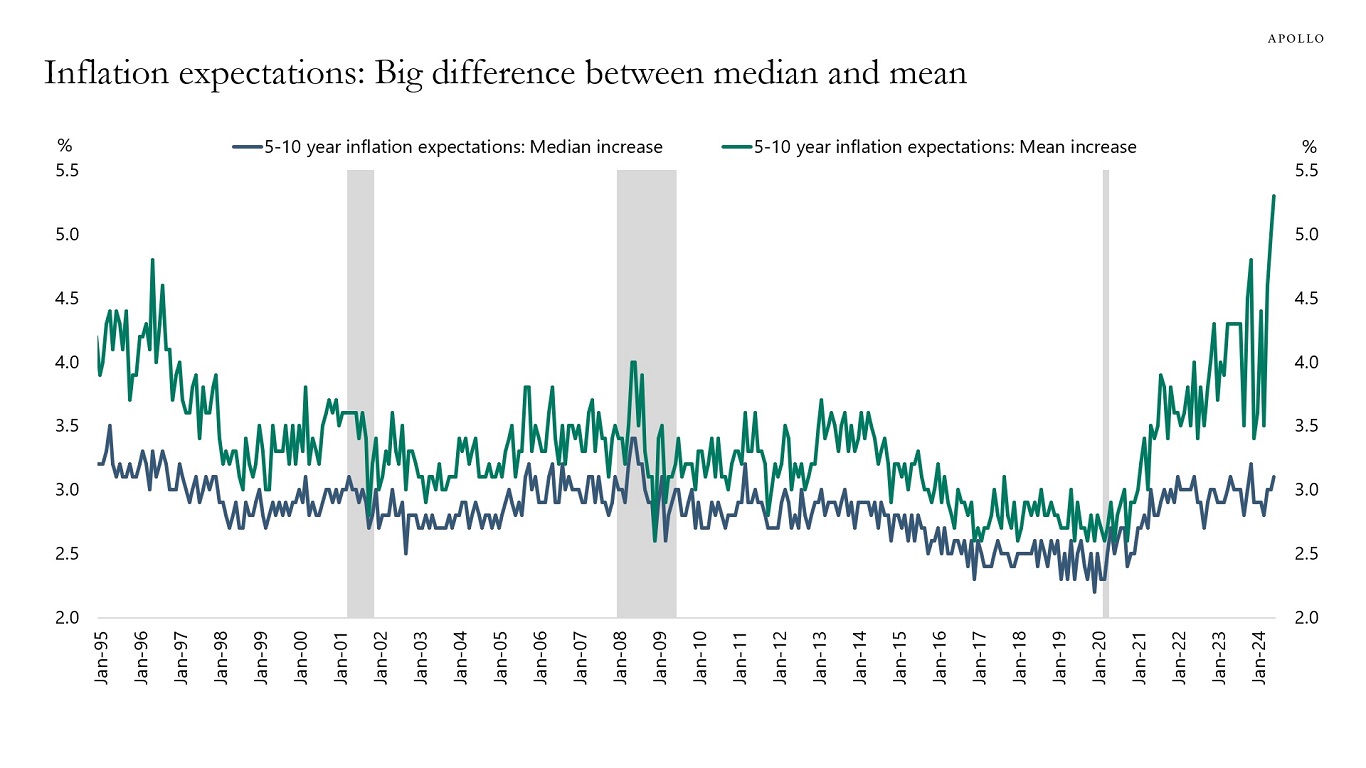
Source: University of Michigan, Haver Analytics, Apollo Chief Economist 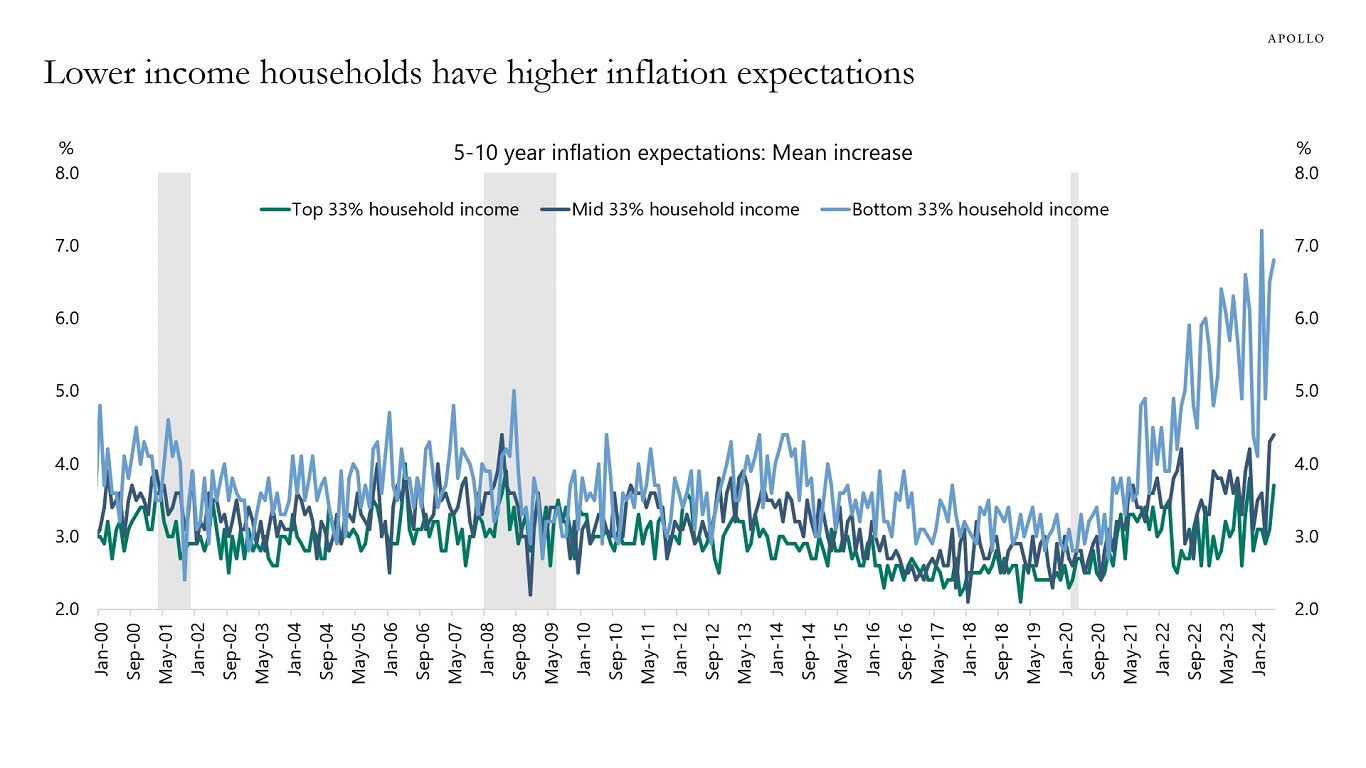
Source: University of Michigan, Haver Analytics, Apollo Chief Economist 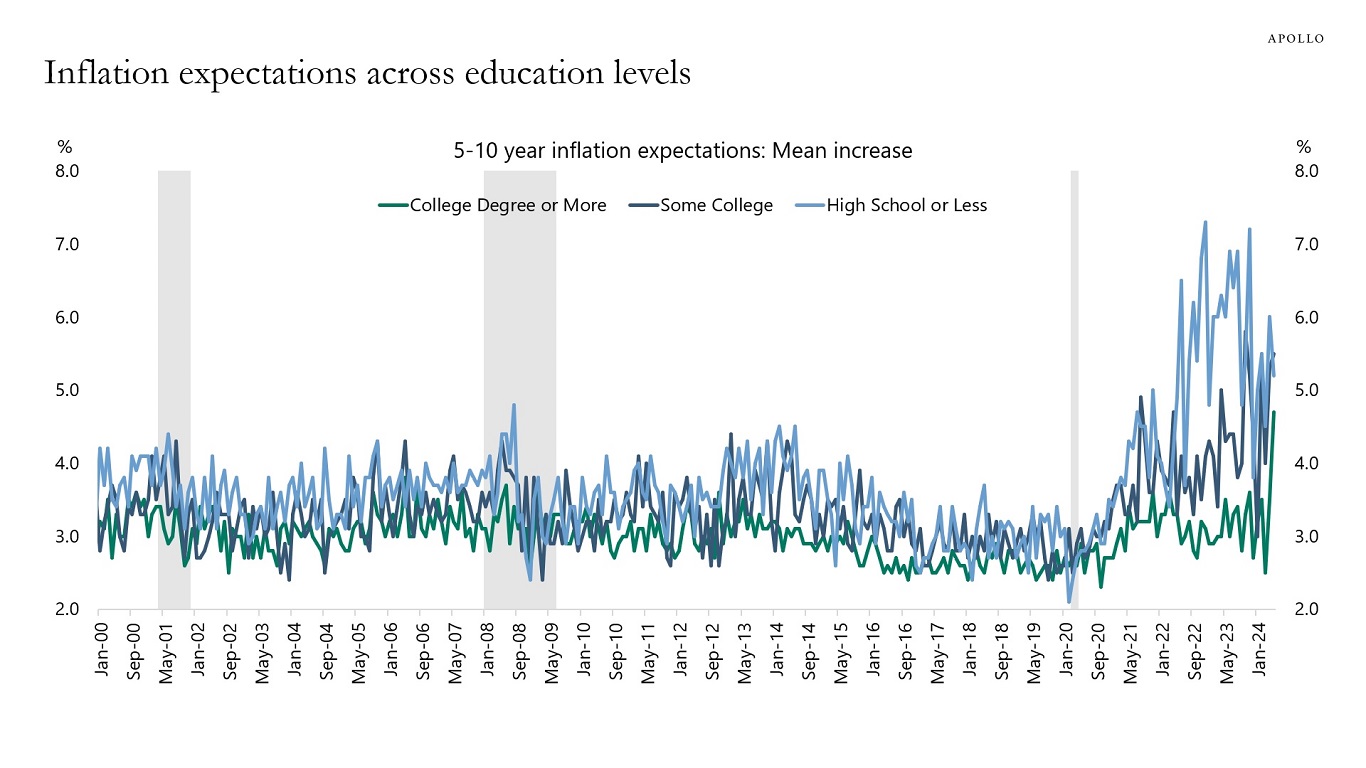
Source: University of Michigan, Haver Analytics, Apollo Chief Economist 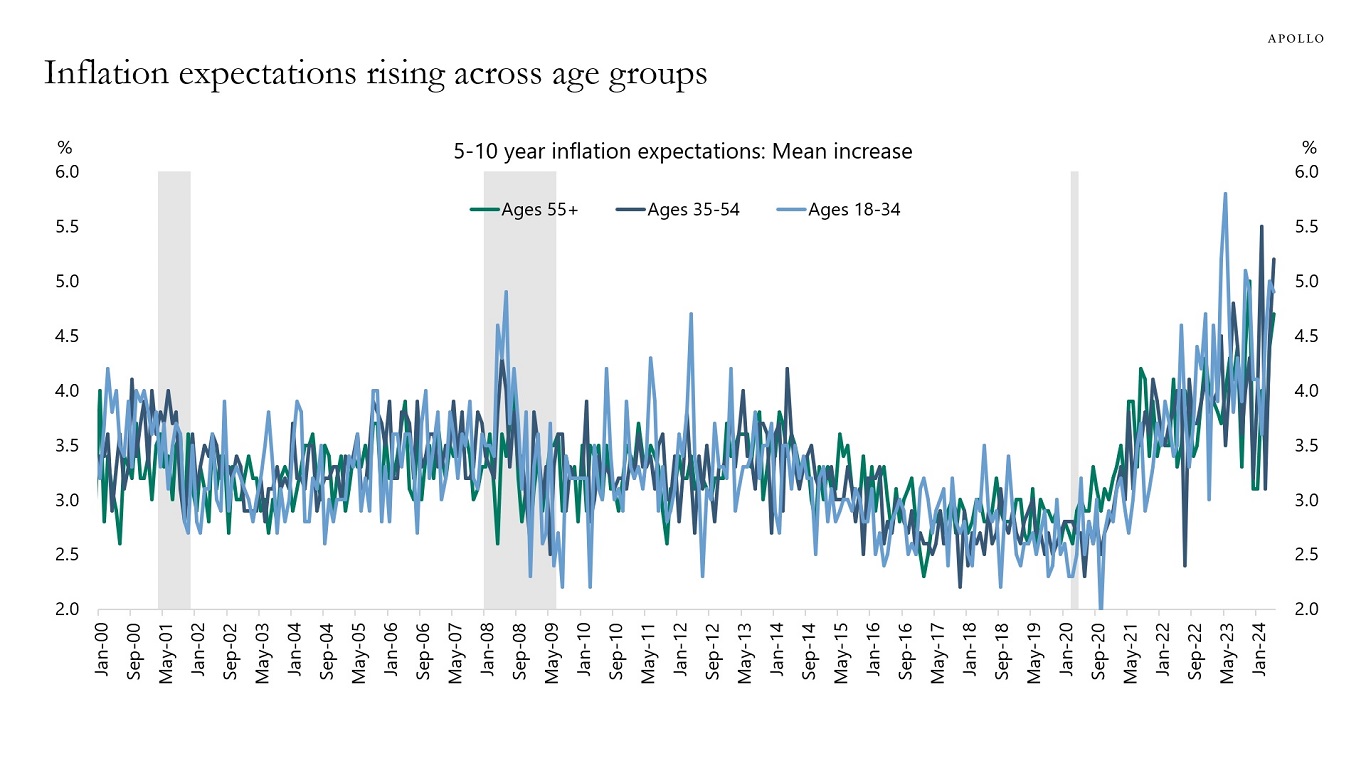
Source: University of Michigan, Haver Analytics, Apollo Chief Economist 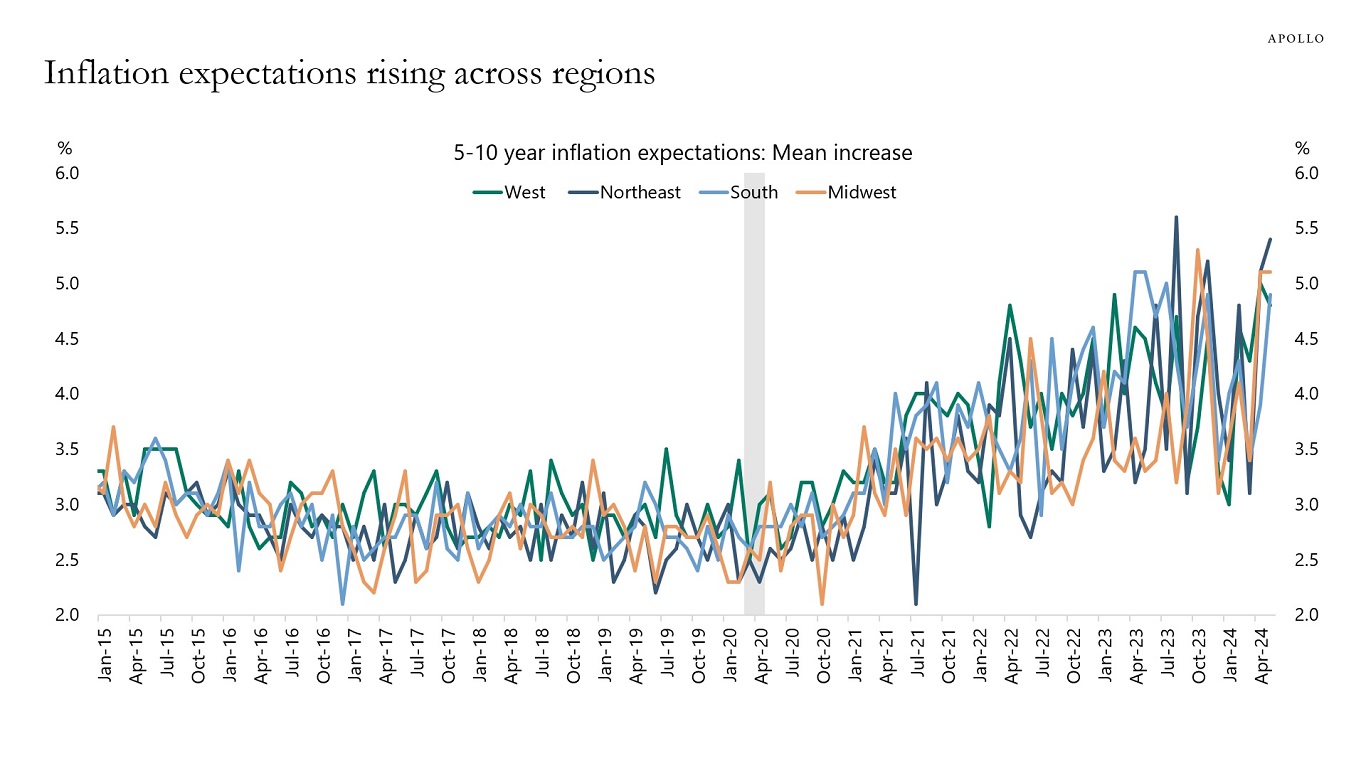
Source: University of Michigan, Haver Analytics, Apollo Chief Economist See important disclaimers at the bottom of the page.
-
Since the Fed started talking about rate cuts, households have turned more and more positive on equities, see chart below.
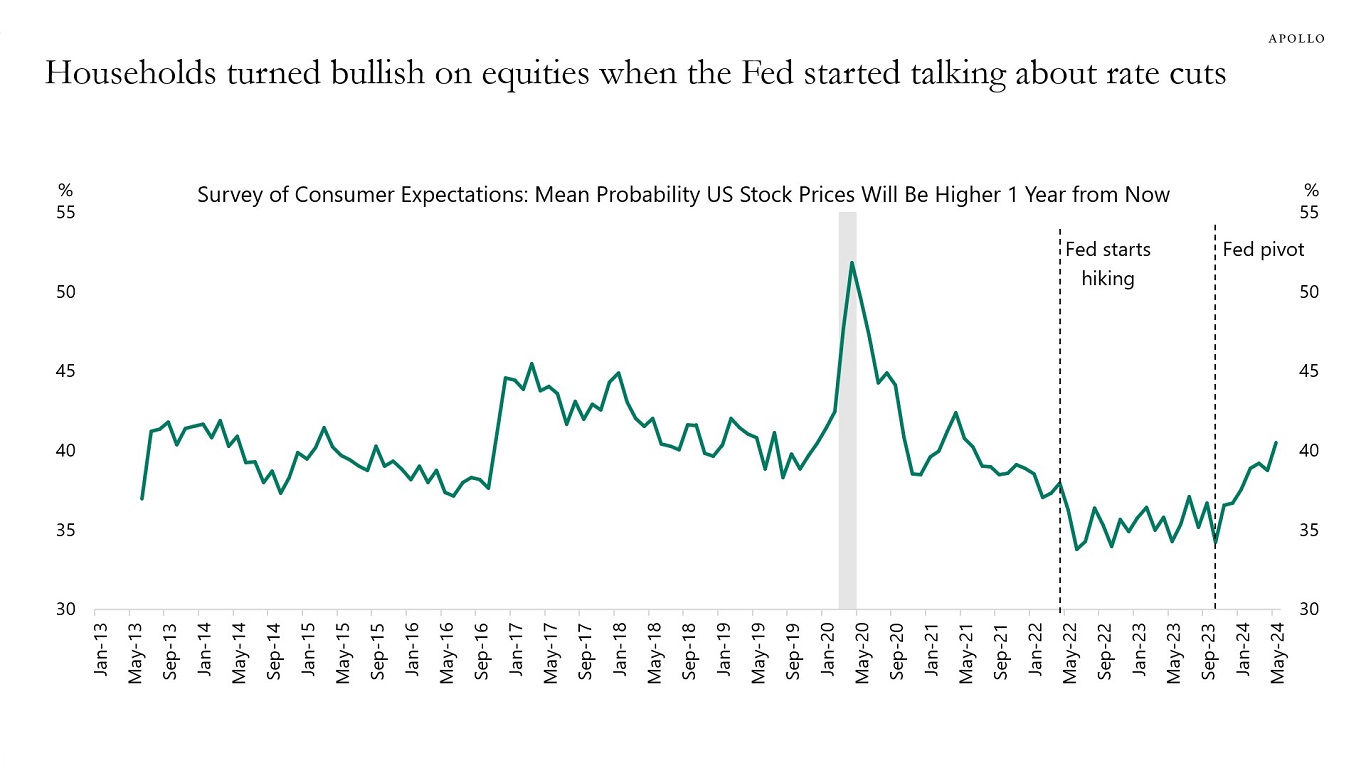
Source: Federal Reserve Bank of New York, Haver Analytics, Apollo Chief Economist See important disclaimers at the bottom of the page.
-
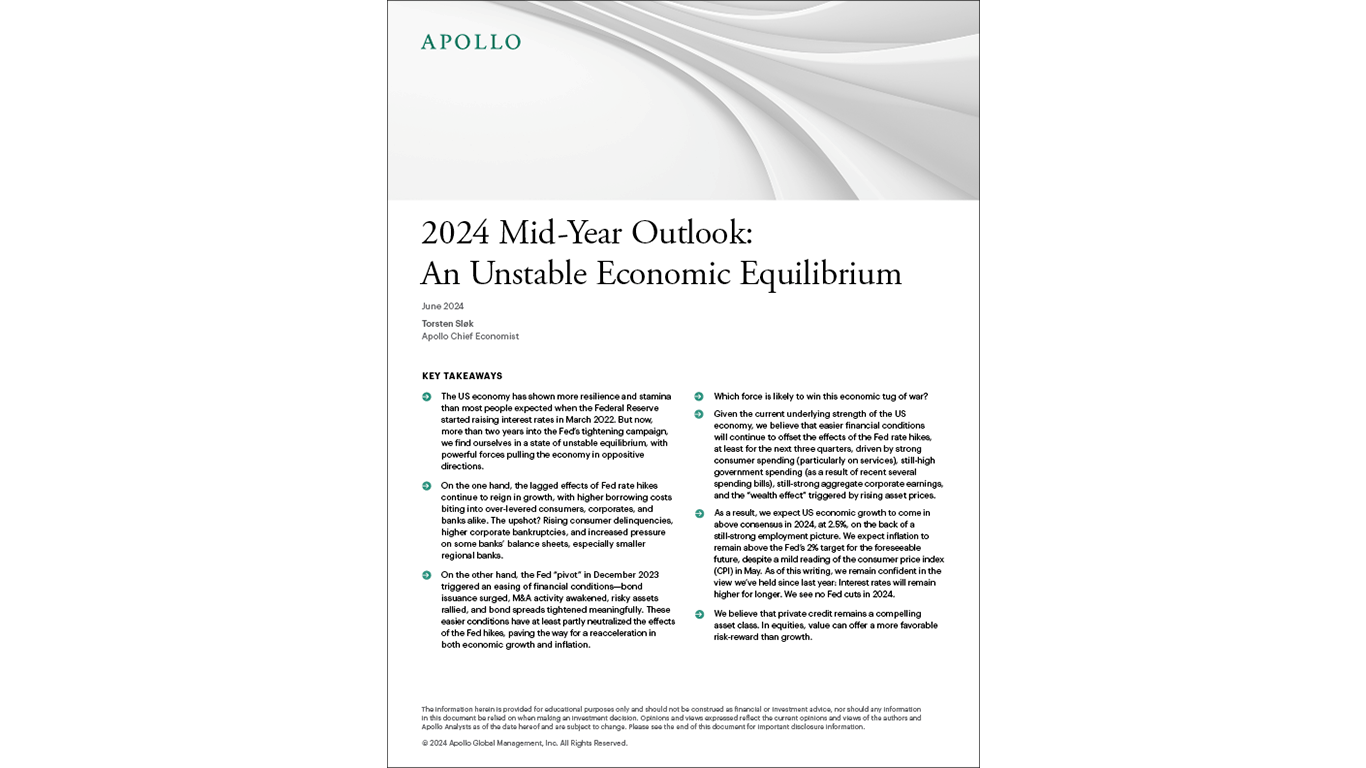
While the Fed’s rate hikes have reigned in growth, especially among over-levered consumers, corporates, and banks, the easing of financial conditions since the “Fed pivot” in December continues to offset the effect of higher rates. Through the remainder of 2024, we expect above-consensus economic growth. Inflation will remain above the Fed’s target and interest rates will remain higher for longer.
We published our consolidated views in my newest white paper, 2024 Mid-Year Outlook: An Unstable Economic Equilibrium. You can download it here.
I will also be discussing the contents of the paper and my views in detail in an Apollo Academy class today, June 20, at 11:00 ET (eligible for a CE credit). Register here.
See important disclaimers at the bottom of the page.
-
When the Fed raises interest rates, money market funds pay a higher dividend to households. The chart below shows that this effect is very significant and currently running at $500 billion, or around 2.5% of consumer spending. Put differently, Fed hikes are boosting consumer spending through higher money market fund dividends.
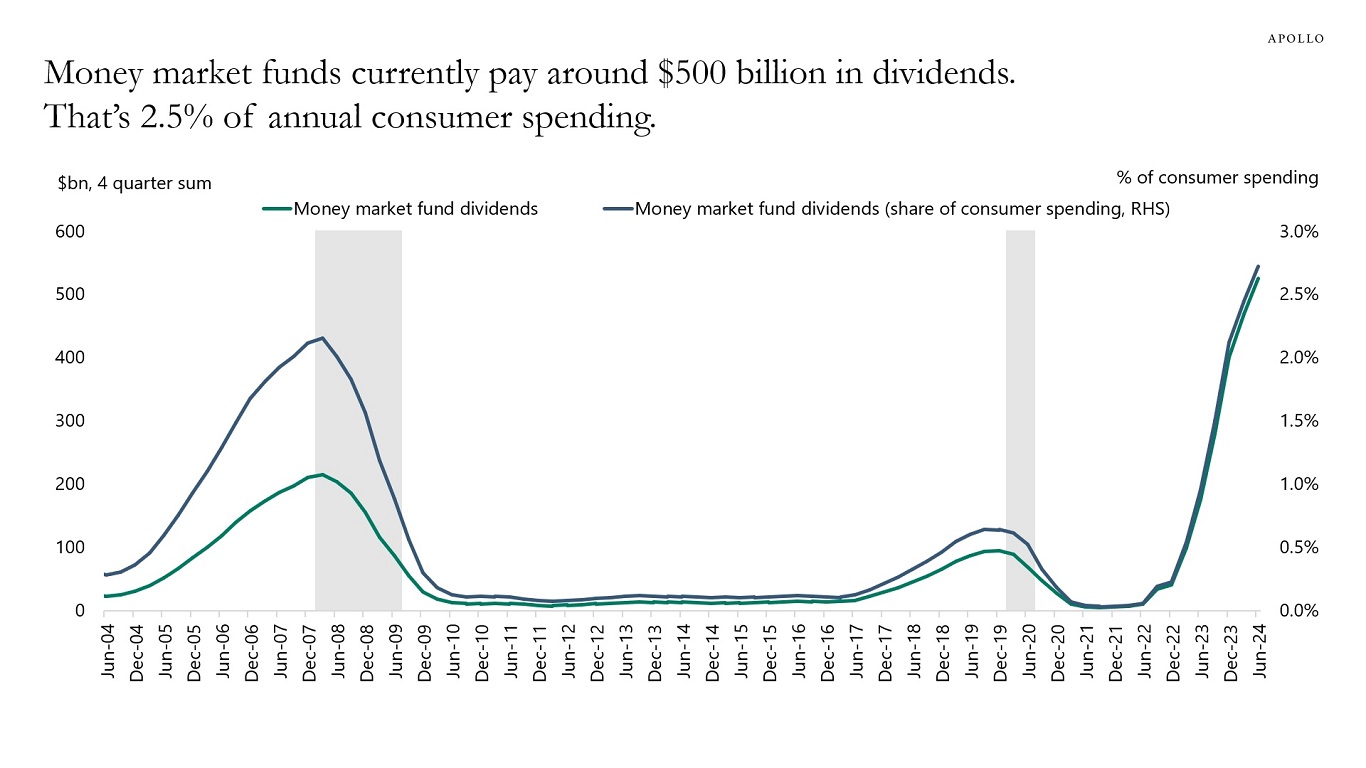
Source: BEA, ICI, Haver Analytics, Apollo Chief Economist. Note: Q1 2024 and Q2 2024 are estimates, dividends include dividends paid and dividends reinvested. Consumer spending is PCE. See important disclaimers at the bottom of the page.
-
Our updated banking sector chart book is available here.
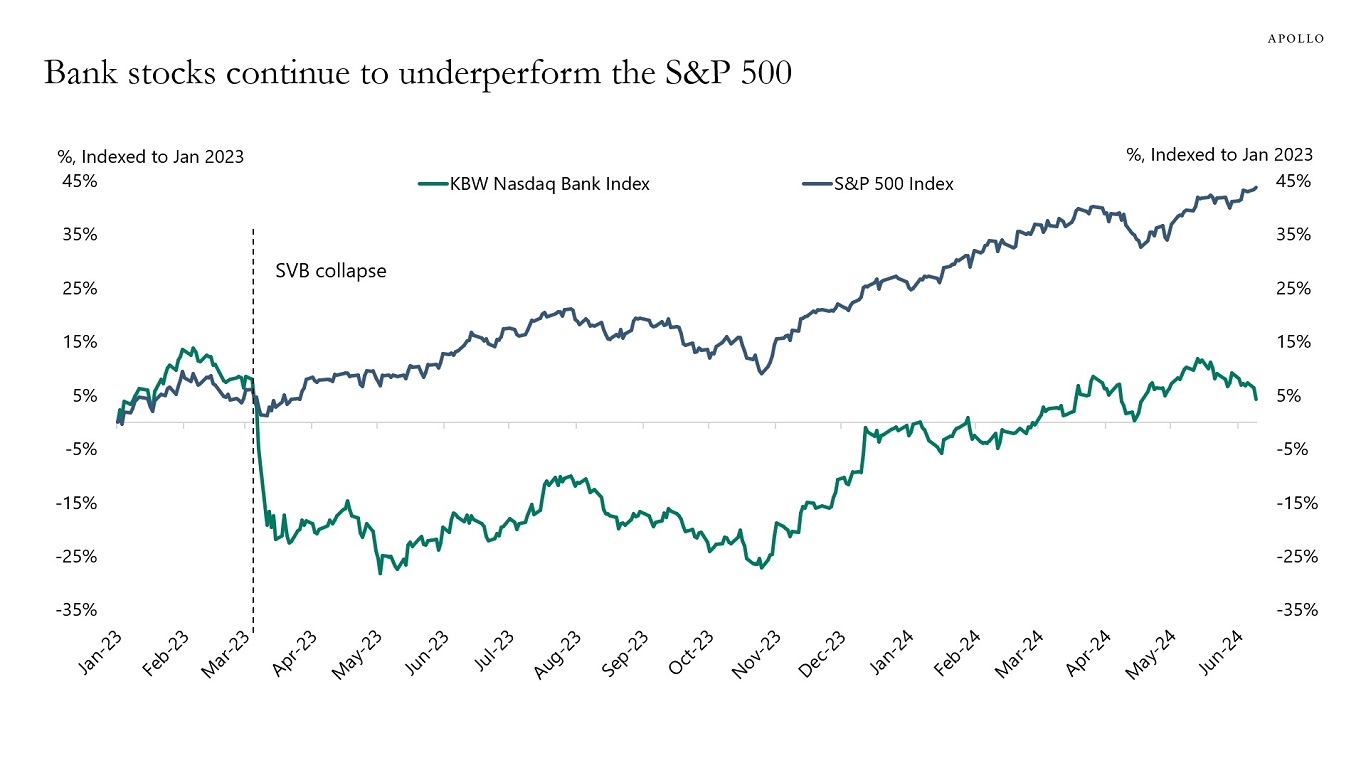
Note: The KBW Bank Index consists of: Bank of NY Mellon, Bank of America, Capital One Financial, Citigroup, Citizens Financial Group, Comerica, Fifth Third Bank, First Horizon, Huntington, JP Morgan Chase, Keycorp, M&T Bank, Northern Trust, PNC, People’s United Financial, Regions, State Street, Truist, US Bancorp, Wells Fargo, and Zions. Source: Bloomberg, Apollo Chief Economist 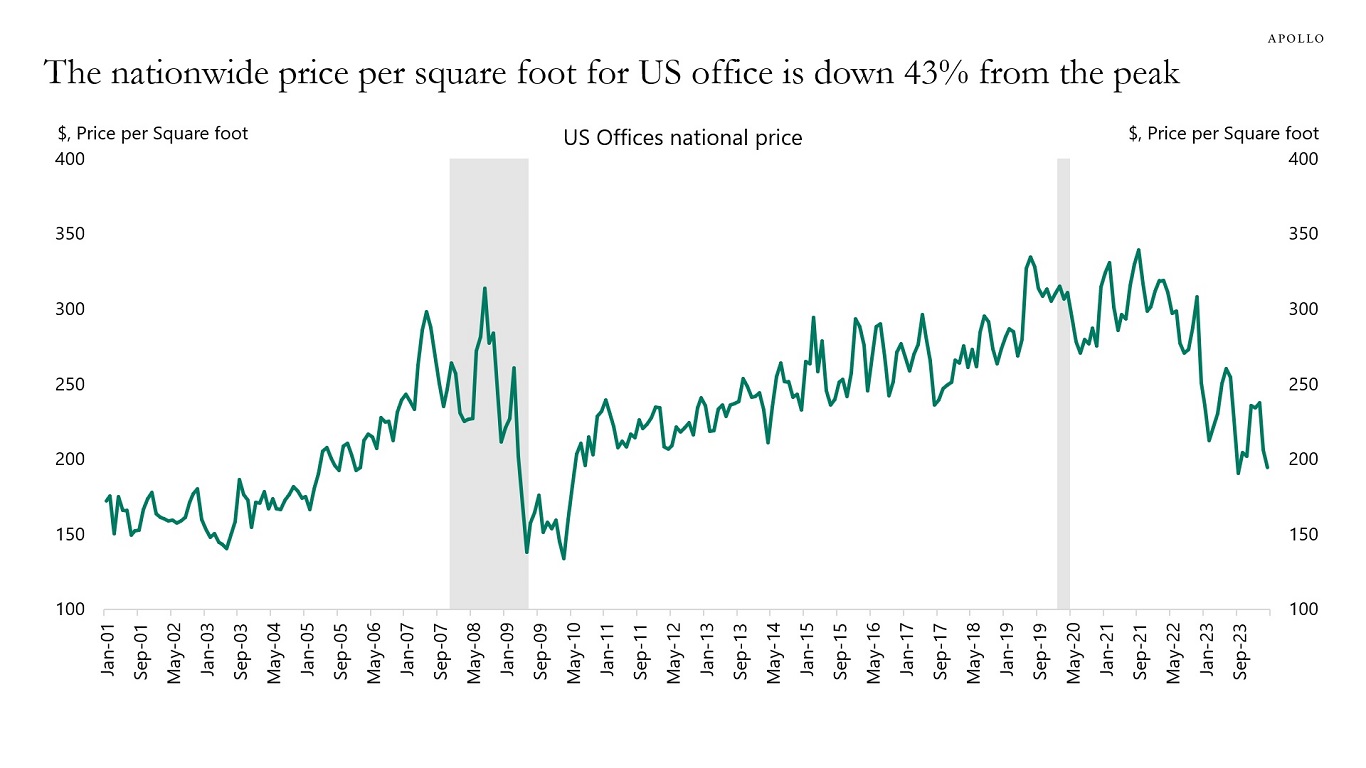
Source: RCA, Bloomberg, Apollo Chief Economist See important disclaimers at the bottom of the page.
-
The foreign-born labor force has grown 11% since February 2020, and the native-born labor force has remained unchanged over the same period, see chart below.
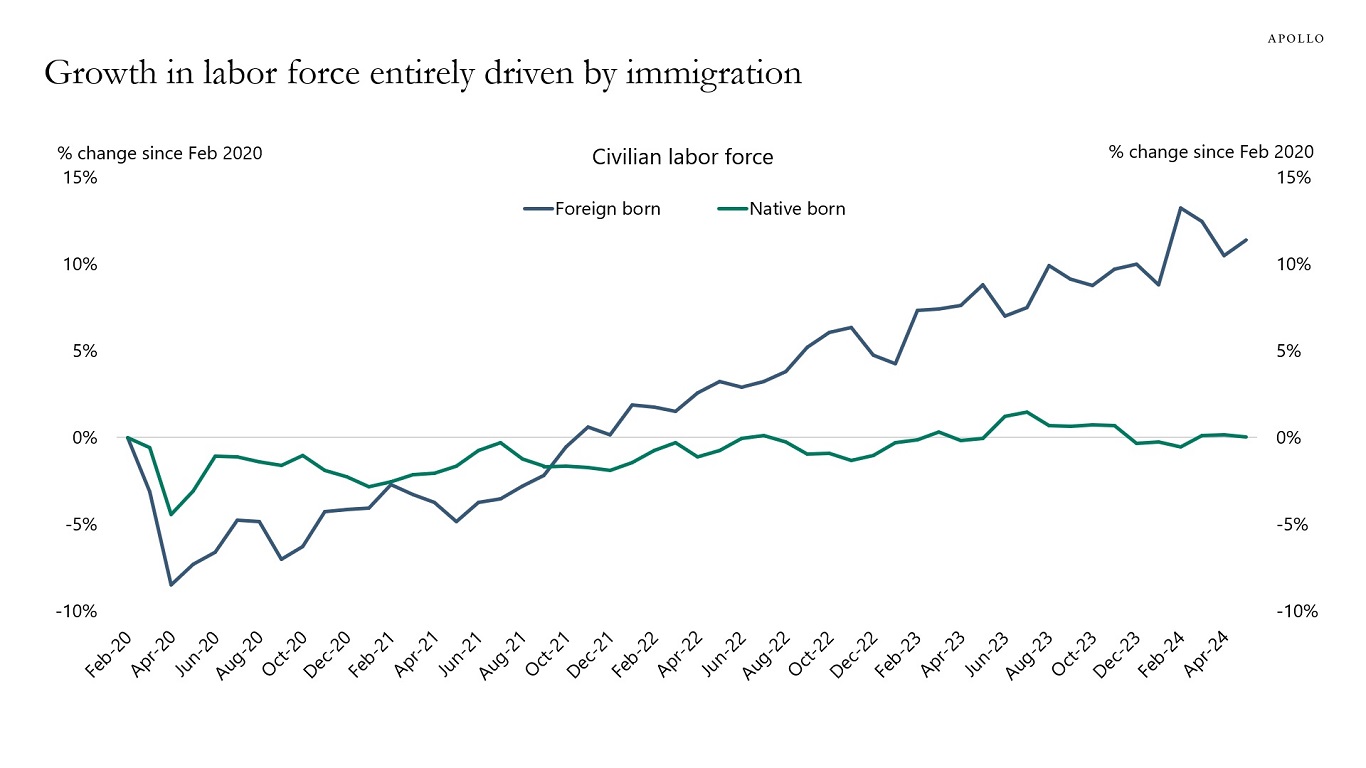
Source: BLS, Haver Analytics, Apollo Chief Economist See important disclaimers at the bottom of the page.
-
The Fed’s pivot from hawkish to dovish and associated easing in financial conditions have boosted expectations for US consumer spending, see chart below.

Source: Bloomberg, Apollo Chief Economist See important disclaimers at the bottom of the page.
-
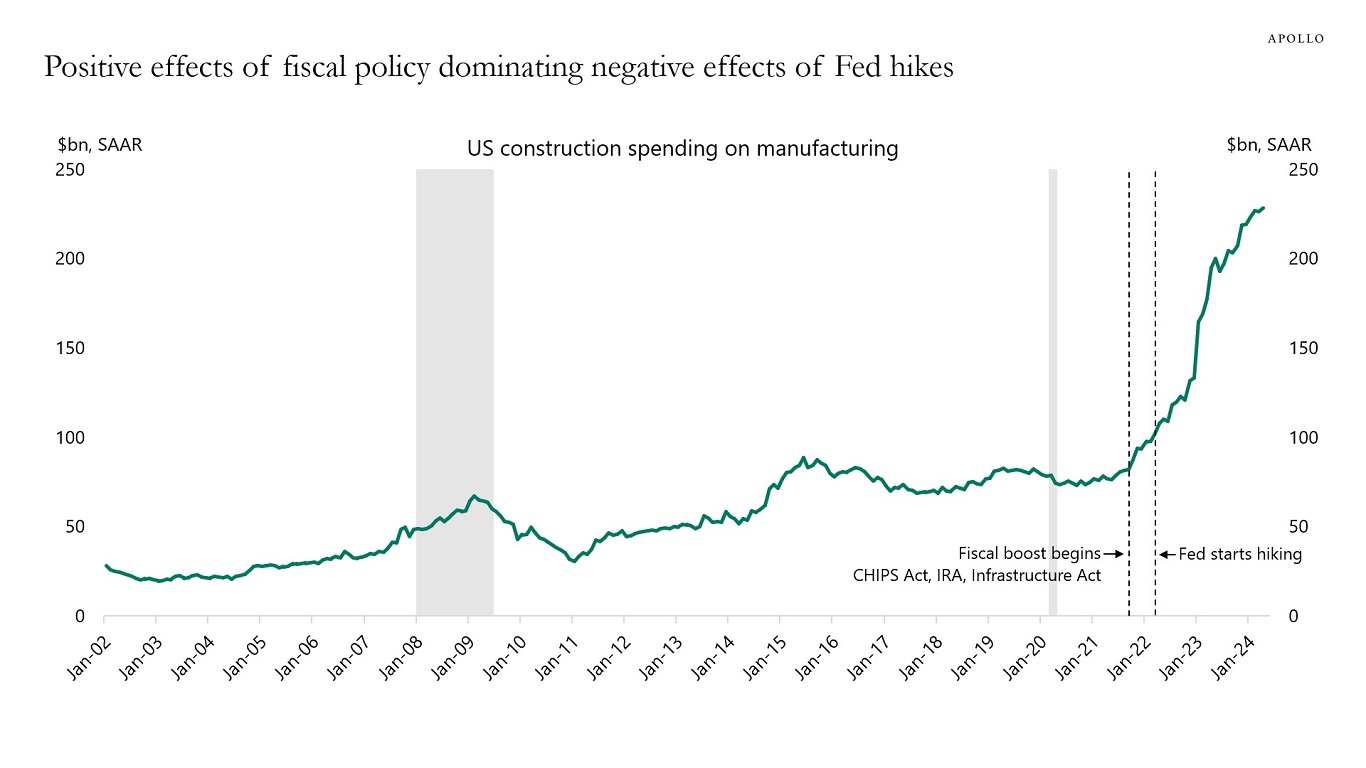
A key reason why the economy is still so strong is the significant tailwind to growth coming from the CHIPS Act, the Inflation Reduction Act, and the Infrastructure Act.
Monetary policy is using high interest rates trying to slow the economy down. Fiscal policy is utilizing open-ended policies to boost growth and employment.
In short, the positive effects of fiscal policy are dominating the negative effects of Fed hikes, see chart below.
Source: Census Bureau, Haver Analytics, Apollo Chief Economist See important disclaimers at the bottom of the page.
-
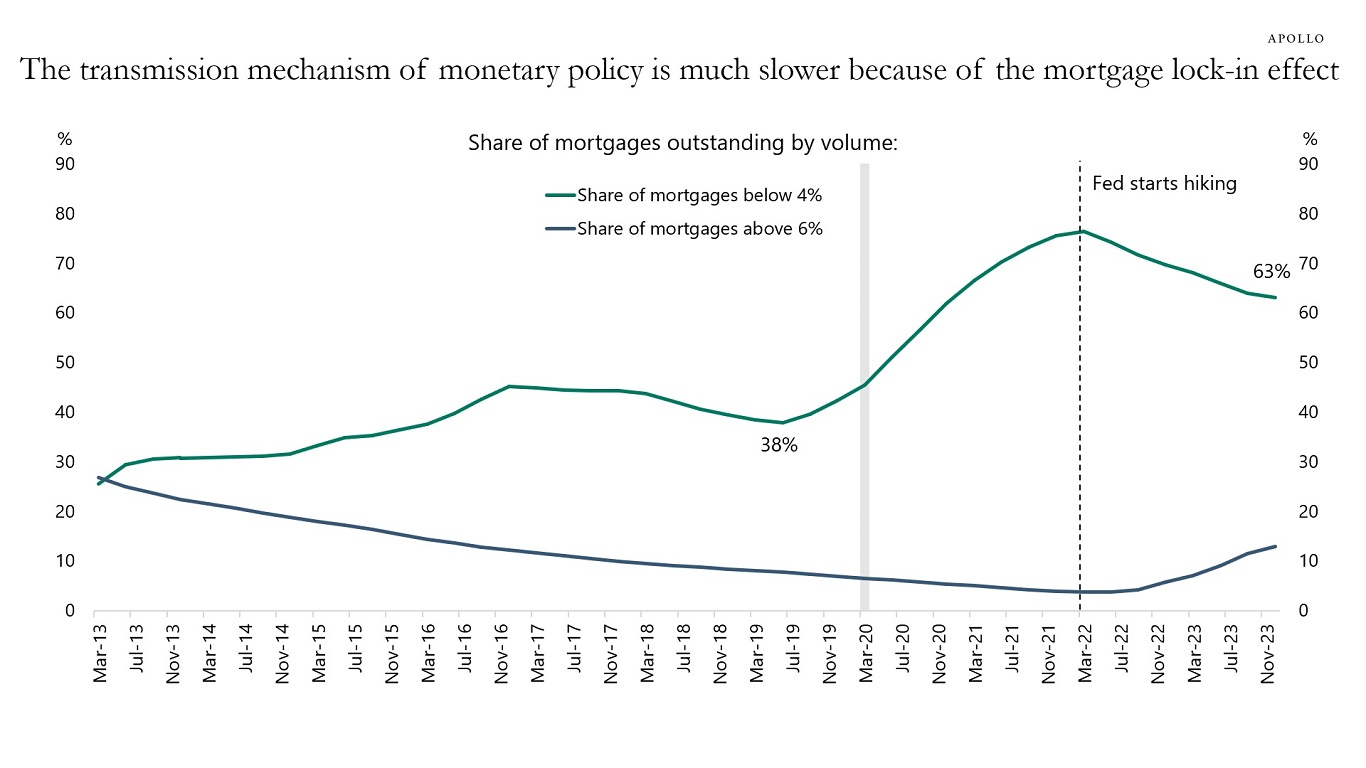
Before the pandemic, the share of outstanding mortgages with interest rates below 4% was 38%. Today it is 63%, see chart below.
In other words, housing is adjusting very slowly to Fed hikes. Millions of households still benefit from having locked-in low mortgage rates during the pandemic.
Put differently, the transmission mechanism of monetary policy is much slower than normal, and the Fed will need to keep interest rates higher for longer to get inflation under control.
Source: FHFA, Apollo Chief Economist See important disclaimers at the bottom of the page.
-
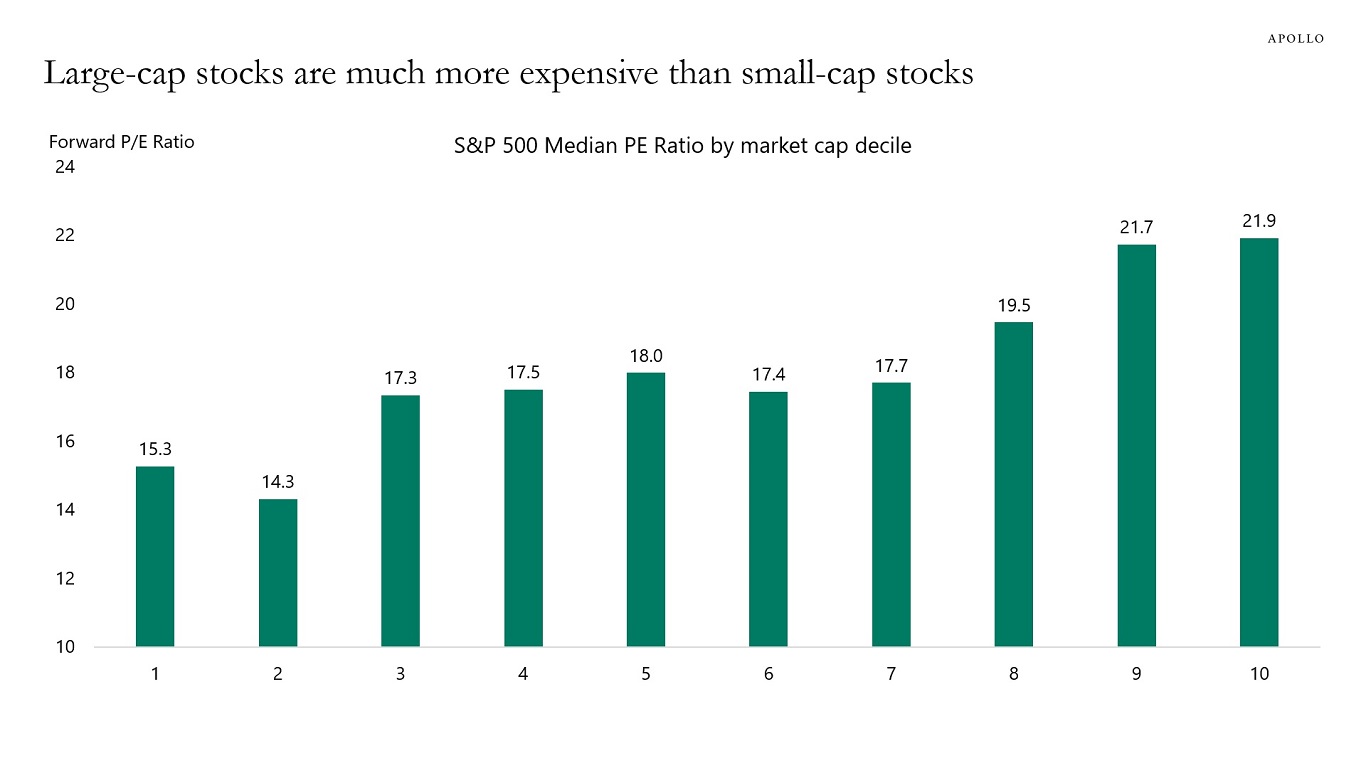
Looking at P/E ratios for companies in the S&P 500 ranked by market cap shows that large-cap companies are much more expensive than small-cap companies, see chart below.
Why are P/E ratios low for small-cap companies and high for large-cap companies?
Because Fed hikes and higher costs of capital are weighing on highly leveraged small-cap companies with low coverage ratios.
And the AI story has boosted valuations of mega-cap names.
With the Fed keeping interest rates higher for longer, and the AI narrative pushing valuations and index concentration to extreme levels, the downside risks to equities are growing.
Source: Bloomberg, Apollo Chief Economist See important disclaimers at the bottom of the page.

This presentation may not be distributed, transmitted or otherwise communicated to others in whole or in part without the express consent of Apollo Global Management, Inc. (together with its subsidiaries, “Apollo”).
Apollo makes no representation or warranty, expressed or implied, with respect to the accuracy, reasonableness, or completeness of any of the statements made during this presentation, including, but not limited to, statements obtained from third parties. Opinions, estimates and projections constitute the current judgment of the speaker as of the date indicated. They do not necessarily reflect the views and opinions of Apollo and are subject to change at any time without notice. Apollo does not have any responsibility to update this presentation to account for such changes. There can be no assurance that any trends discussed during this presentation will continue.
Statements made throughout this presentation are not intended to provide, and should not be relied upon for, accounting, legal or tax advice and do not constitute an investment recommendation or investment advice. Investors should make an independent investigation of the information discussed during this presentation, including consulting their tax, legal, accounting or other advisors about such information. Apollo does not act for you and is not responsible for providing you with the protections afforded to its clients. This presentation does not constitute an offer to sell, or the solicitation of an offer to buy, any security, product or service, including interest in any investment product or fund or account managed or advised by Apollo.
Certain statements made throughout this presentation may be “forward-looking” in nature. Due to various risks and uncertainties, actual events or results may differ materially from those reflected or contemplated in such forward-looking information. As such, undue reliance should not be placed on such statements. Forward-looking statements may be identified by the use of terminology including, but not limited to, “may”, “will”, “should”, “expect”, “anticipate”, “target”, “project”, “estimate”, “intend”, “continue” or “believe” or the negatives thereof or other variations thereon or comparable terminology.