


Want it delivered daily to your inbox?
-
To calculate CPI inflation, BLS teams collect about 90,000 price quotes every month covering 200 different item categories, and there are several hundred field collectors active across 75 urban areas.
When data is not available, BLS staff typically develop estimates for approximately 10% of the cells in the CPI calculation. However, in May, the share of data in the CPI that is estimated increased to 30%, see chart below.
In other words, a rising share of prices going into the CPI at the moment are guesses based on other data collections in the CPI.
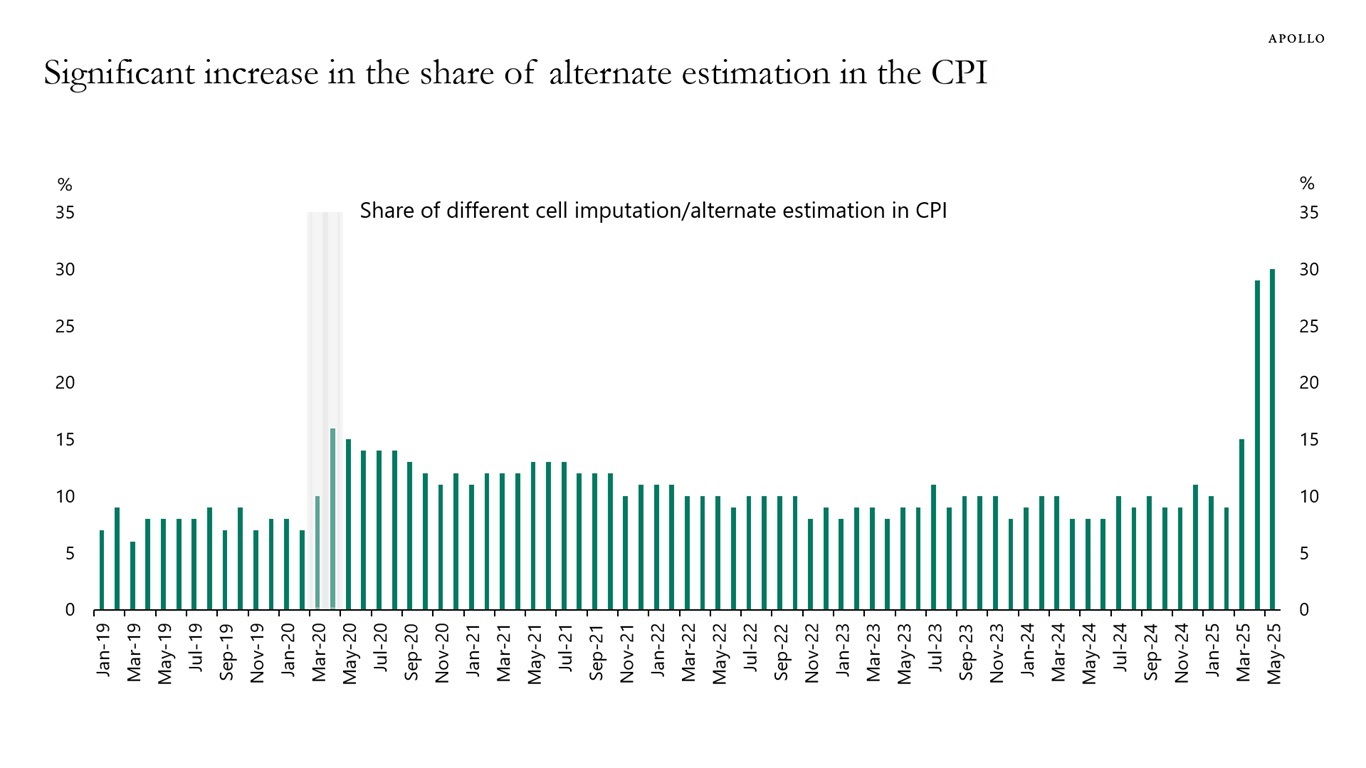
Note: Different cell imputation is where uncollected prices are imputed from collected prices of the same item in other geographic areas or from collected prices of related item categories in the same geographic area. Sources: BLS, Apollo Chief Economist See important disclaimers at the bottom of the page.
-
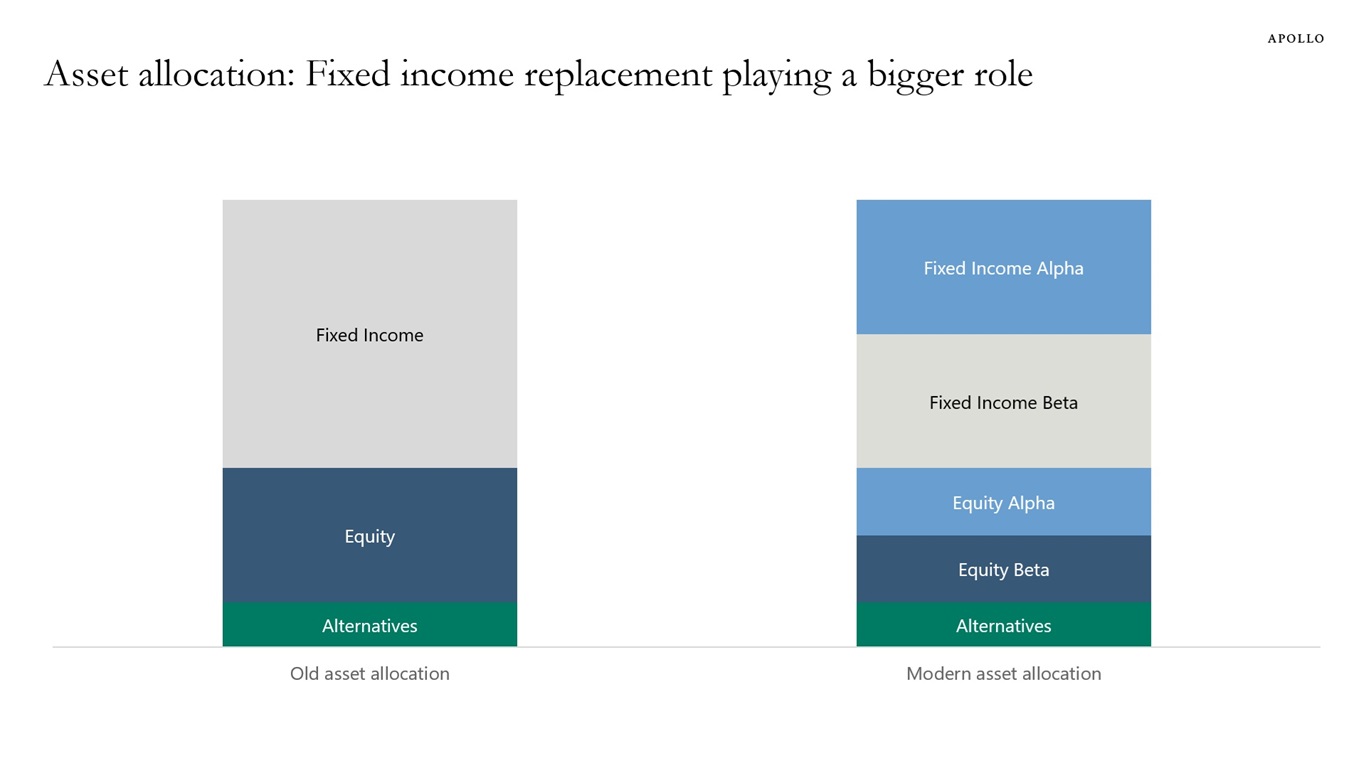
Active managers in public markets have largely not been able to beat their index, see here and here.
As a result, modern asset allocation is moving to a model where fixed income replacement plays a key role as generator of alpha in portfolios, see chart below.
Source: Apollo Chief Economist See important disclaimers at the bottom of the page.
-
Foreigners have steadily increased their holdings of US equities and currently own 18% of the US stock market, see chart below.
This is the mirror image of a trade deficit. Foreigners selling goods to the US receive dollars in return, which are then used to purchase US assets, including US equities.
If the trade deficit is eliminated, there will be fewer dollars for foreigners to recycle into the S&P 500.

Sources: Federal Reserve, Macrobond, Apollo Chief Economist See important disclaimers at the bottom of the page.
-
The chart below shows a timeline of US tariffs since early February.
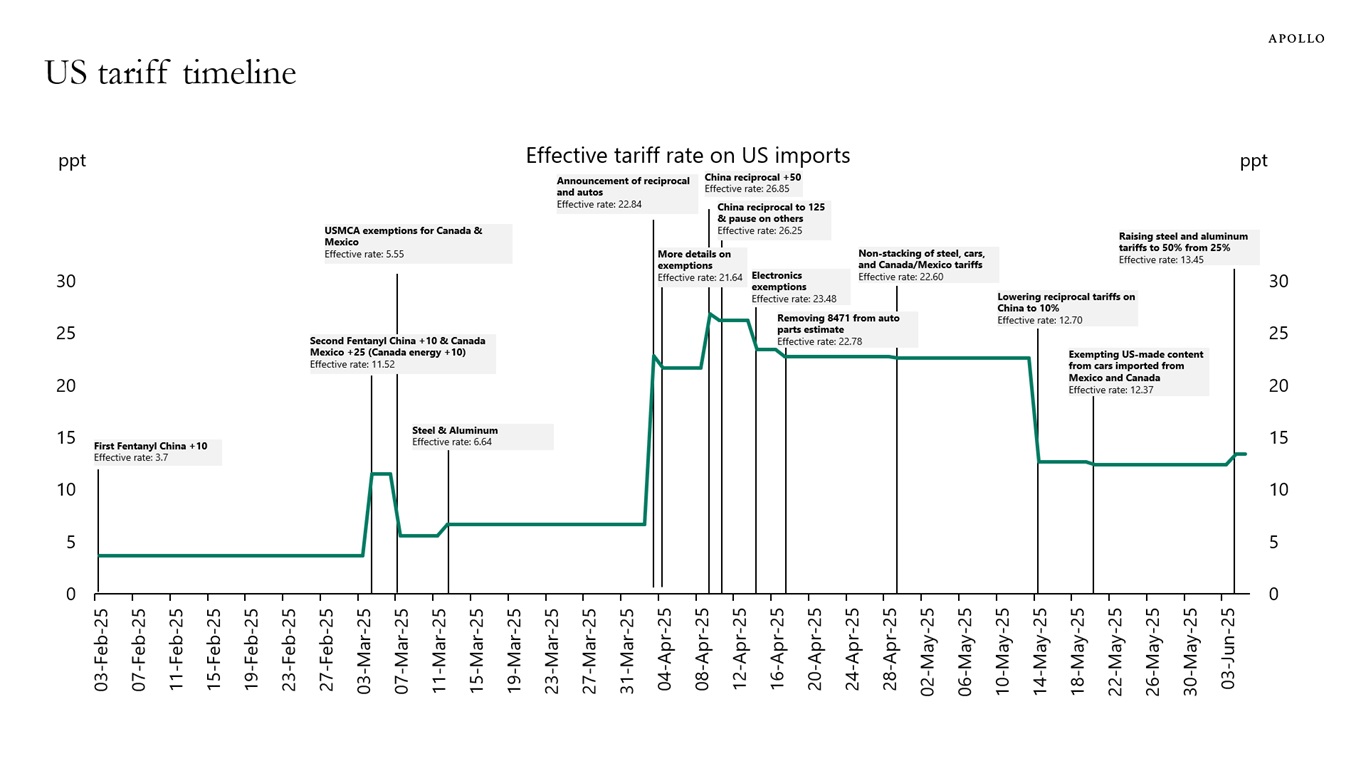
Sources: Bloomberg (BECO Models Trade), Apollo Chief Economist See important disclaimers at the bottom of the page.
-
Europeans work far fewer hours per week than Americans, see chart below.
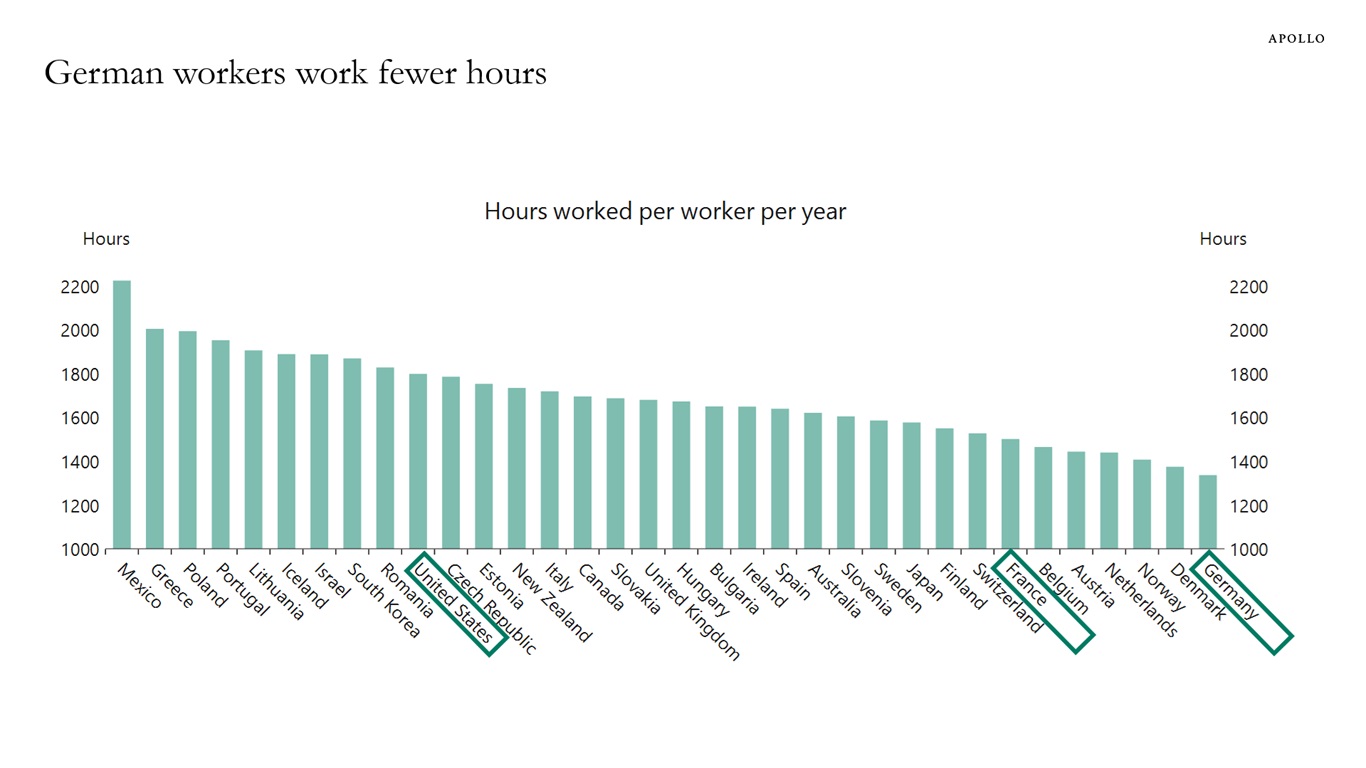
Note: Data as of 2024. Sources: OECD (Organisation for Economic Co-operation & Development), Macrobond, Apollo Chief Economist See important disclaimers at the bottom of the page.
-
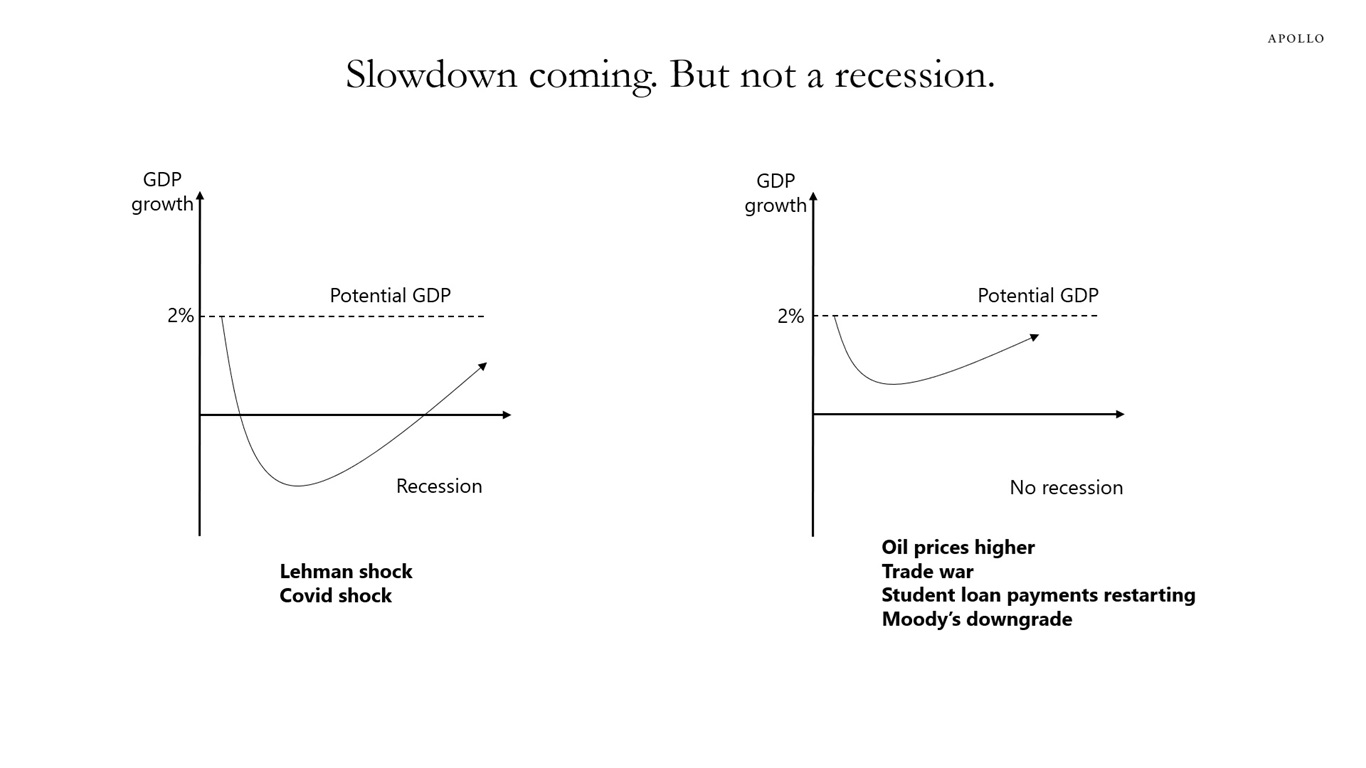
US economic growth is currently facing headwinds from higher oil prices, increased tariffs, the resumption of student loan payments, and higher long-term interest rates associated with the fiscal situation.
When we quantify these four drags on growth, we conclude that they are insufficient to push the economy into a recession.
In other words, these shocks are milder than those of Covid-19 and the Lehman crisis, see chart below.
However, we are closely monitoring these four risks to assess whether they become significant enough to put GDP growth into negative territory later this year—for example, if oil prices, tariffs, or long rates increase further.
Source: Apollo Chief Economist See important disclaimers at the bottom of the page.
-
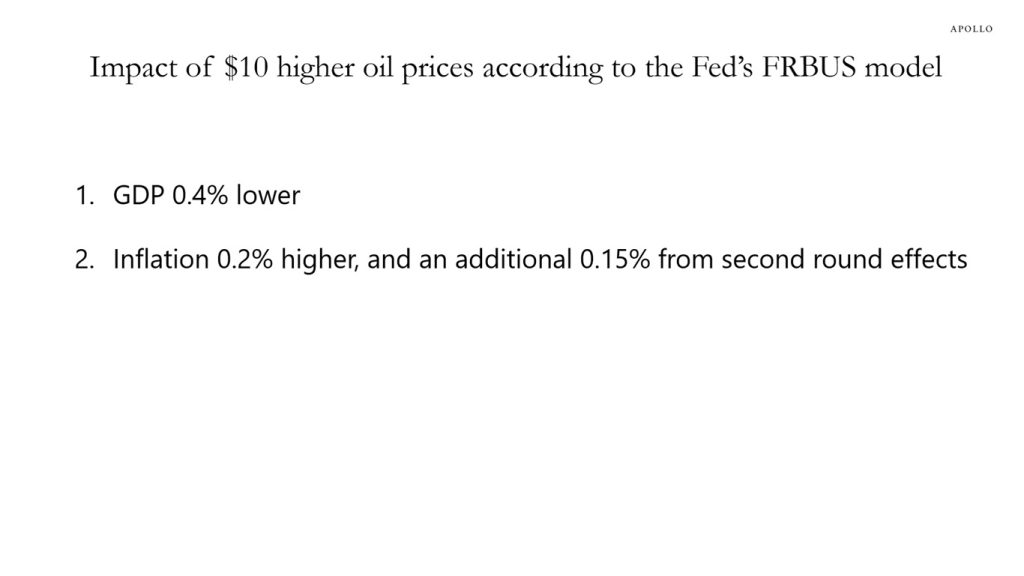
According to the Fed’s model of the US economy, a sustained $10 increase in oil prices is expected to increase inflation by 0.4% and lower GDP by 0.4%, see table below.
Tariffs also increase inflation and lower GDP growth.
Restrictions on immigration also increase wage inflation and lower employment growth.
In short, higher oil prices exacerbate the ongoing stagflation shock stemming from tariffs and immigration restrictions.
Stagflation is a problem for the FOMC when they meet next week. Higher inflation says the Fed should be hiking. Lower GDP growth says the Fed should cutting. So will the FOMC next week put more weight on the upward pressure on inflation or more weight on the coming slowdown in growth?
Sources: Apollo Chief Economist, Federal Reserve Bulletin See important disclaimers at the bottom of the page.
-
Foreigners have record-high exposure to long-dated US government bonds. Specifically, foreigners have increased their share of holdings of US Treasuries with a maturity greater than 10 years, see chart below.
As a result, foreign portfolios of US Treasuries are more vulnerable to the ongoing rise in long-term interest rates.
Why have foreigners over the past decade increased their exposure to US duration? Because of the prolonged period of low and negative interest rates in Europe and Japan. Global investors like high nominal yields.

Sources: US Treasury, Haver Analytics, Apollo Chief Economist See important disclaimers at the bottom of the page.
-
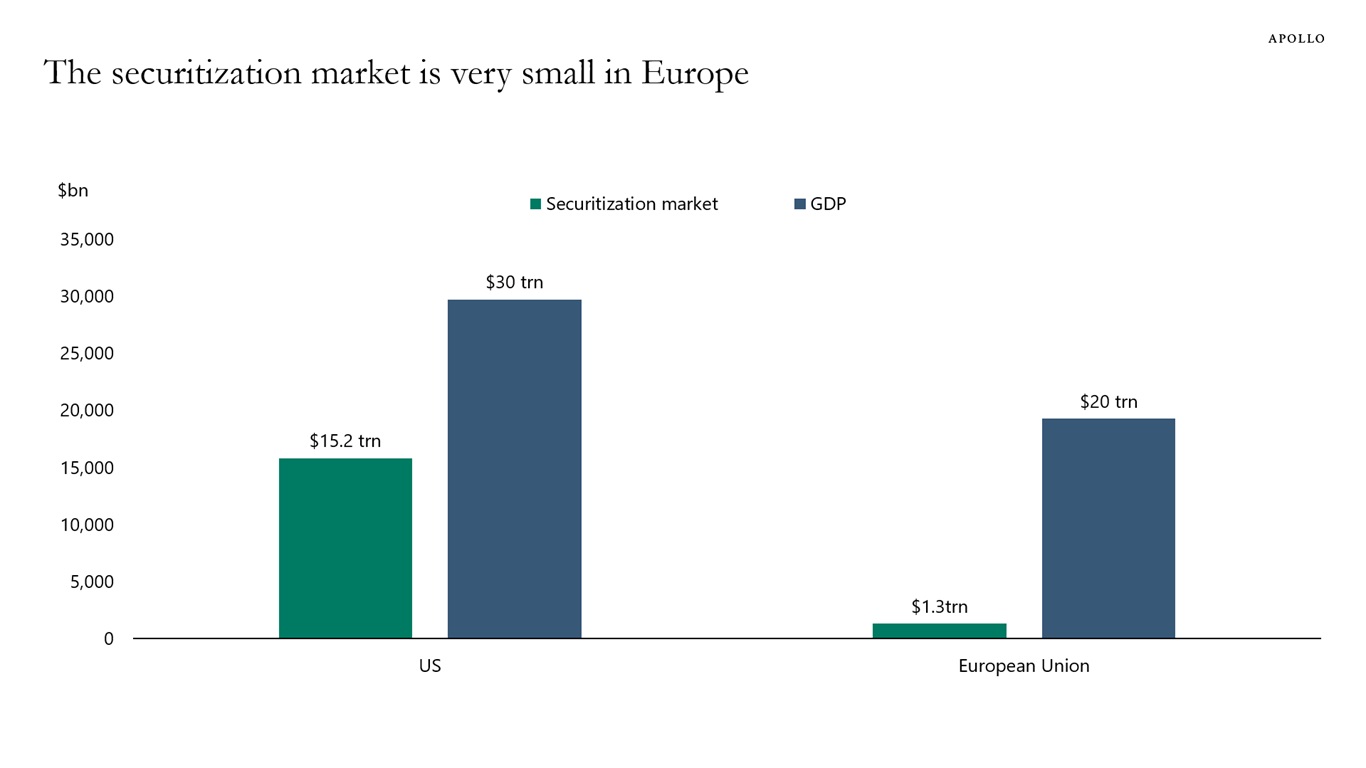
In the United States, the securitization market is 50% of GDP. In Europe, securitization markets are only 7% of GDP, see chart below.
Expanding the securitization market in Europe would unlock significant GDP growth in Europe.
Sources: SIFMA, AFME, Bloomberg, Apollo Chief Economist See important disclaimers at the bottom of the page.
-
Our latest outlook for China is available here.
The consensus predicts a decline in China’s growth from its current rate of around 5% to 4% next year.
The forces pulling growth down are the ongoing trade war with the US, the deflating housing bubble, and demographic headwinds as the lagged effects of the one-child policy continue to shrink the working-age population.


Sources: Bloomberg, Macrobond, Apollo Chief Economist 
Sources: Bloomberg, Apollo Chief Economist (Data as of June 2024) 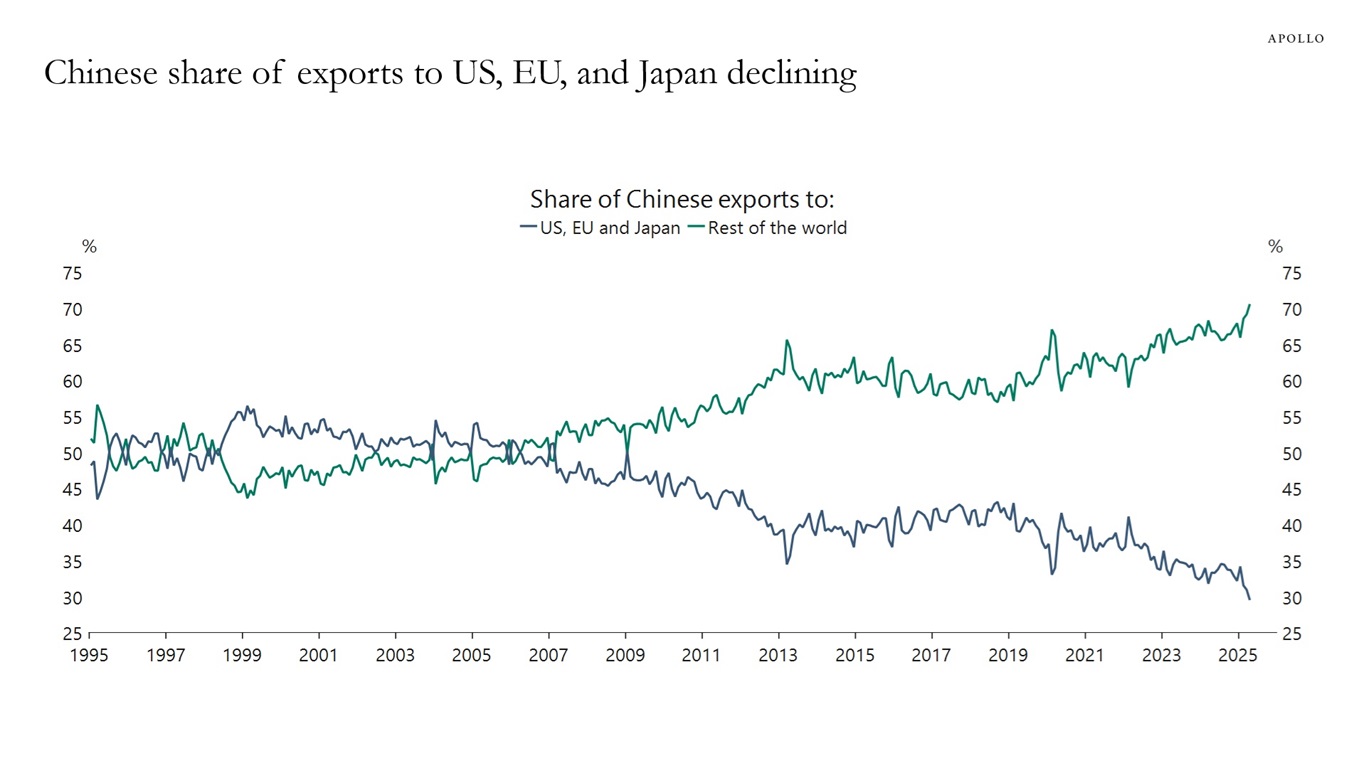
Sources: China General Administration of Customs (GAC), Macrobond, Apollo Chief Economist See important disclaimers at the bottom of the page.

This presentation may not be distributed, transmitted or otherwise communicated to others in whole or in part without the express consent of Apollo Global Management, Inc. (together with its subsidiaries, “Apollo”).
Apollo makes no representation or warranty, expressed or implied, with respect to the accuracy, reasonableness, or completeness of any of the statements made during this presentation, including, but not limited to, statements obtained from third parties. Opinions, estimates and projections constitute the current judgment of the speaker as of the date indicated. They do not necessarily reflect the views and opinions of Apollo and are subject to change at any time without notice. Apollo does not have any responsibility to update this presentation to account for such changes. There can be no assurance that any trends discussed during this presentation will continue.
Statements made throughout this presentation are not intended to provide, and should not be relied upon for, accounting, legal or tax advice and do not constitute an investment recommendation or investment advice. Investors should make an independent investigation of the information discussed during this presentation, including consulting their tax, legal, accounting or other advisors about such information. Apollo does not act for you and is not responsible for providing you with the protections afforded to its clients. This presentation does not constitute an offer to sell, or the solicitation of an offer to buy, any security, product or service, including interest in any investment product or fund or account managed or advised by Apollo.
Certain statements made throughout this presentation may be “forward-looking” in nature. Due to various risks and uncertainties, actual events or results may differ materially from those reflected or contemplated in such forward-looking information. As such, undue reliance should not be placed on such statements. Forward-looking statements may be identified by the use of terminology including, but not limited to, “may”, “will”, “should”, “expect”, “anticipate”, “target”, “project”, “estimate”, “intend”, “continue” or “believe” or the negatives thereof or other variations thereon or comparable terminology.