


Want it delivered daily to your inbox?
-
About 5% of the US population is experiencing third-party collections, down from 14% during the GFC, see chart below.
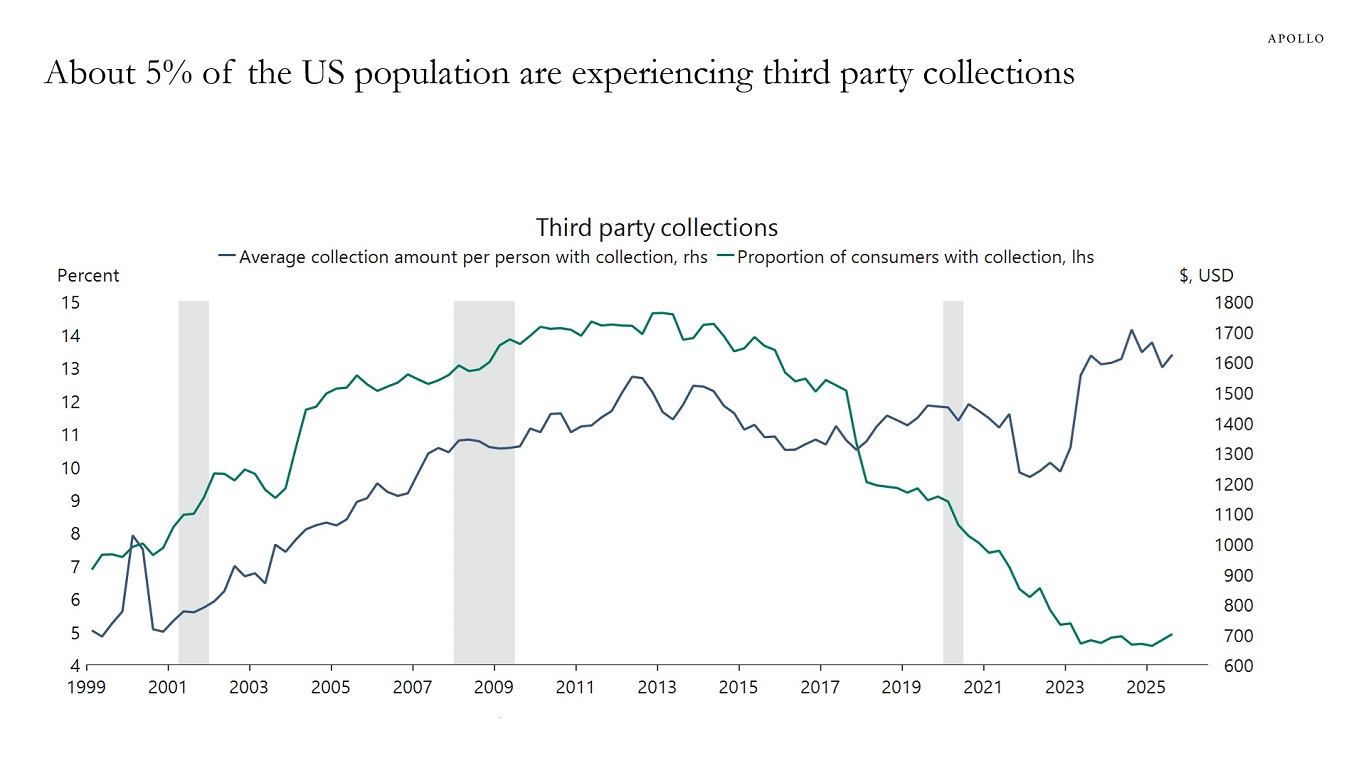
Sources: Federal Reserve Bank of New York, Macrobond, Apollo Chief Economist See important disclaimers at the bottom of the page.
-
Since the beginning of the year, Chinese exports to the US are down $75 billion and Chinese exports to Asia are up $150 billion. Chinese exports to Europe, Africa and Latin America are basically flat, see chart below.
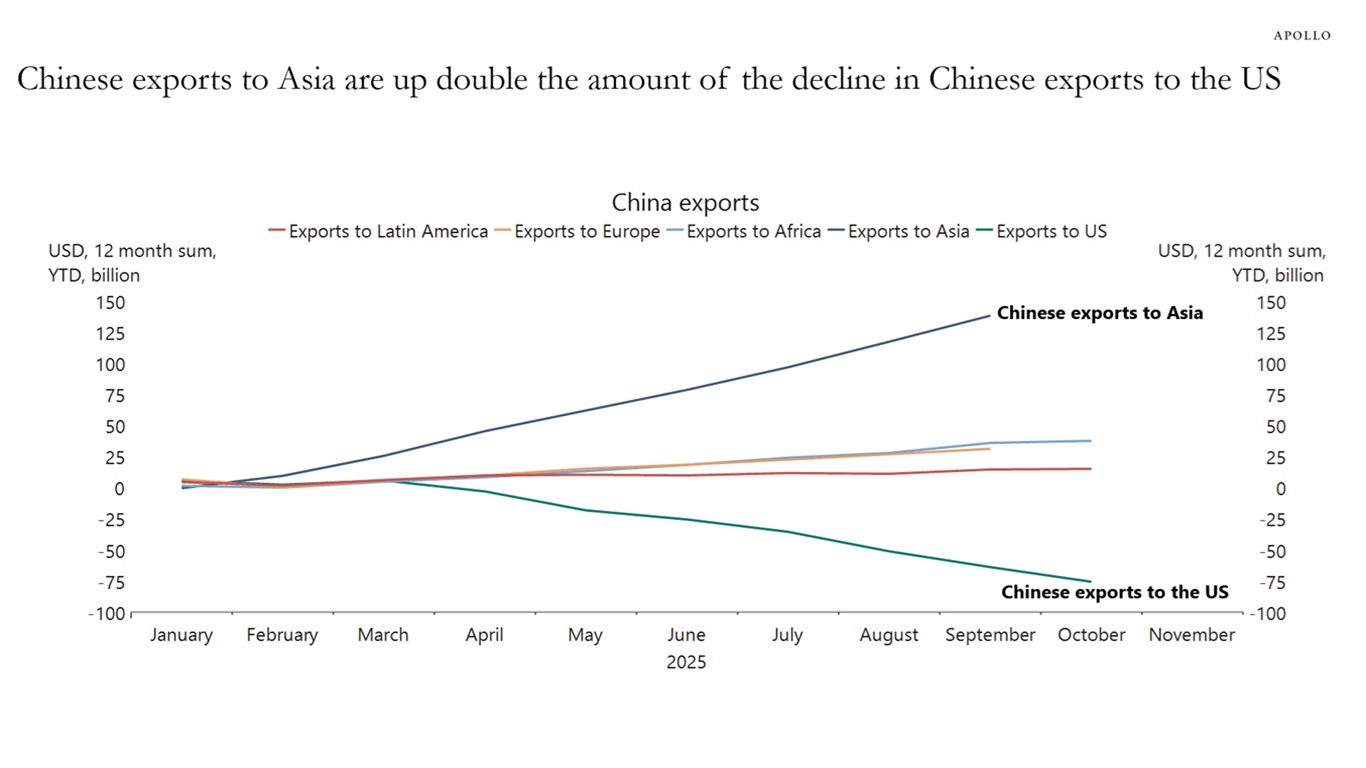
Sources: China General Administration of Customs (GAC), Macrobond, Apollo Chief Economist See important disclaimers at the bottom of the page.
-
In 2010, the median age of all US homebuyers was 39 years old. Today, it is 59, see chart below.
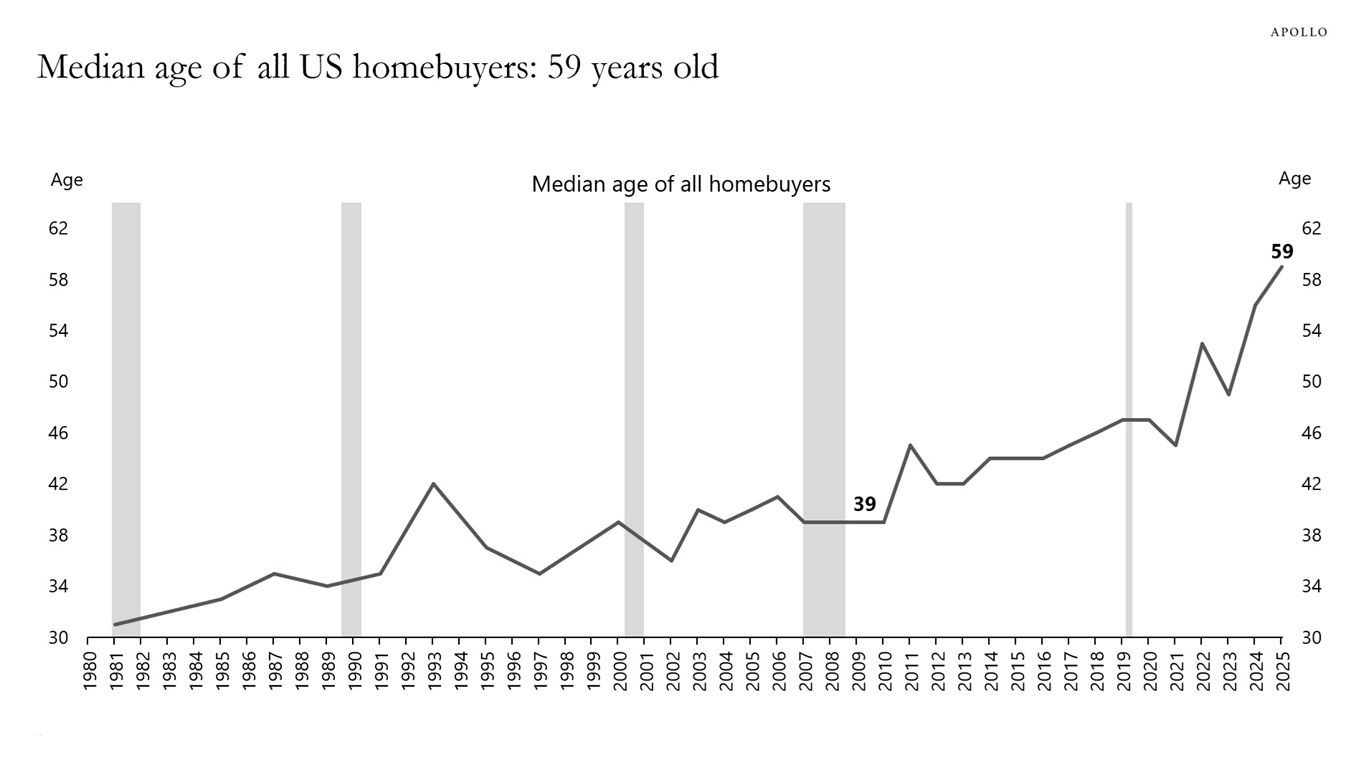
Sources: National Association of Realtors, Apollo Chief Economist See important disclaimers at the bottom of the page.
-
Looking at annualized month-over-month growth rates shows that 55% of items in the CPI basket are growing faster than 3%, see chart below. This is the reason why it is difficult for the Fed to cut interest rates in December.
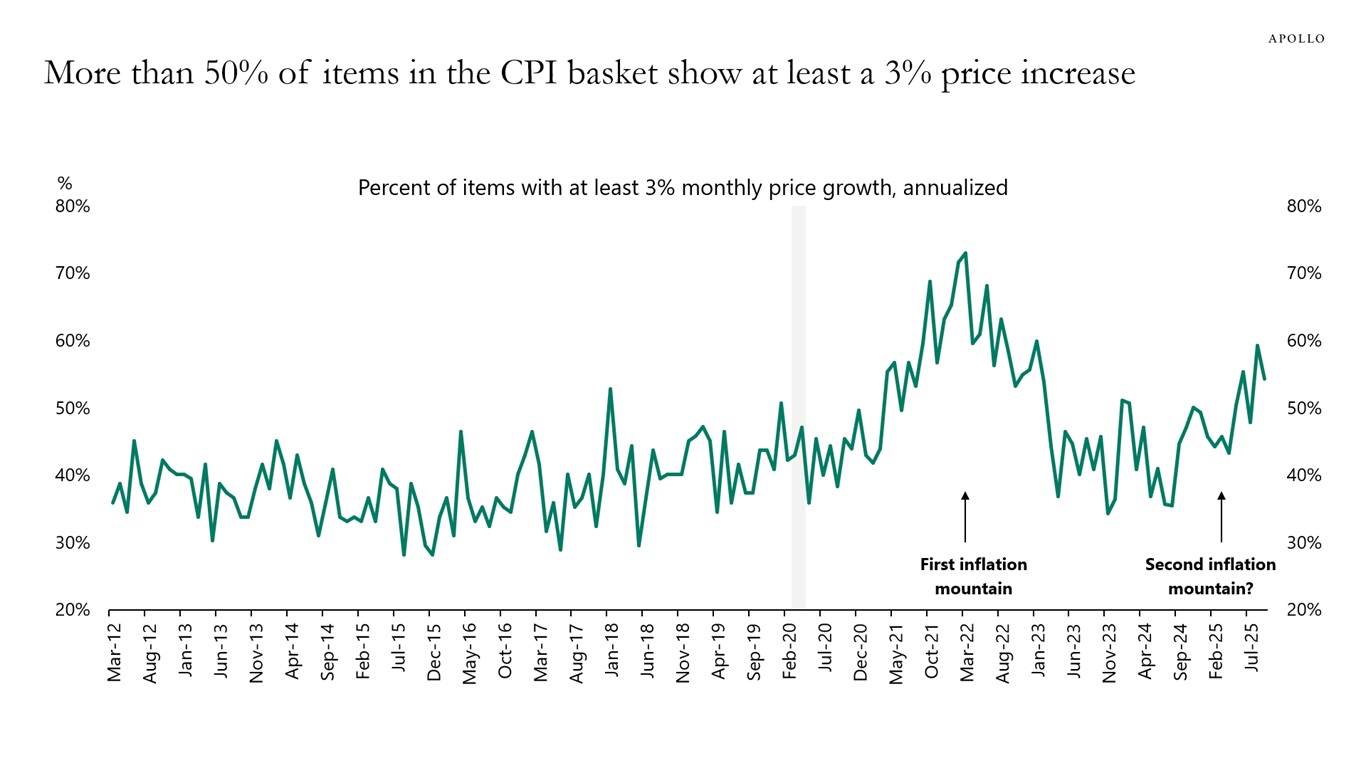
Sources: BLS, Apollo Chief Economist See important disclaimers at the bottom of the page.
-
The average family in the US currently pays $6,850 annually for health insurance, and the average annual payment for employers is $20,143, see chart below.
That is a total annual cost for health insurance per family of $26,993
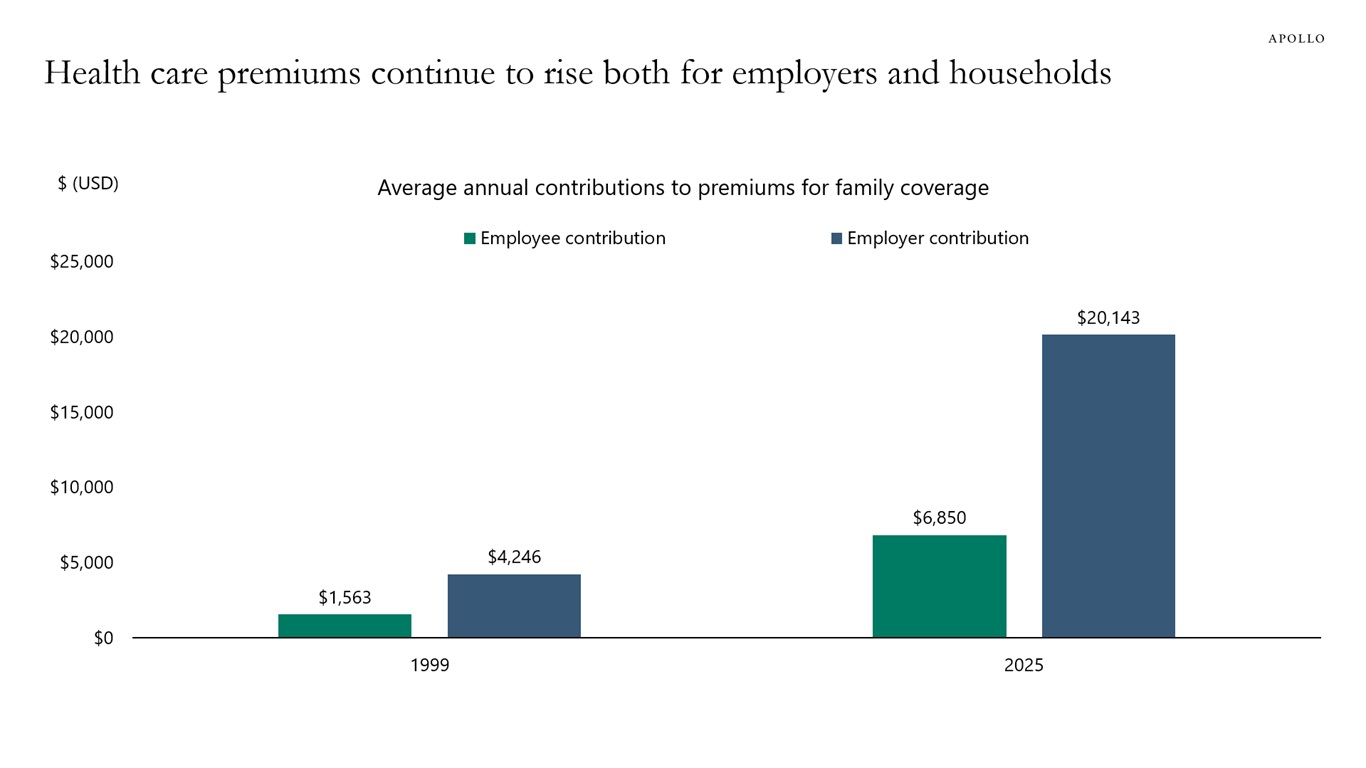
Note: Family coverage refers to health insurance coverage for an employee and at least one family member (spouse and/or dependent children). Sources: Kaiser Family Foundation, Apollo Chief Economist See important disclaimers at the bottom of the page.
-
Before and during the pandemic, lower-income households experienced higher wage growth than other income groups. But that has changed over the past year, see chart below. Today, wage growth for low-income workers is significantly lower than wage growth for middle- and high-income workers.
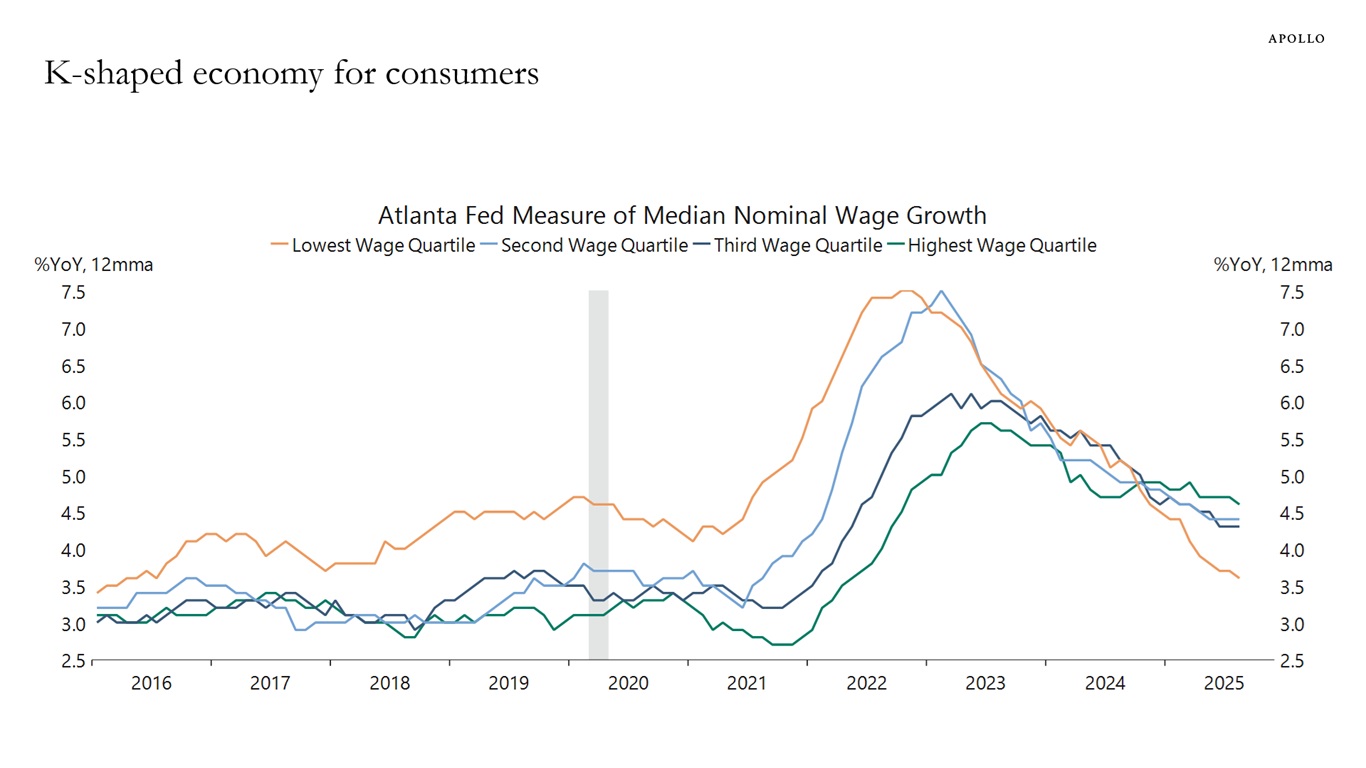
Sources: Federal Reserve Bank of Atlanta, Macrobond, Apollo Chief Economist See important disclaimers at the bottom of the page.
-
In 1963, 33 million babies were born in China. In 2024, there were 9 million, see chart below.
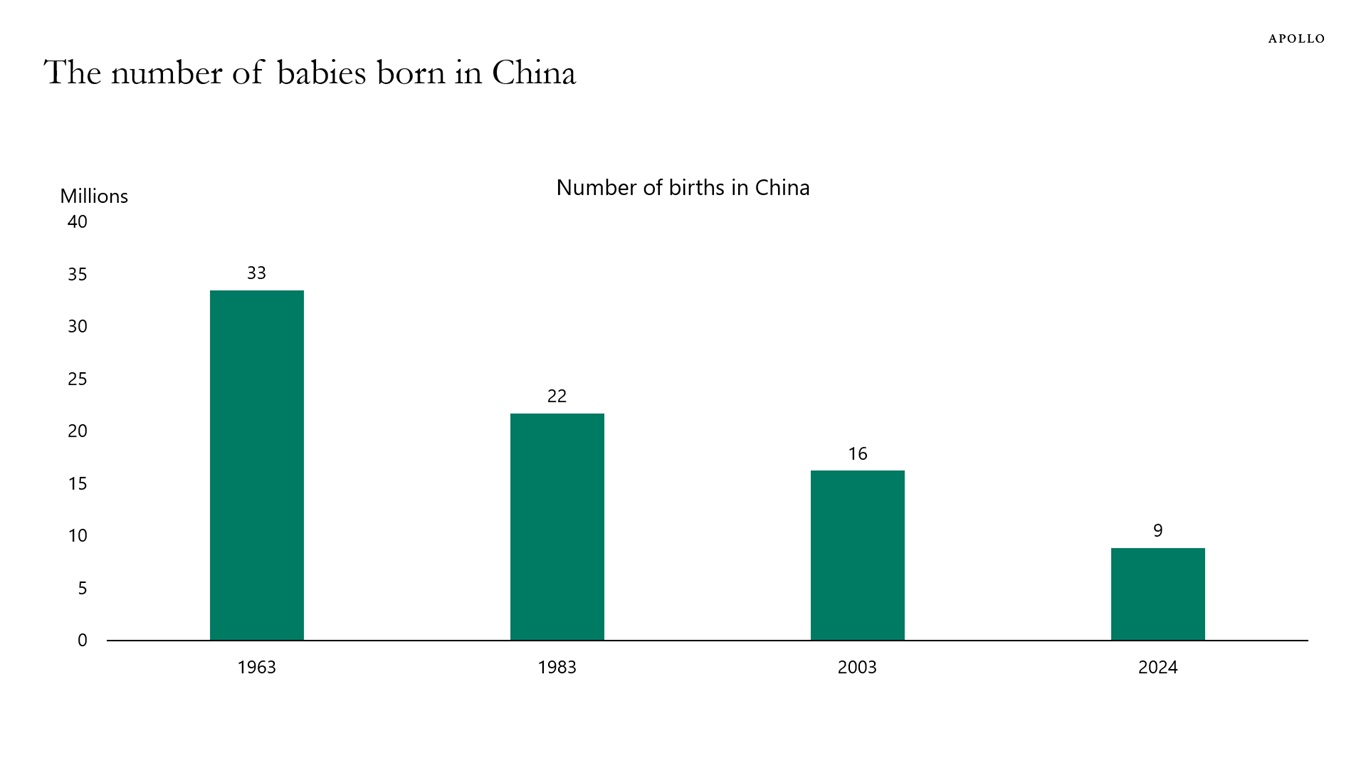
Sources: United Nations, Apollo Chief Economist See important disclaimers at the bottom of the page.
-
Equity returns over the past five years are all about the Magnificent Seven versus everyone else, see chart below.
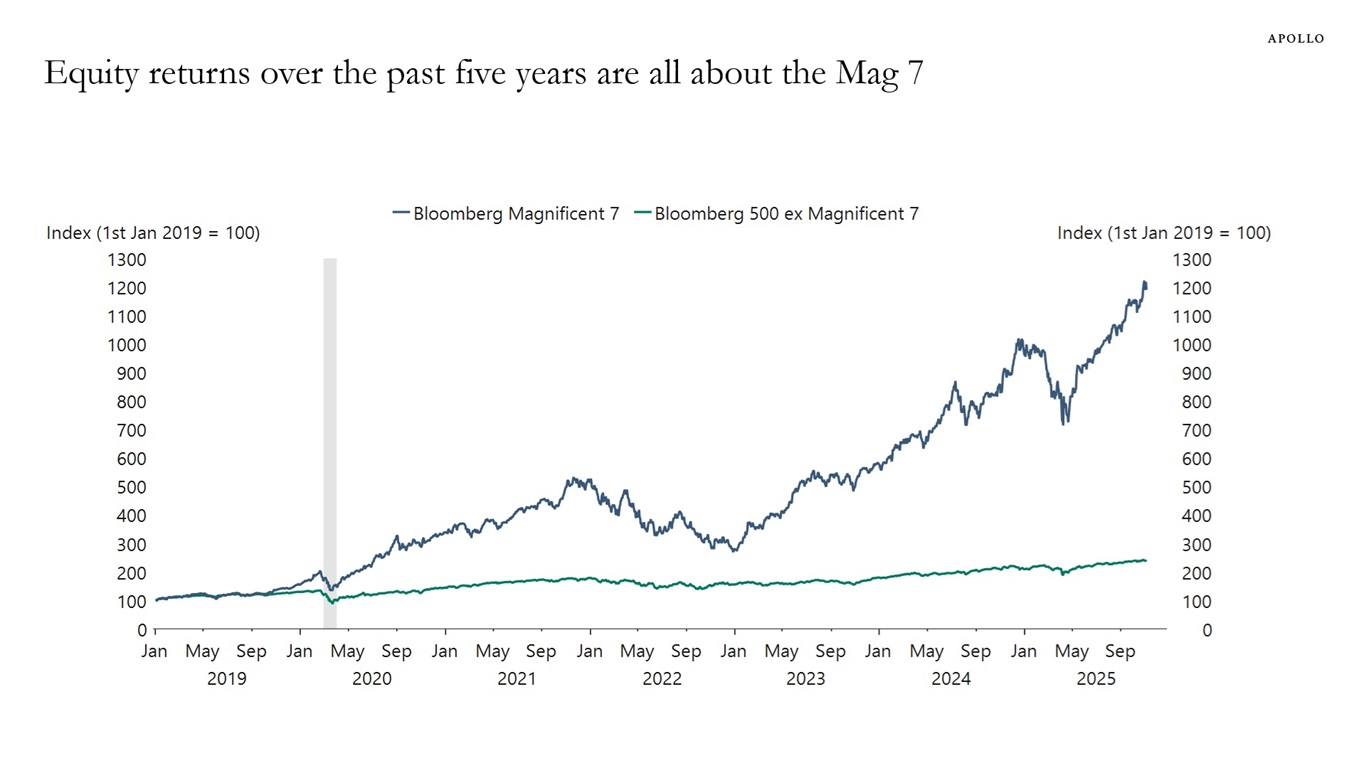
Sources: Bloomberg, Macrobond, Apollo Chief Economist See important disclaimers at the bottom of the page.
-
Fed balance sheet reduction and heavy T-bill issuance are putting upward pressure on spreads in money markets, see charts below.
The ongoing government shutdown has amplified this dynamic, as the Treasury General Account balance has risen with delayed federal spending, further draining reserves from the banking system.
With fewer reserves, funding markets face heightened competition for cash, pushing SOFR and TGCR above the IORB.
Money market funds shifting from the Fed’s reverse repo facility to higher-yielding assets, combined with year-end balance sheet constraints, are adding to the strain.
The bottom line is that the financial system is nearing the point where reserves are no longer ample. We are watching this development very closely because if rates volatility in funding markets persists, it could begin to have consequences for credit markets.
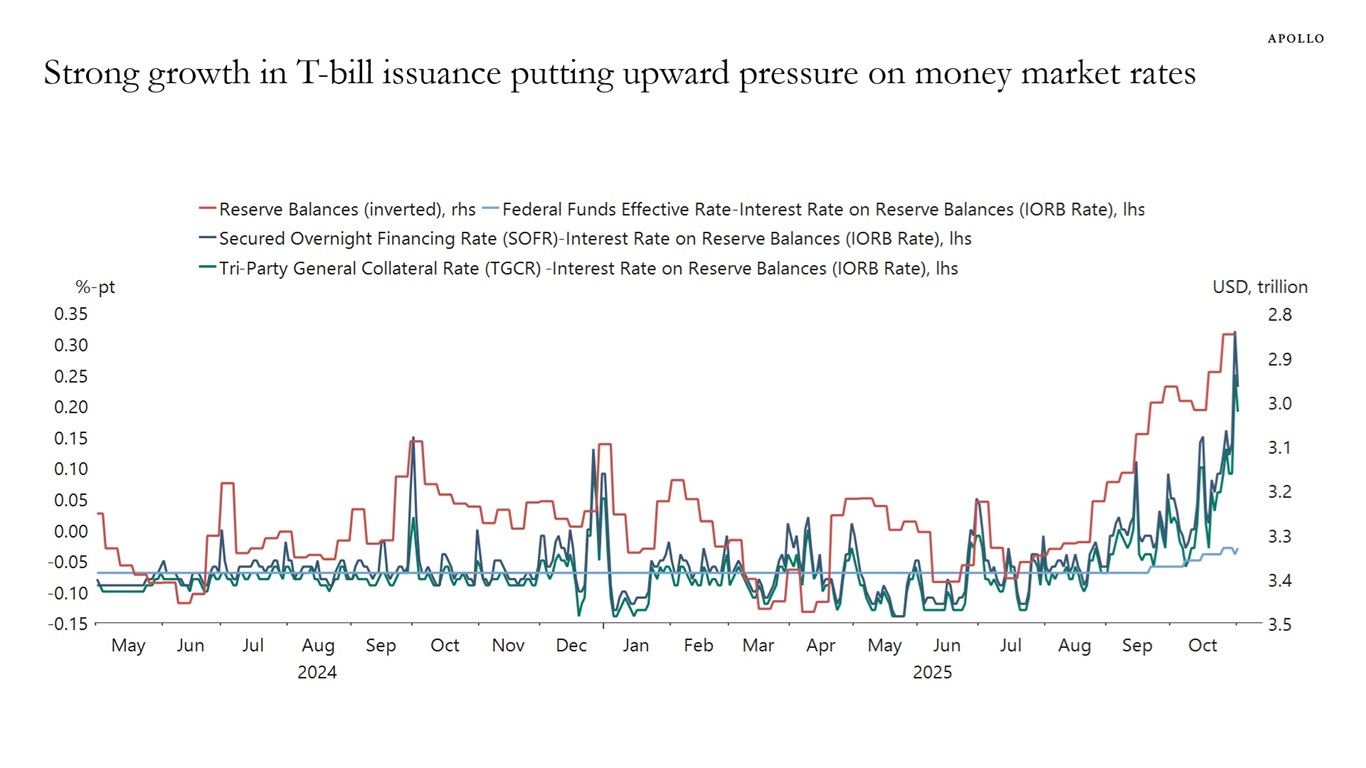
Sources: Federal Reserve, Macrobond, Apollo Chief Economist 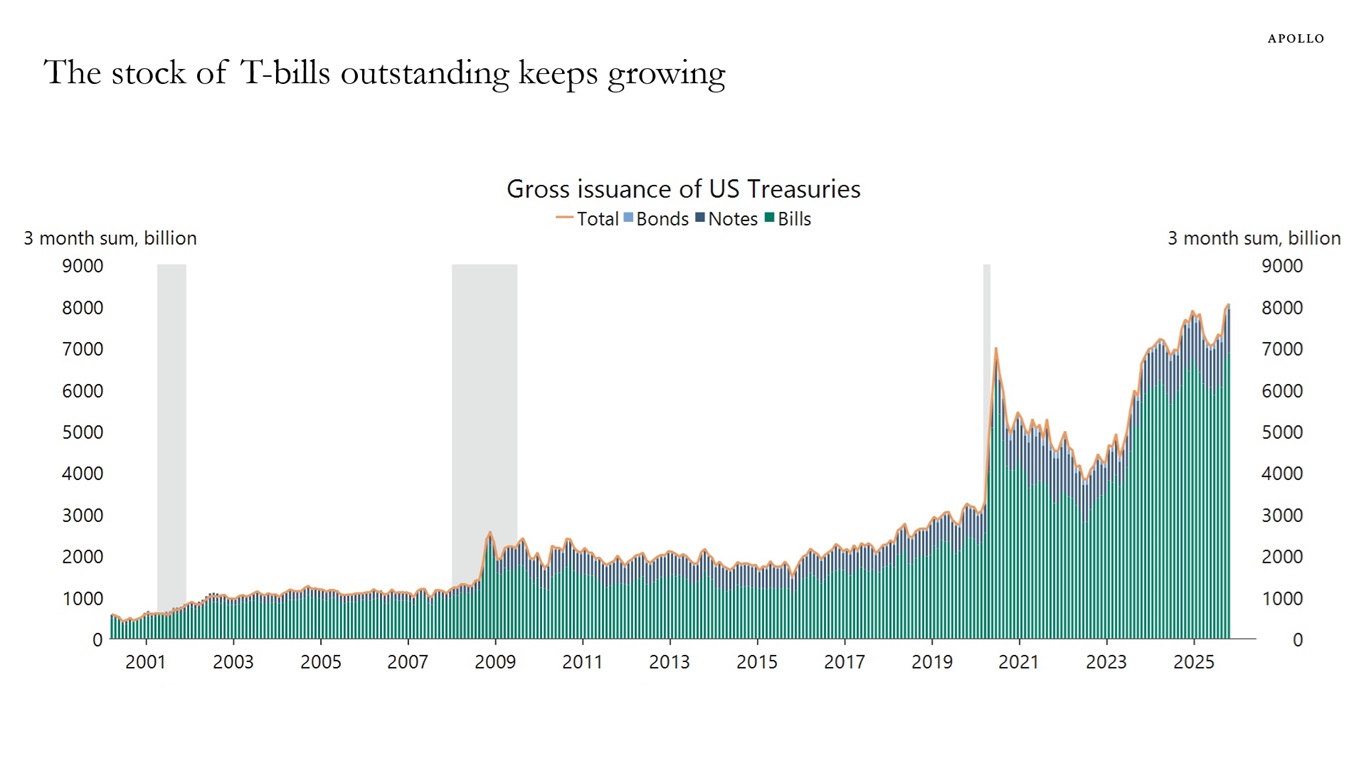
Sources: SIFMA (Securities Industry & Financial Markets Association), Macrobond, Apollo Chief Economist See important disclaimers at the bottom of the page.
-
Plotting the Warren Buffet indicator (US stock market cap to GDP) versus the Shiller cyclically adjusted P/E ratio shows that the S&P 500 today is at historically extreme valuations, see chart below.
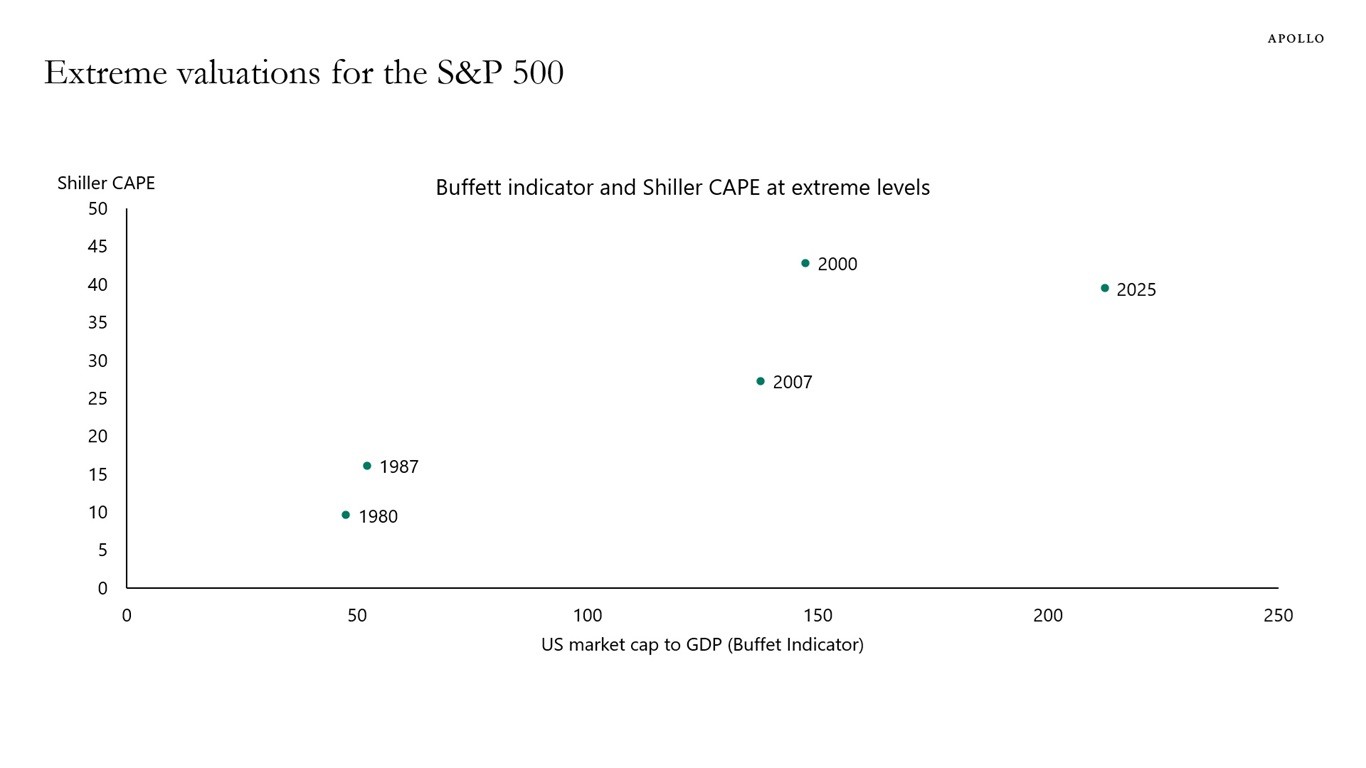
Sources: WDI, Robert Shiller, Macrobond, Bloomberg, Apollo Chief Economist See important disclaimers at the bottom of the page.

This presentation may not be distributed, transmitted or otherwise communicated to others in whole or in part without the express consent of Apollo Global Management, Inc. (together with its subsidiaries, “Apollo”).
Apollo makes no representation or warranty, expressed or implied, with respect to the accuracy, reasonableness, or completeness of any of the statements made during this presentation, including, but not limited to, statements obtained from third parties. Opinions, estimates and projections constitute the current judgment of the speaker as of the date indicated. They do not necessarily reflect the views and opinions of Apollo and are subject to change at any time without notice. Apollo does not have any responsibility to update this presentation to account for such changes. There can be no assurance that any trends discussed during this presentation will continue.
Statements made throughout this presentation are not intended to provide, and should not be relied upon for, accounting, legal or tax advice and do not constitute an investment recommendation or investment advice. Investors should make an independent investigation of the information discussed during this presentation, including consulting their tax, legal, accounting or other advisors about such information. Apollo does not act for you and is not responsible for providing you with the protections afforded to its clients. This presentation does not constitute an offer to sell, or the solicitation of an offer to buy, any security, product or service, including interest in any investment product or fund or account managed or advised by Apollo.
Certain statements made throughout this presentation may be “forward-looking” in nature. Due to various risks and uncertainties, actual events or results may differ materially from those reflected or contemplated in such forward-looking information. As such, undue reliance should not be placed on such statements. Forward-looking statements may be identified by the use of terminology including, but not limited to, “may”, “will”, “should”, “expect”, “anticipate”, “target”, “project”, “estimate”, “intend”, “continue” or “believe” or the negatives thereof or other variations thereon or comparable terminology.