


Want it delivered daily to your inbox?
-
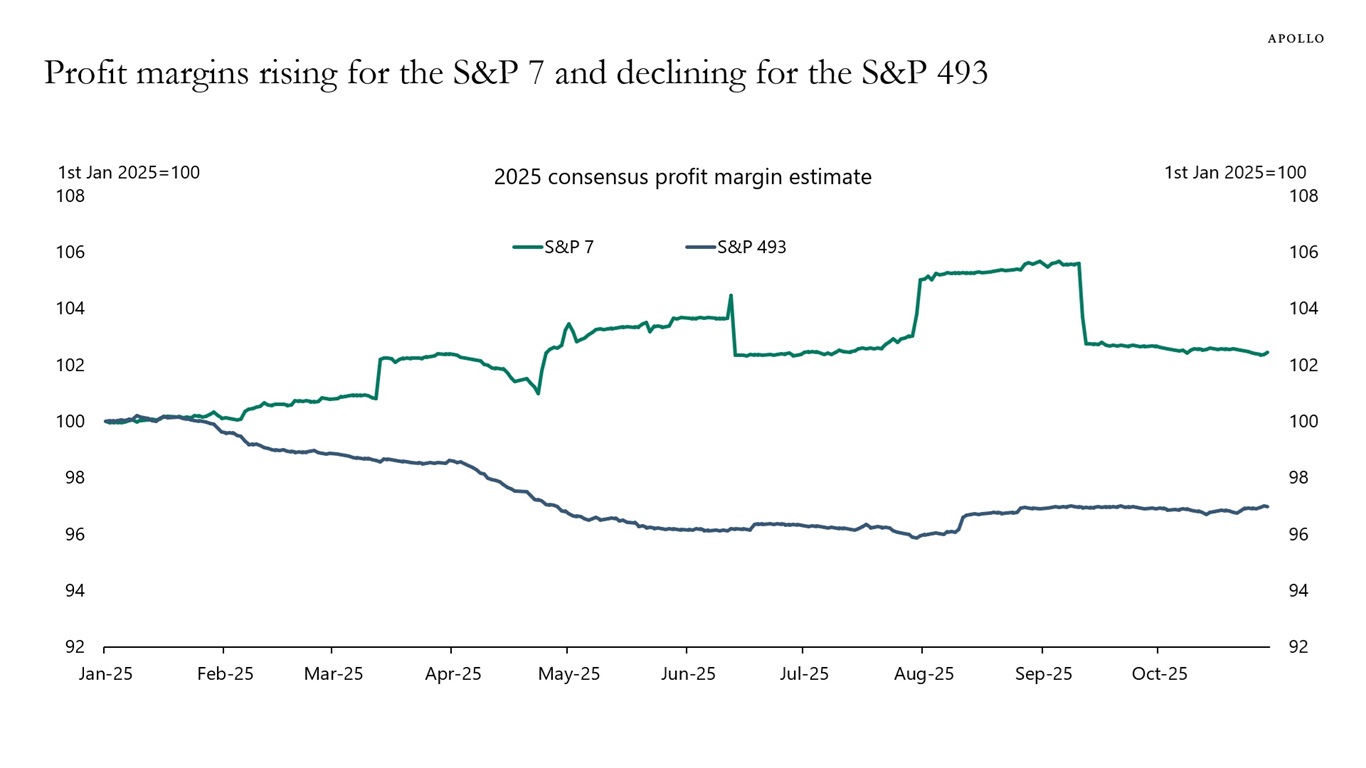
Since earlier this year, earnings expectations have increased for the Magnificent Seven and declined for the S&P 493, see charts below.
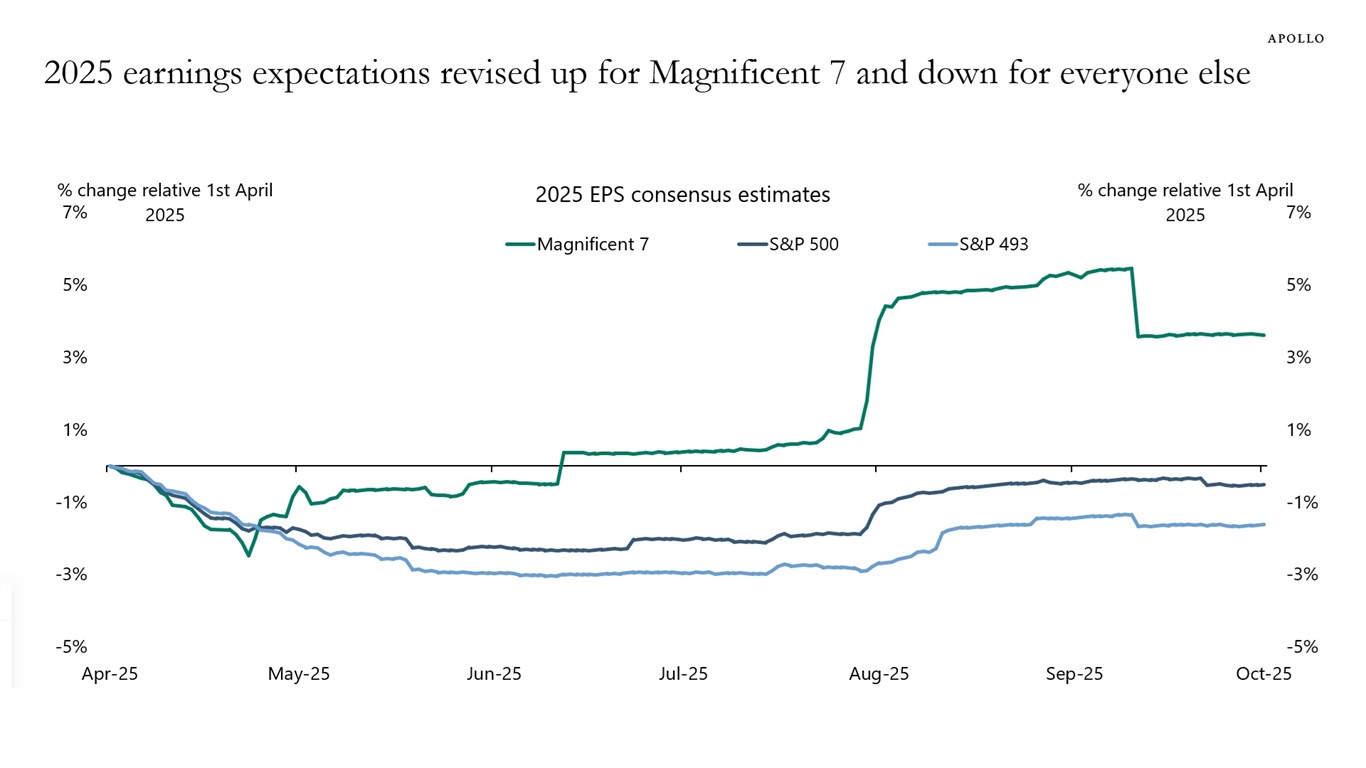
Sources: Bloomberg, Apollo Chief Economist 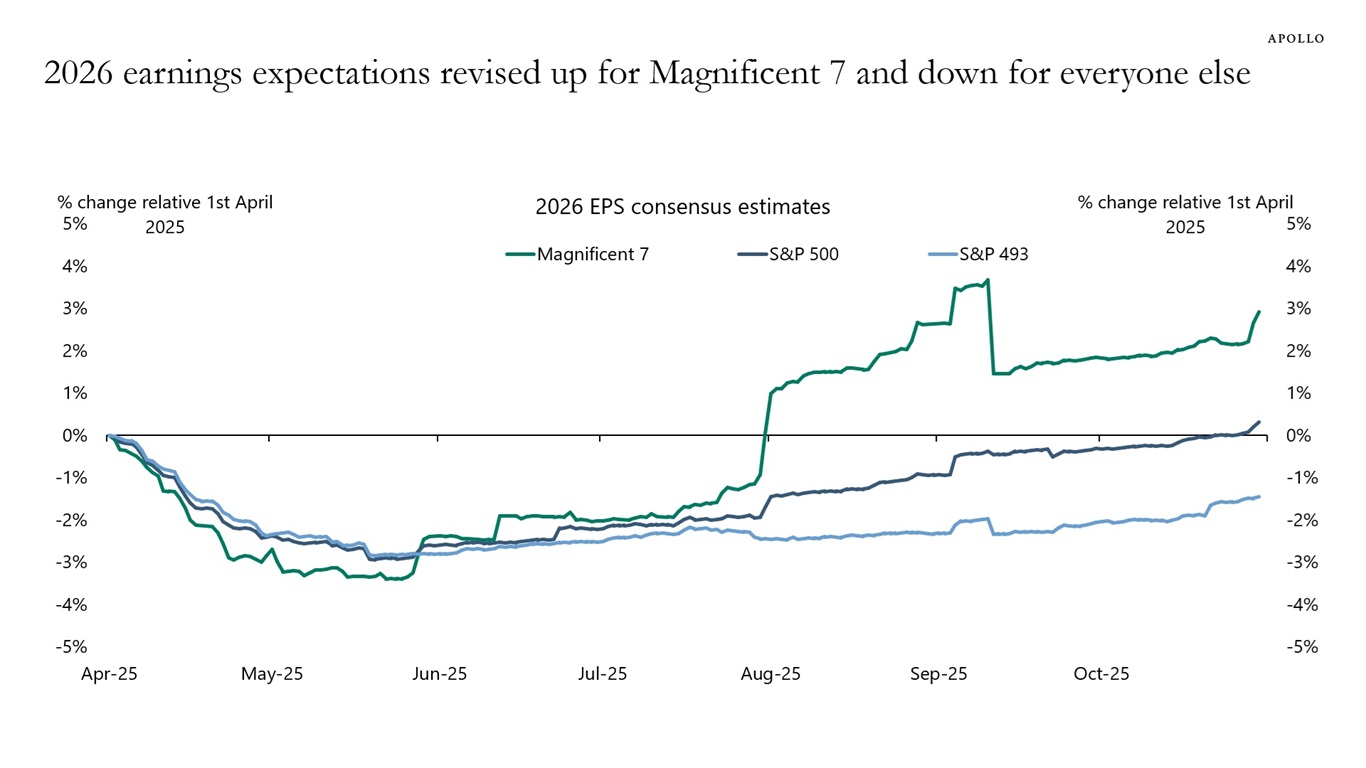
Sources: Bloomberg, Apollo Chief Economist See important disclaimers at the bottom of the page.
-
Alternative indicators from Revelio Labs, ADP, Challenger, MacroEdge, LinkUp, Indeed, Paychex, NFIB, San Francisco Fed and state-level jobless claims show a labor market that is still doing well.
Most importantly, there are no signs of a sudden rise in unemployment for cyclical reasons or AI reasons.
Our chart book with alternative indicators for the labor market is available here.
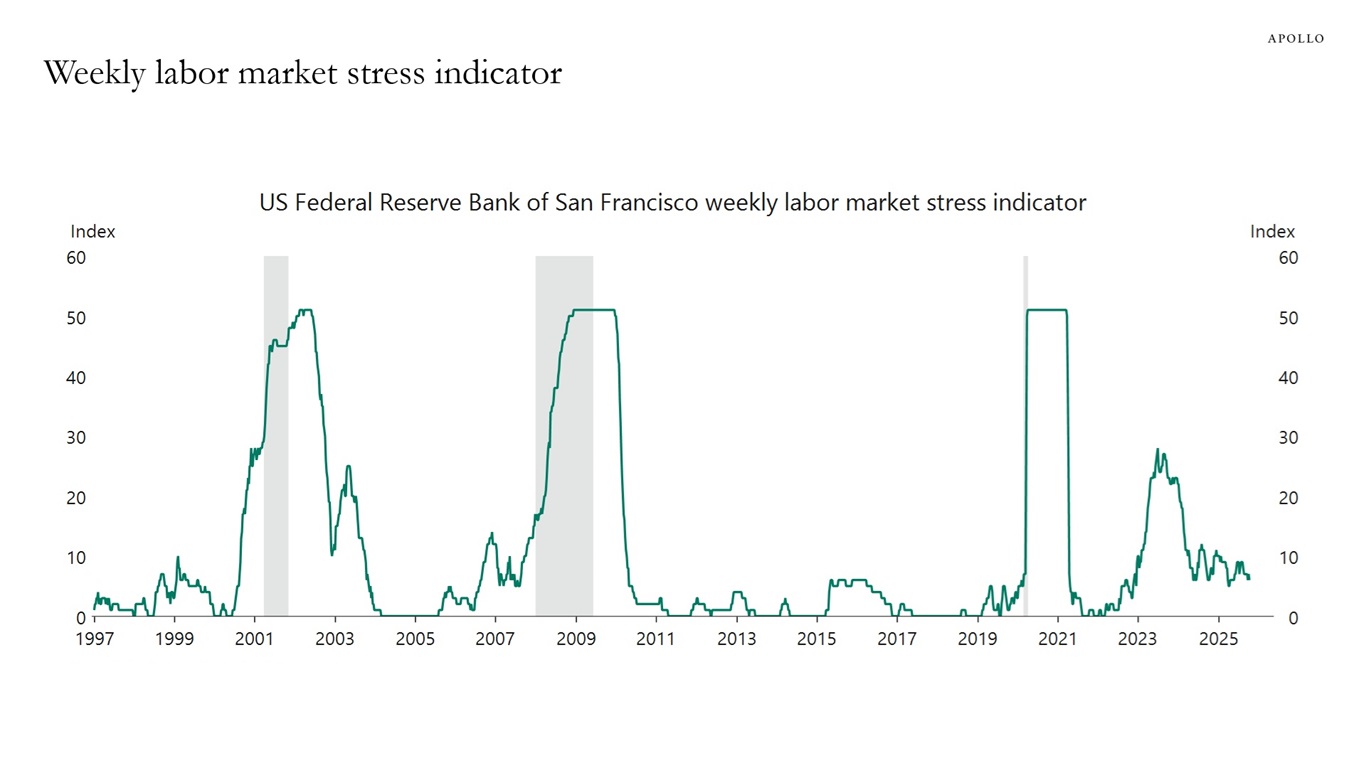
Note: Data represent the count of US states (including DC) experiencing accelerating unemployment as defined in Garimella, Jordà & Singh (2025). Sources: Federal Reserve Bank of San Francisco, Bloomberg, Macrobond, Apollo Chief Economist
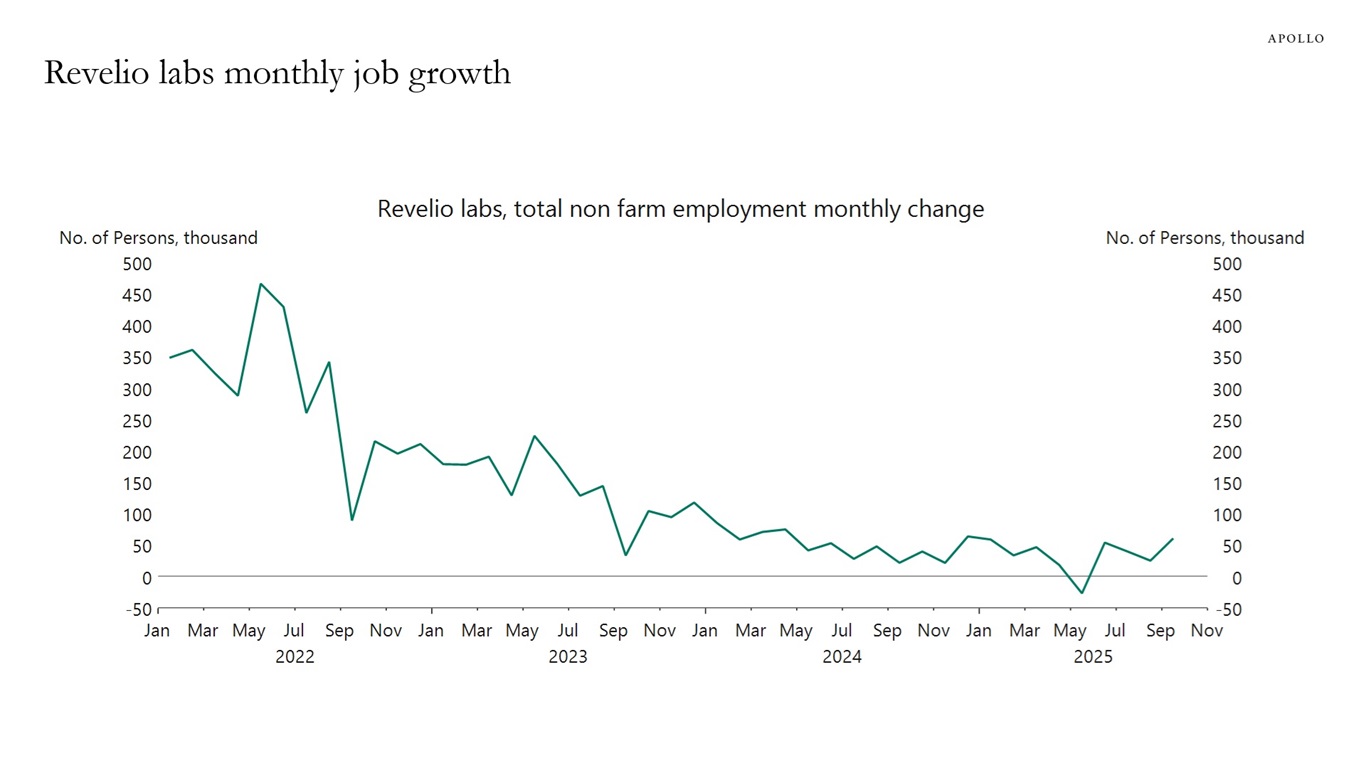
Sources: Revelio Labs, Macrobond, Apollo Chief Economist 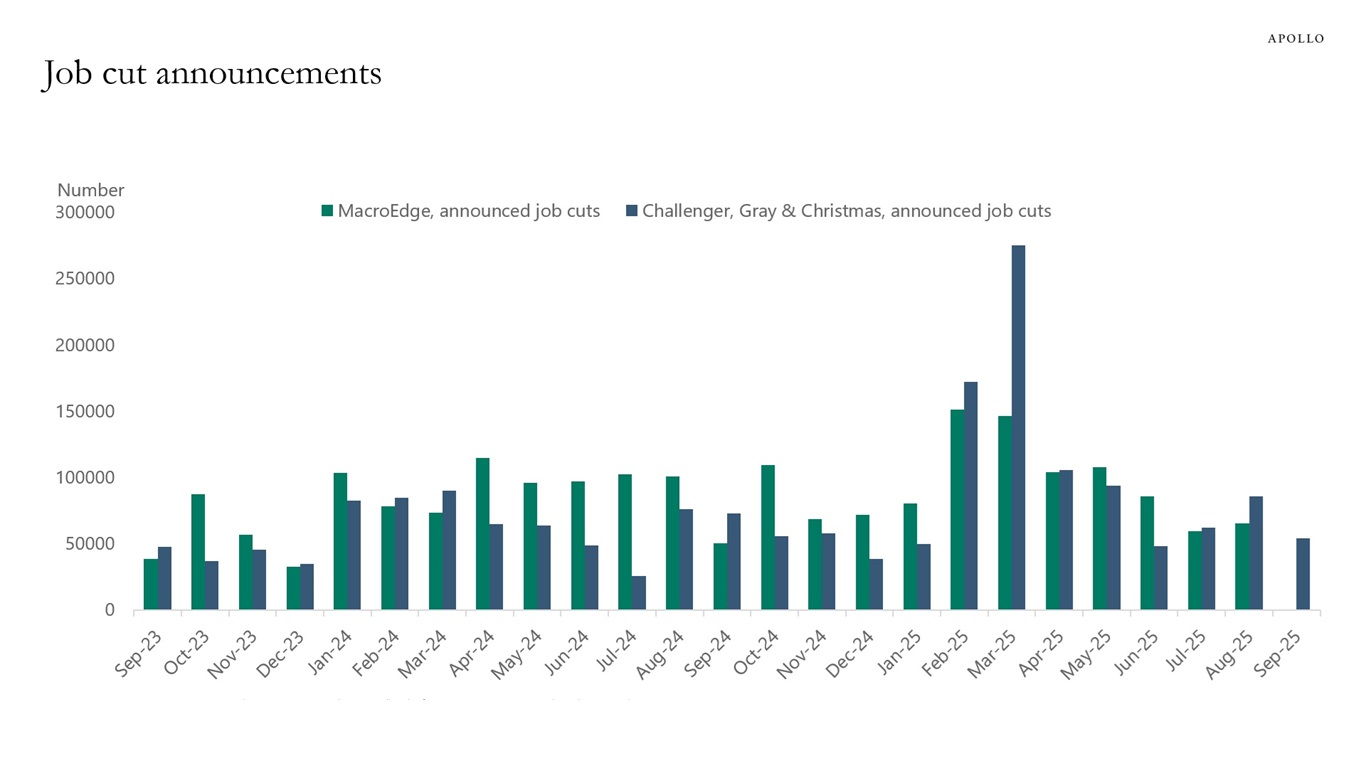
Notes: MacroEdge job-cuts tracker aggregates public job-cut announcements using four inputs: DailyJobCuts.com, state WARN notices, TrueUp, and Google News.
Challenger Gray & Christmas data are compiled from company press releases, news reports, and SEC filings. Sources: MacroEdge, Challenger, Gray & Christmas, Haver Analytics, Apollo Chief Economist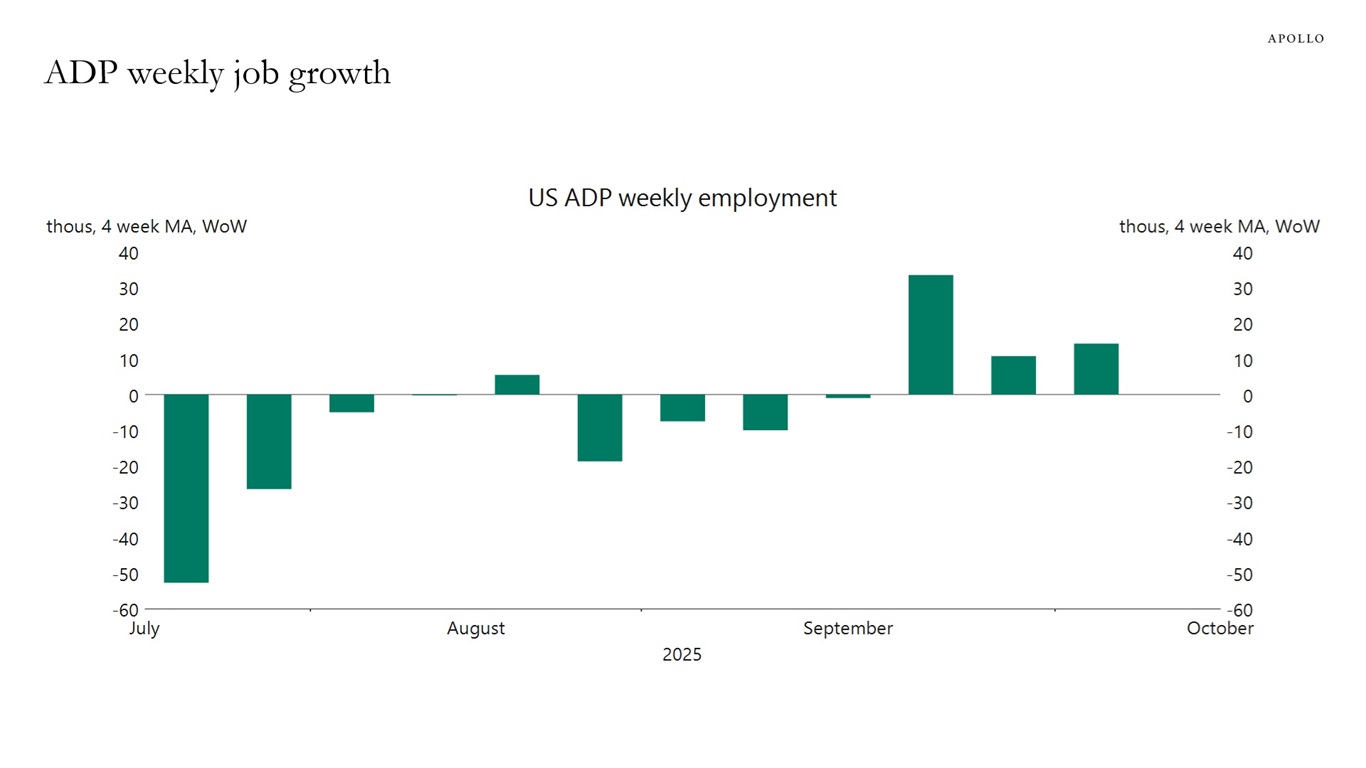
Sources: ADP, Bloomberg, Macrobond, Apollo Chief Economist 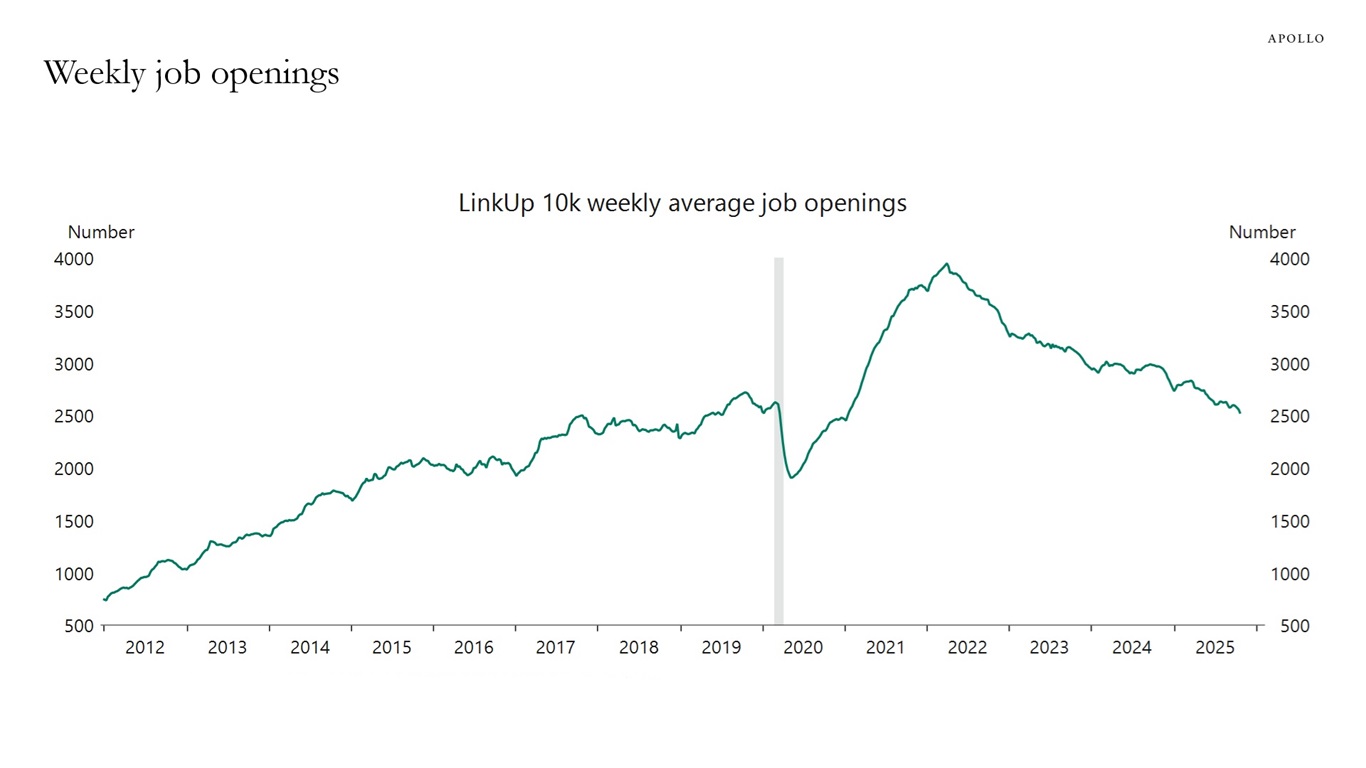
Notes: The LinkUp 10,000 index captures the sum of US job openings from the top 10,000 global employers with the most US-based job openings. Sources: LinkUp, Bloomberg, Macrobond, Apollo Chief Economist See important disclaimers at the bottom of the page.
-
Roughly 25% of the US adult population have a FICO score below 660, see chart below.
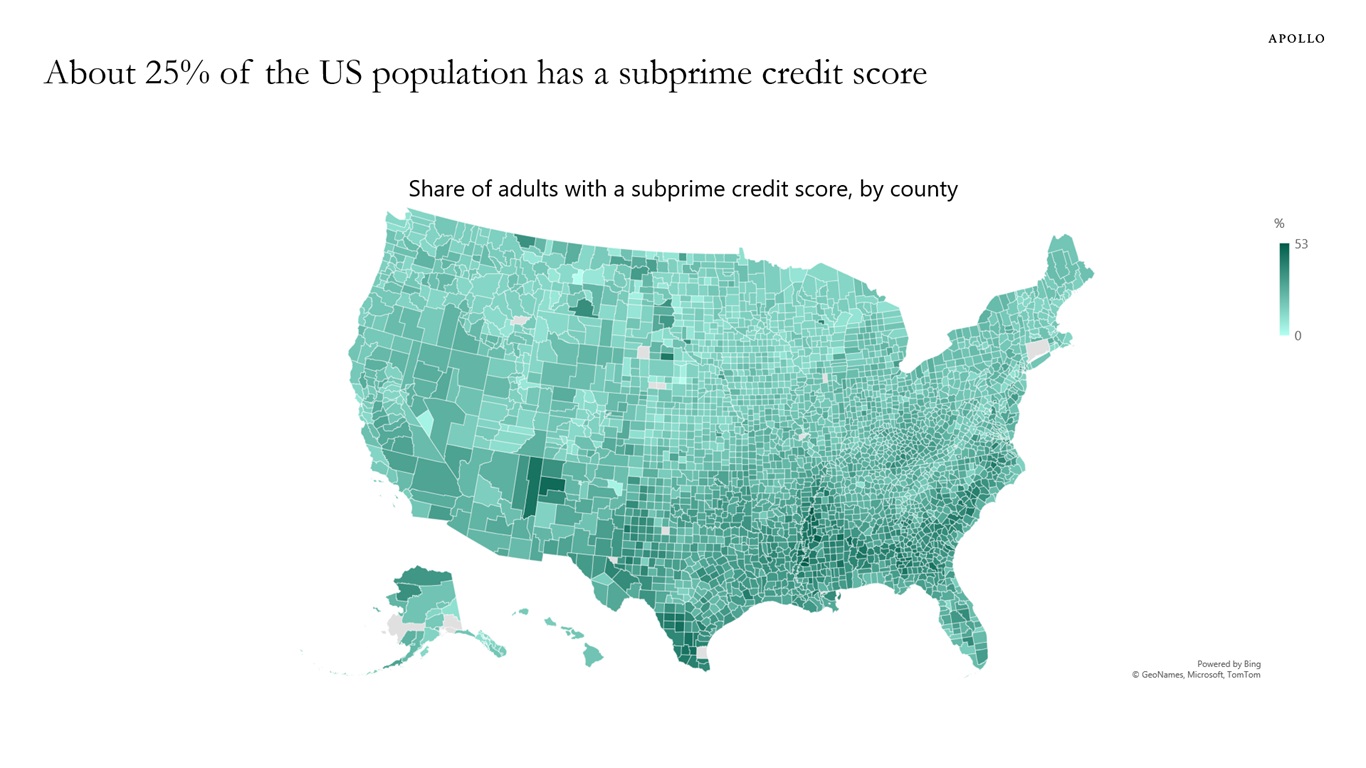
Sources: Equifax, Federal Reserve Bank of New York via FRED, Apollo Chief Economist See important disclaimers at the bottom of the page.
-
A smaller and smaller share of all tech jobs in the US are in California, see chart below.
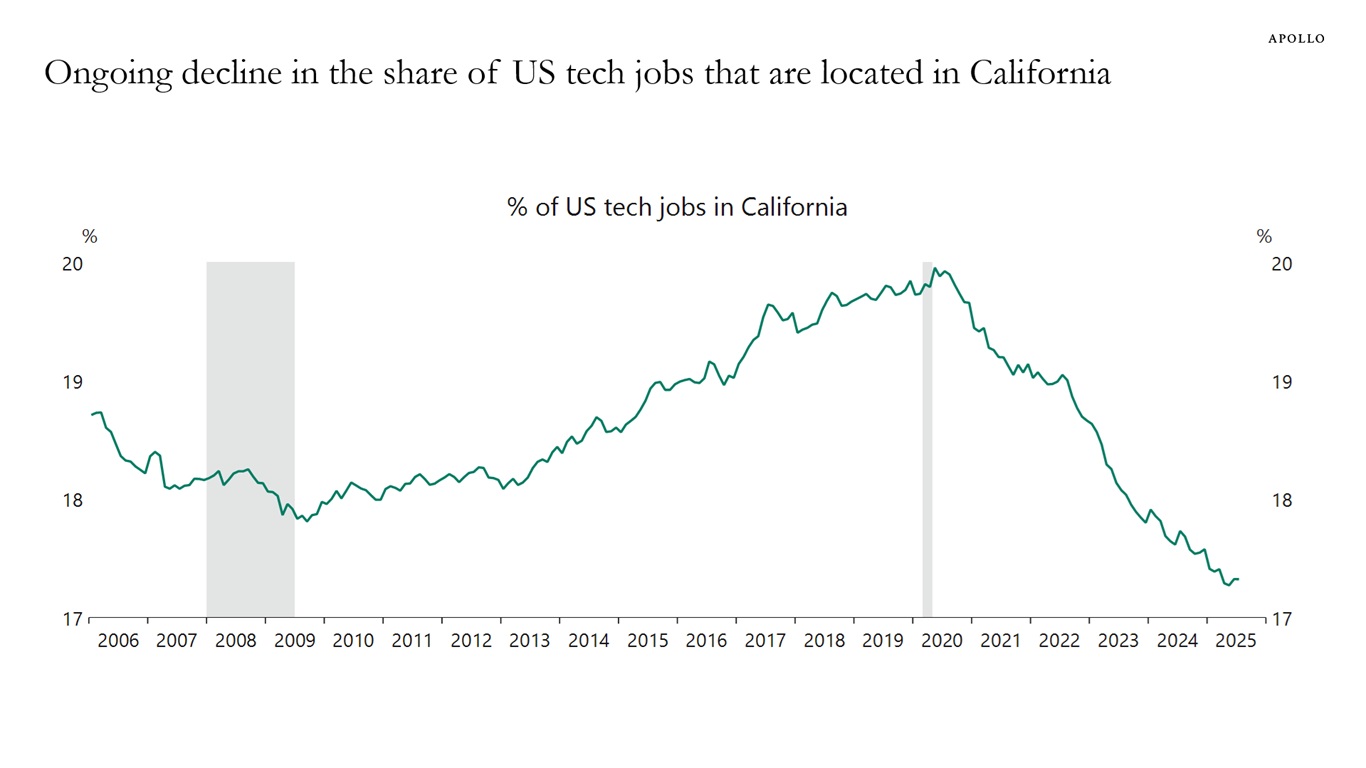
Note: Tech jobs are defined as total employment across (1) computer systems design and related services; (2) computer and electronic product manufacturing; (3) software publishers; (4) computing infrastructure providers, data processing, web hosting and related services; (5) media streaming distribution services, social networks and other media networks and content providers, and (6) web search portals, libraries, archives and other information services. Sources: US Bureau of Labor Statistics (BLS), Macrobond, Apollo Chief Economist See important disclaimers at the bottom of the page.
-
The current debate about electricity prices is misguided. Inflation in electricity prices needs to be compared with inflation in the overall CPI, and over the past decade, electricity prices have increased exactly as fast as the overall price level in the economy, see chart below.
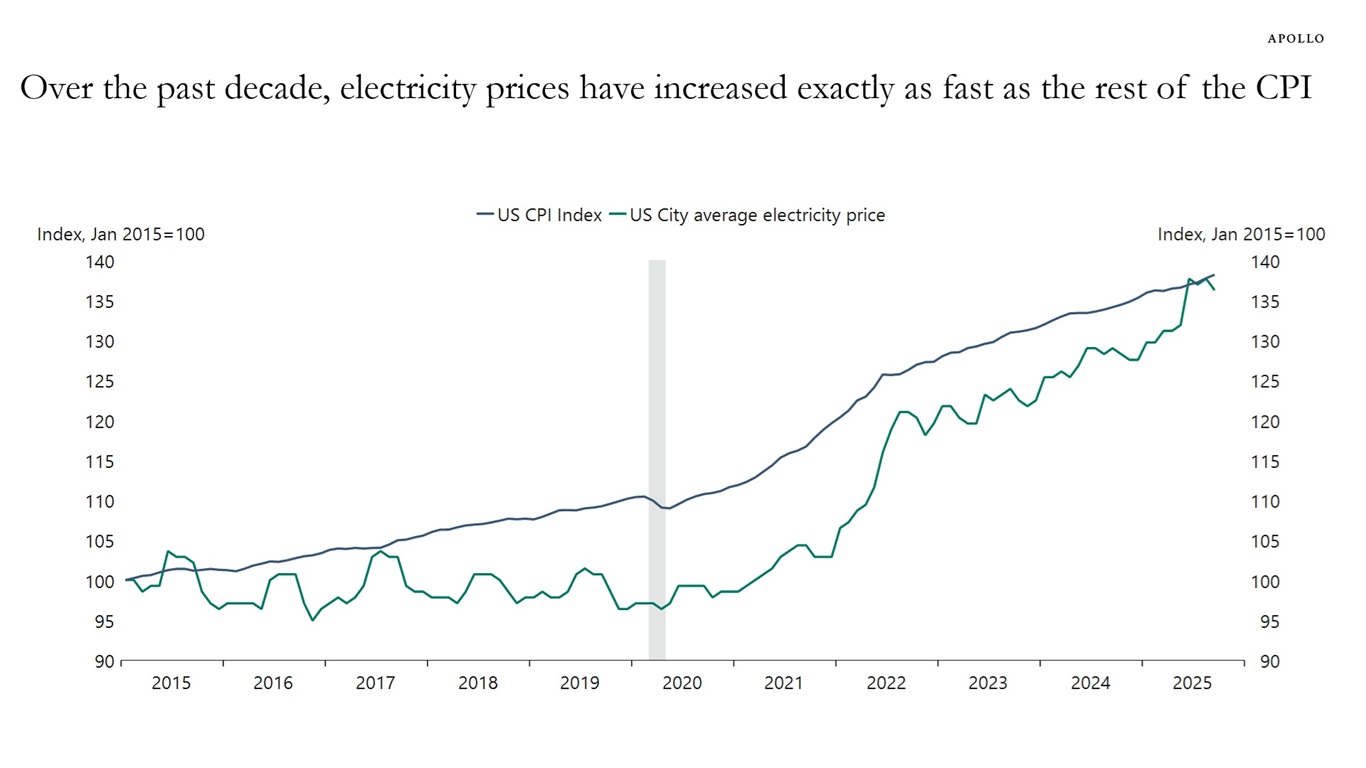
Sources: US Bureau of Labor Statistics (BLS), Macrobond, Apollo Chief Economist See important disclaimers at the bottom of the page.
-
Since the beginning of the year, profit margins have increased for the Magnificent Seven and declined for everyone else, see chart below.
Sources: Bloomberg, Apollo Chief Economist See important disclaimers at the bottom of the page.
-
The weekly data for bankruptcy filings shows a clear downtrend in recent months, see chart below.
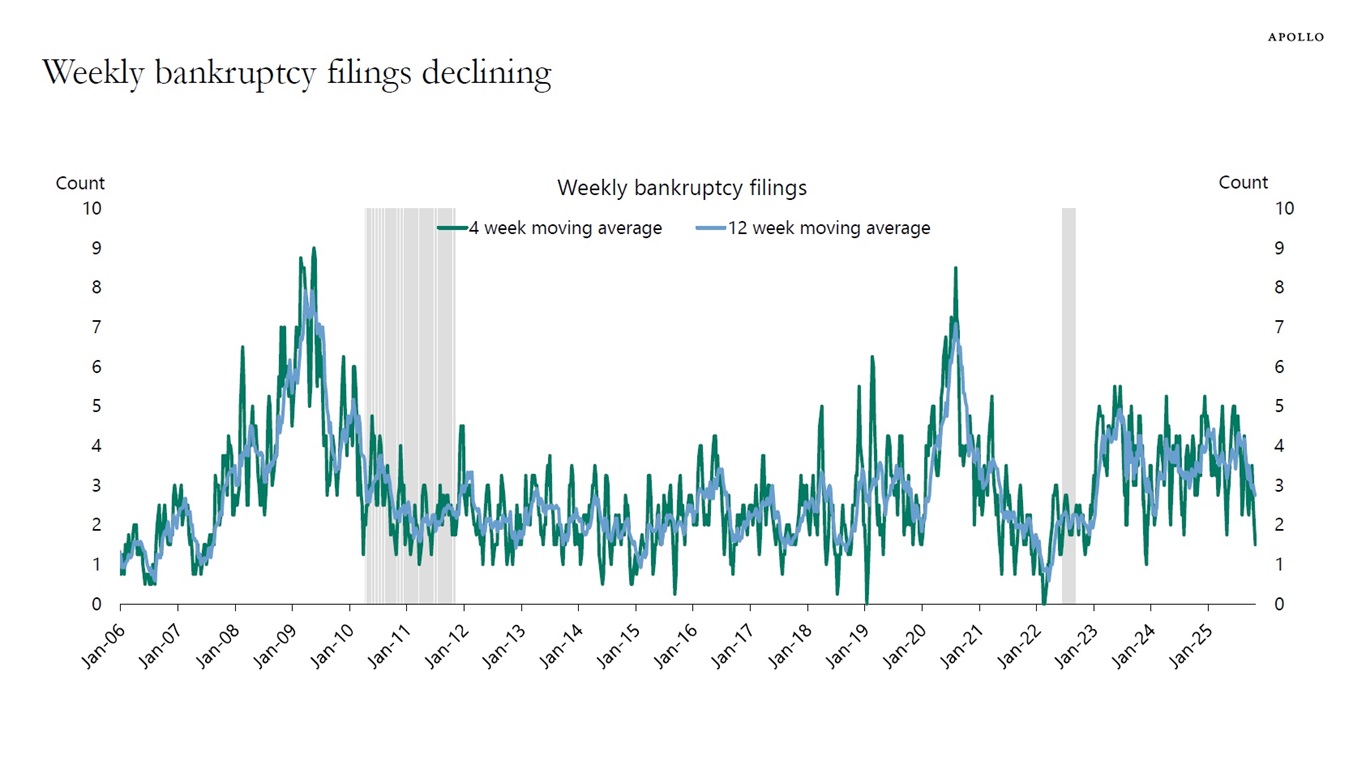
Note: Filings are for companies with more than $50mn in liabilities. For week ending on October 28, 2025. Sources: Bloomberg, Apollo Chief Economist See important disclaimers at the bottom of the page.
-
The number of publicly listed companies has declined by 50% since the mid-1990s, and there is a rising trend in the number of public companies that are taken private, see chart below.
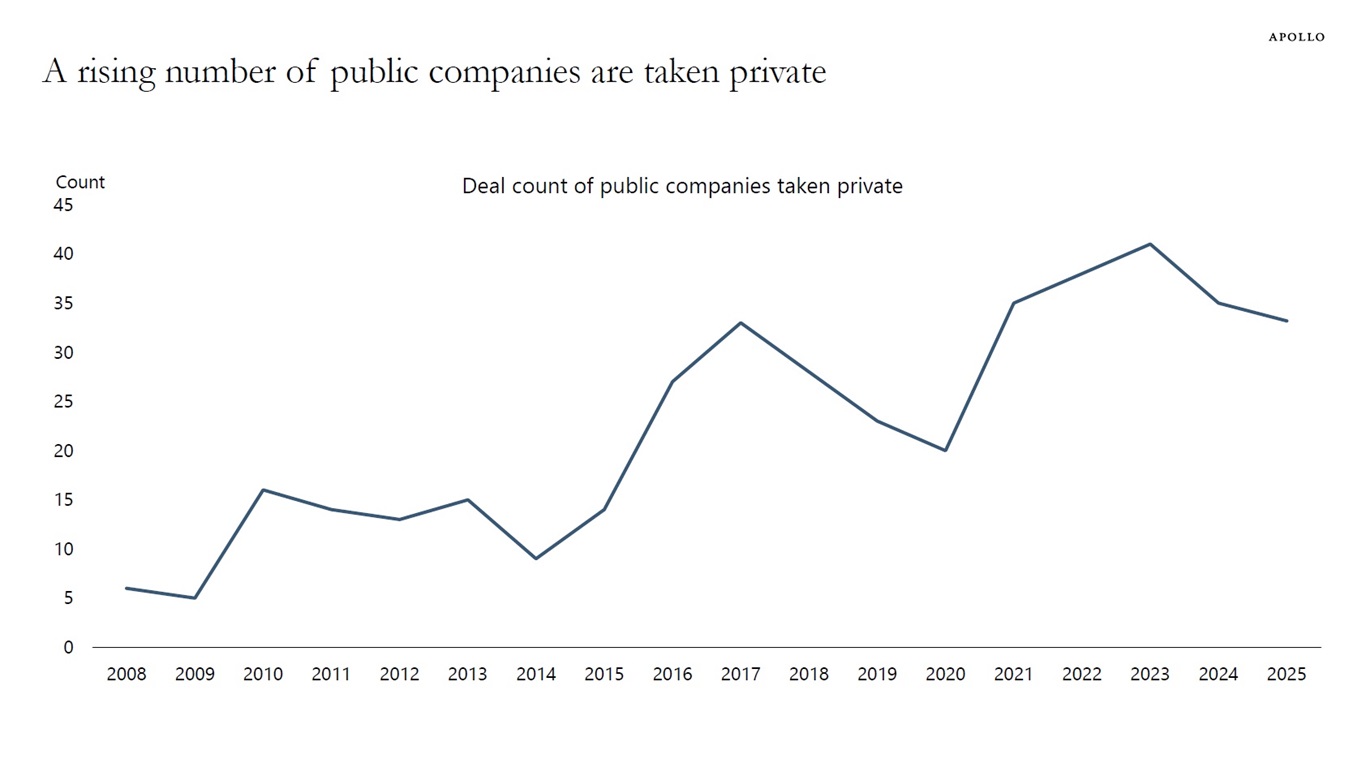
Data as of October 13, 2025. Note: 2025 numbers are annualized. Sources: PitchBook, Apollo Chief Economist See important disclaimers at the bottom of the page.
-
Global investment in clean energy is rising, and Europe is accounting for the biggest share, see charts below.
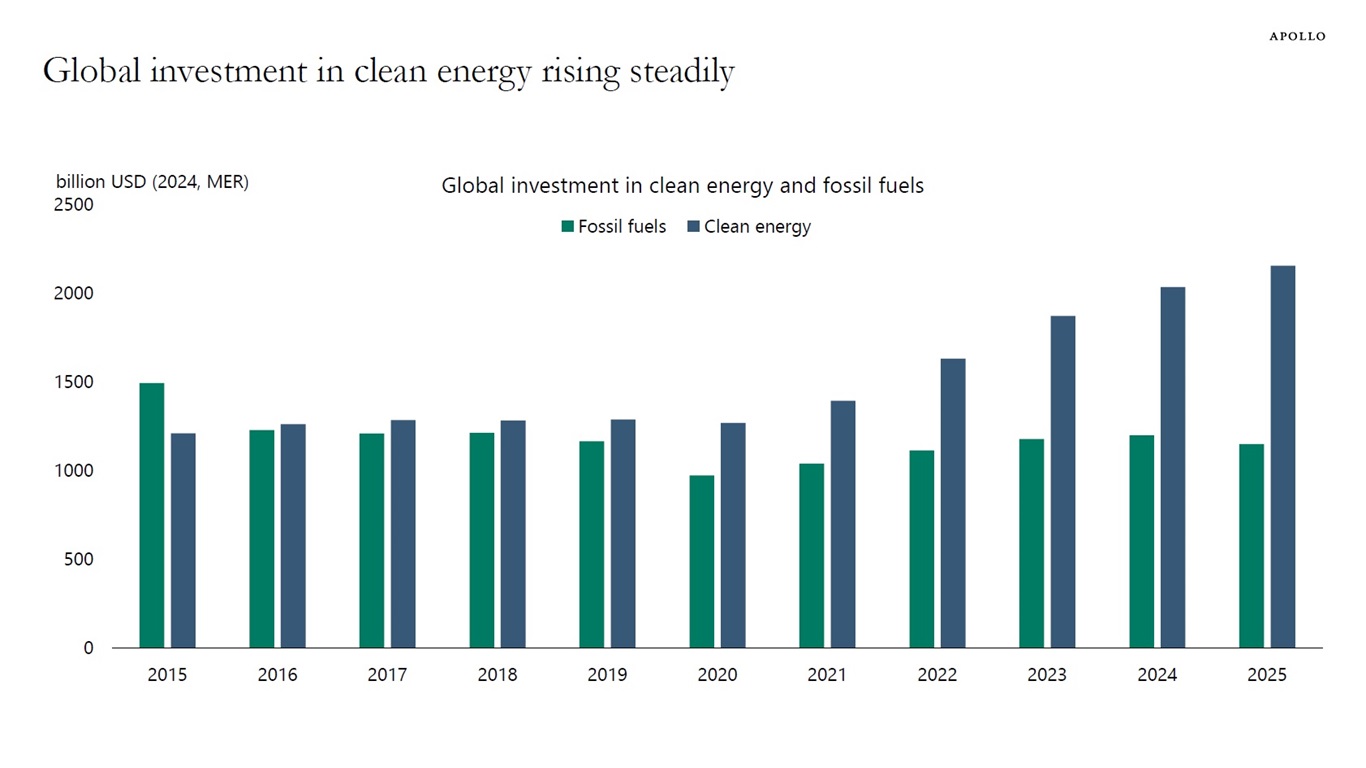
Sources: IEA, Apollo Chief Economist 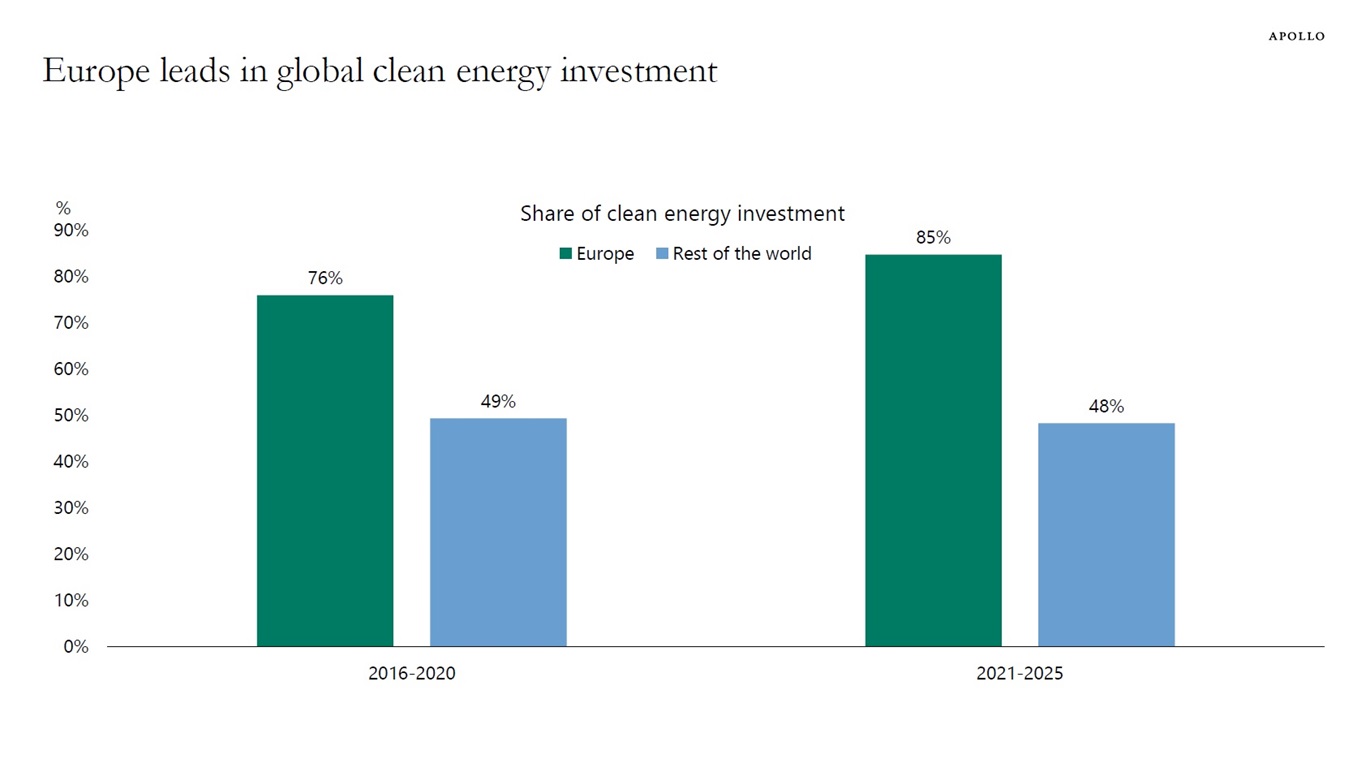
Sources: IEA, Apollo Chief Economist 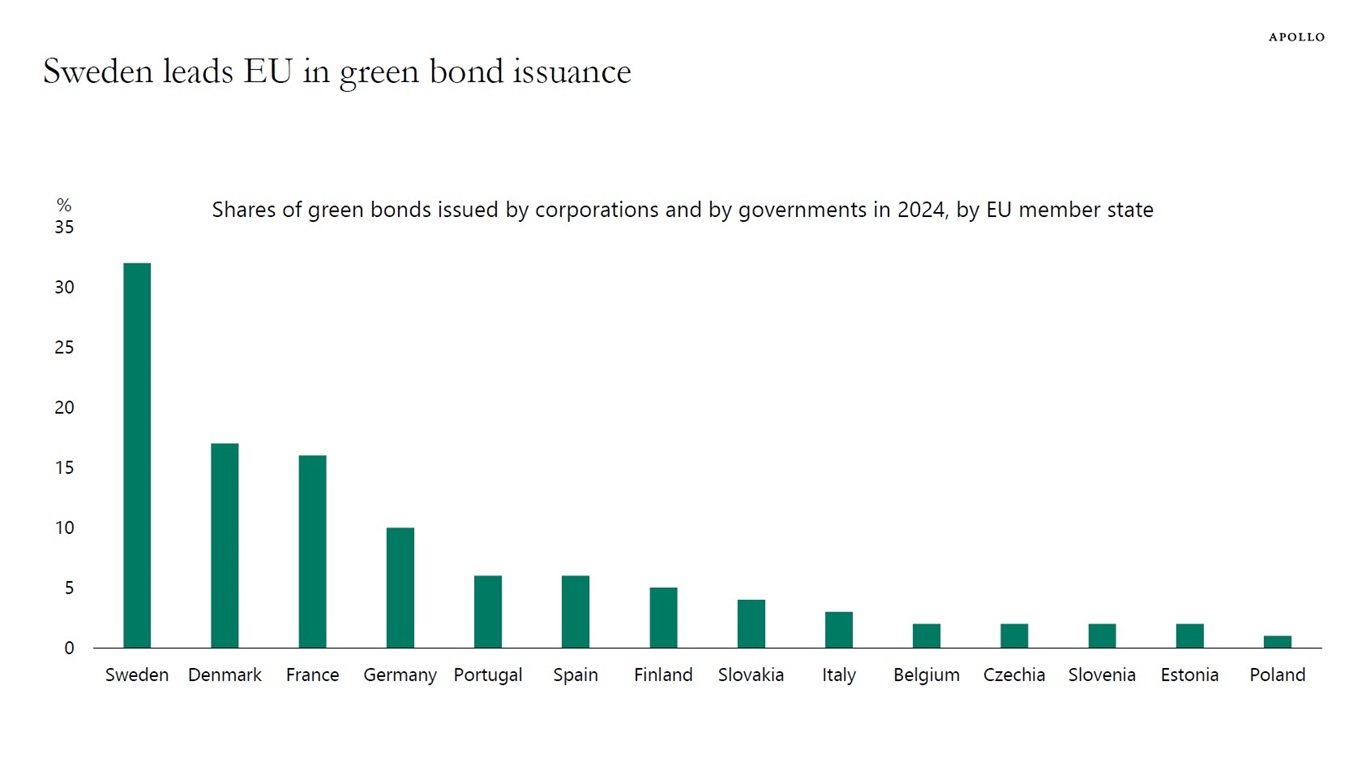
Sources: European Environment Agency, Apollo Chief Economist See important disclaimers at the bottom of the page.
-
Hyperscalers are currently spending a record high 60% of their operating cash flow on capex, see chart below.
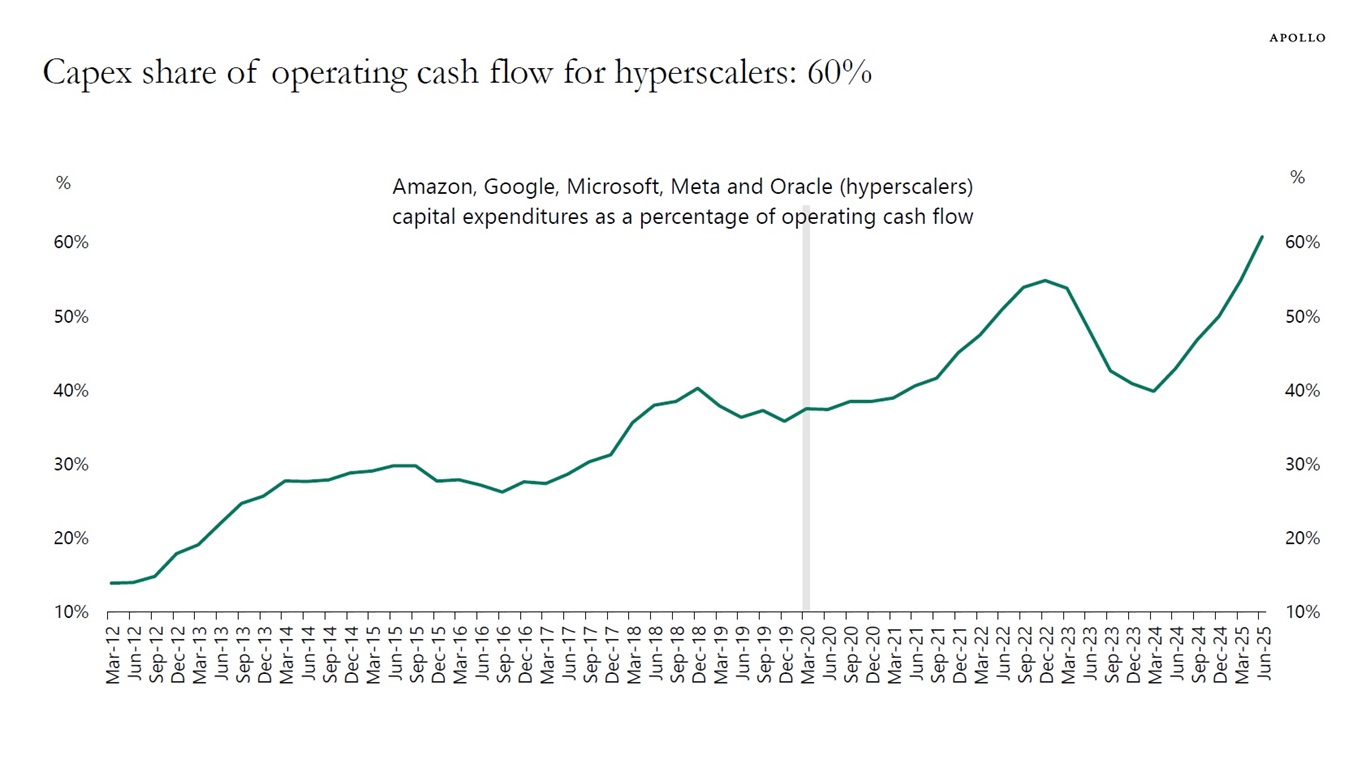
Sources: Bloomberg, Apollo Chief Economist See important disclaimers at the bottom of the page.

This presentation may not be distributed, transmitted or otherwise communicated to others in whole or in part without the express consent of Apollo Global Management, Inc. (together with its subsidiaries, “Apollo”).
Apollo makes no representation or warranty, expressed or implied, with respect to the accuracy, reasonableness, or completeness of any of the statements made during this presentation, including, but not limited to, statements obtained from third parties. Opinions, estimates and projections constitute the current judgment of the speaker as of the date indicated. They do not necessarily reflect the views and opinions of Apollo and are subject to change at any time without notice. Apollo does not have any responsibility to update this presentation to account for such changes. There can be no assurance that any trends discussed during this presentation will continue.
Statements made throughout this presentation are not intended to provide, and should not be relied upon for, accounting, legal or tax advice and do not constitute an investment recommendation or investment advice. Investors should make an independent investigation of the information discussed during this presentation, including consulting their tax, legal, accounting or other advisors about such information. Apollo does not act for you and is not responsible for providing you with the protections afforded to its clients. This presentation does not constitute an offer to sell, or the solicitation of an offer to buy, any security, product or service, including interest in any investment product or fund or account managed or advised by Apollo.
Certain statements made throughout this presentation may be “forward-looking” in nature. Due to various risks and uncertainties, actual events or results may differ materially from those reflected or contemplated in such forward-looking information. As such, undue reliance should not be placed on such statements. Forward-looking statements may be identified by the use of terminology including, but not limited to, “may”, “will”, “should”, “expect”, “anticipate”, “target”, “project”, “estimate”, “intend”, “continue” or “believe” or the negatives thereof or other variations thereon or comparable terminology.