


The Daily Spark is moving to Apollo.com— read the latest from Torsten Slok here.
Want it delivered daily to your inbox?
-
Although the US population continues to grow each year, the number of families with children under 18 reached a peak of around 37 million in 2007 and has declined to approximately 33 million in 2024, see chart below. This reflects demographic changes such as lower birth rates and aging of the population, even as overall population growth continues.
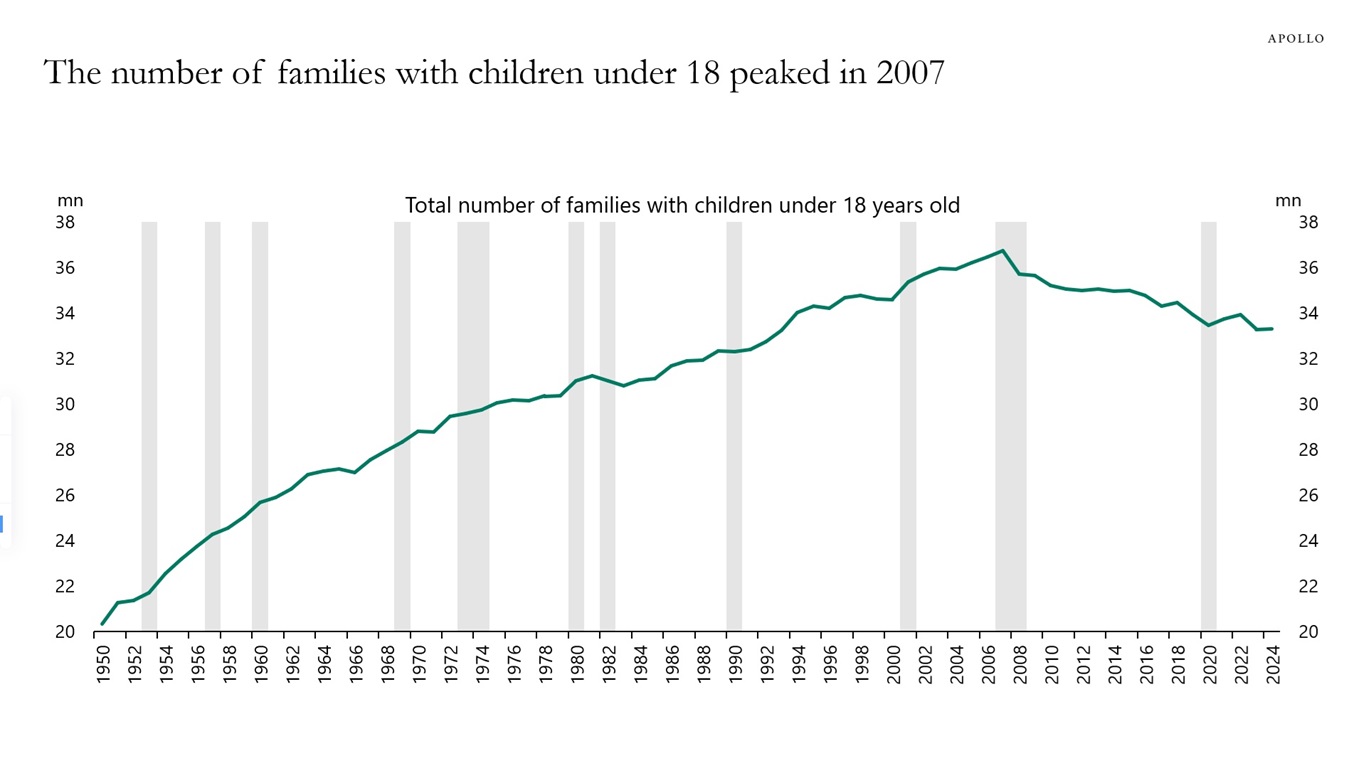
Sources: US Census Bureau, Apollo Chief Economist See important disclaimers at the bottom of the page.
-
When interest rates went up, annuity sales more than doubled, see chart below.
The strong demand for annuities continues to generate strong technical demand for credit.
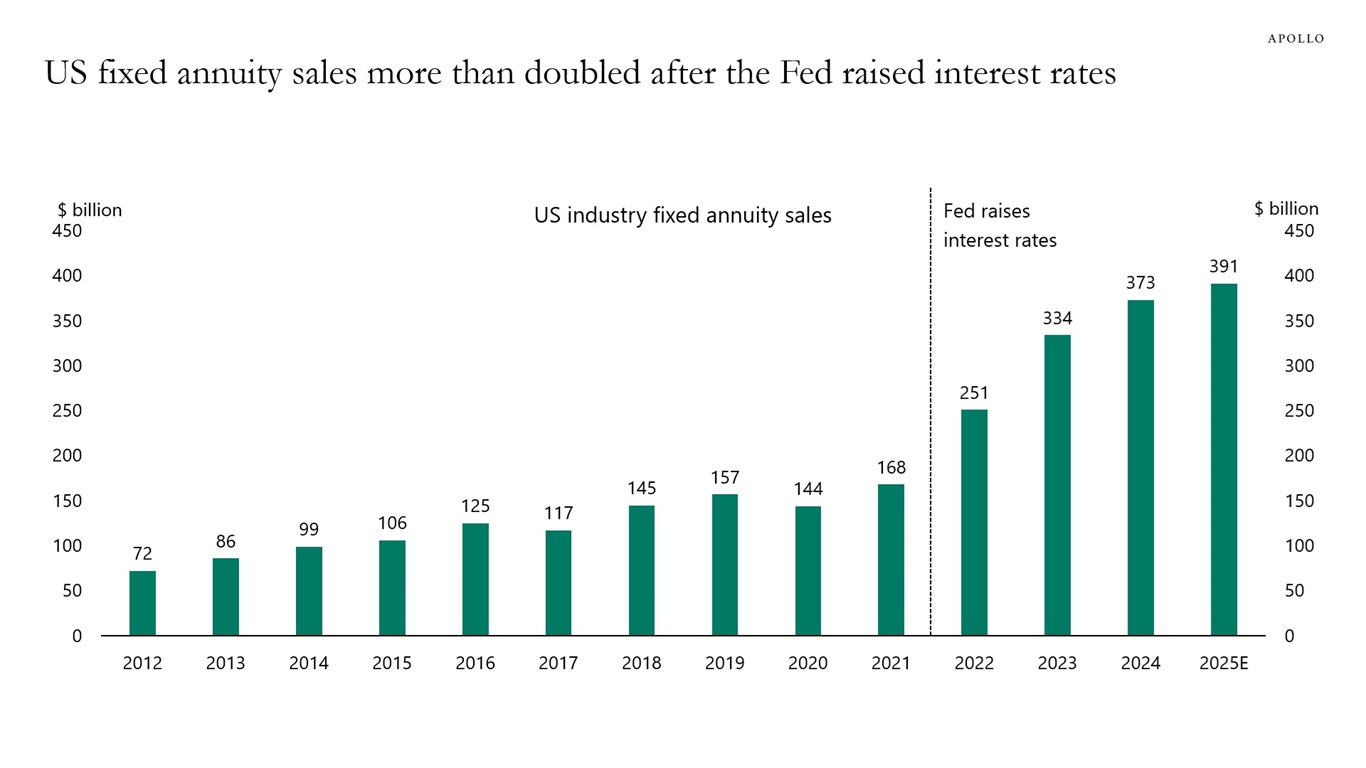
Note: Data from LIMRA Secure Retirement Institute includes total fixed rate annuities and registered indexed linked annuities (RILA). Annualized year-to-date LIMRA fixed annuity and RILA sales through 2Q’25. Sources: LIMRA Secure Retirement Institute, Apollo Chief Economist Register here to watch our 2026 Outlook class on Apollo Academy on Tuesday, December 16, 2025 at 11:00 AM ET — eligible for 1 CE credit. In addition to the macro outlook, you’ll also hear asset class perspectives from David Sambur (Private Equity), John Cortese (Credit), Olivia Wassenaar (Infrastructure) and Scott Weiner (Real Estate).
See important disclaimers at the bottom of the page.
-
After decades in which Germany had a better fiscal situation than Spain, the IMF is now forecasting a reversal in 2026 and 2027, see chart below.
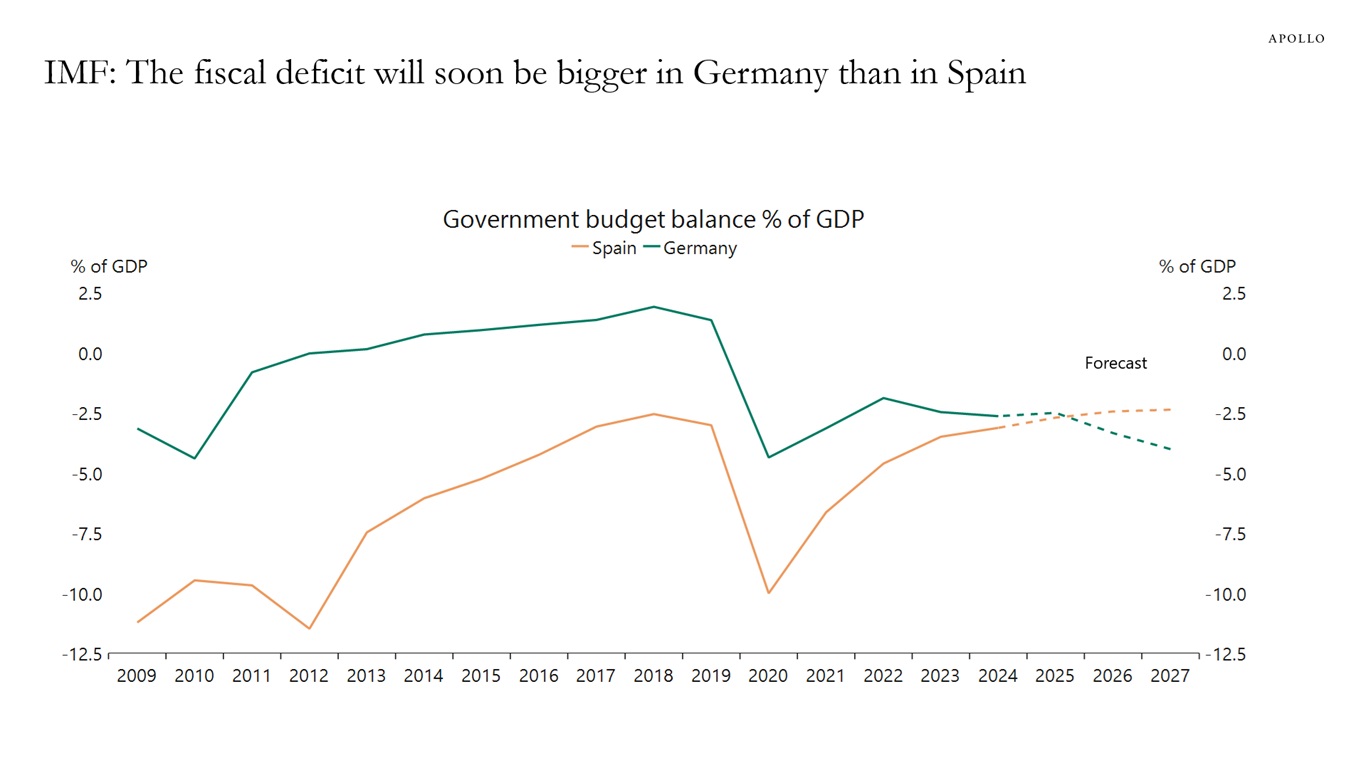
Sources: International Monetary Fund (IMF), Macrobond, Apollo Chief Economist Register here to watch our 2026 Outlook class on Apollo Academy on Tuesday, December 16, 2025 at 11:00 AM ET — eligible for 1 CE credit. In addition to the macro outlook, you’ll also hear asset class perspectives from David Sambur (Private Equity), John Cortese (Credit), Olivia Wassenaar (Infrastructure) and Scott Weiner (Real Estate).
See important disclaimers at the bottom of the page.
-
Prime brokerage and repo borrowings have essentially doubled over the past two years, see chart below.
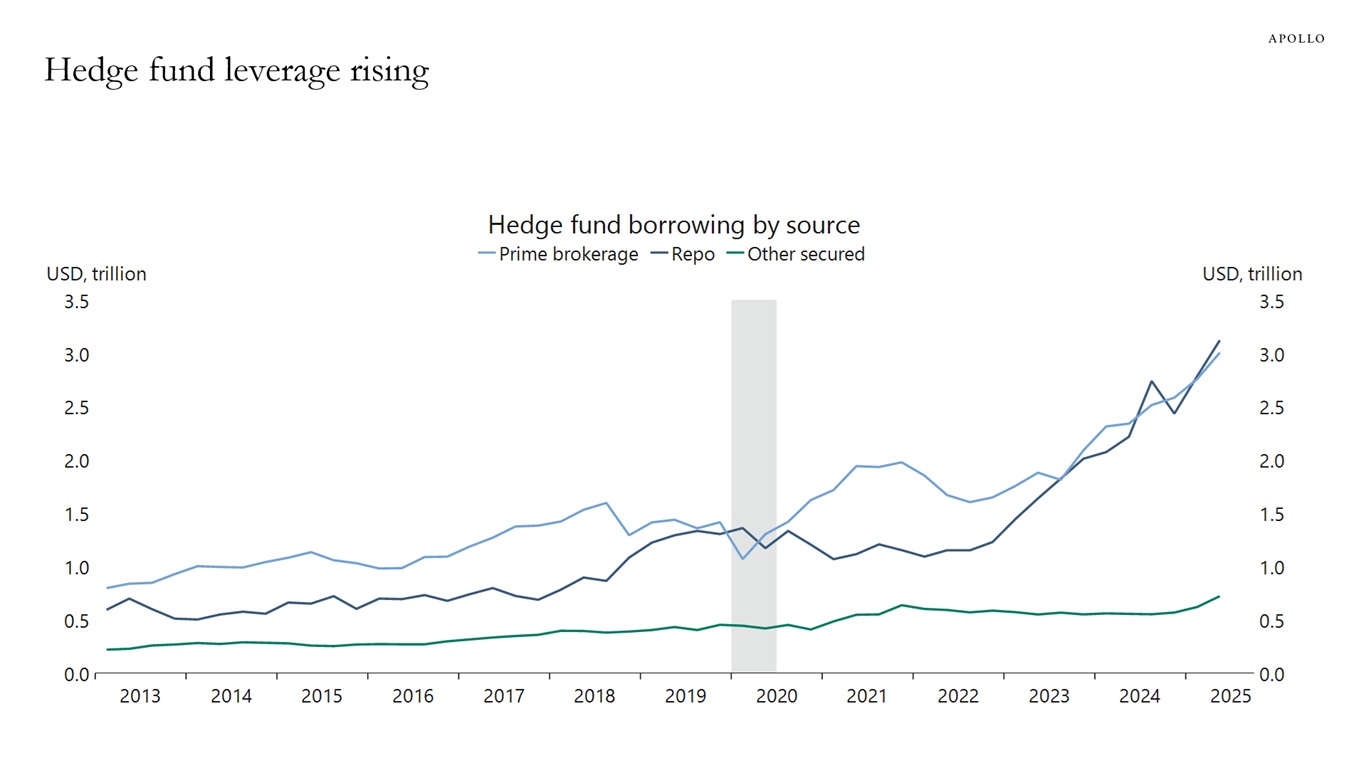
Sources: The Office of Financial Research (OFR), Macrobond, Apollo Chief Economist Register here to watch our 2026 Outlook class on Apollo Academy on Tuesday, December 16, 2025 at 11:00 AM ET — eligible for 1 CE credit. In addition to the macro outlook, you’ll also hear asset class perspectives from David Sambur (Private Equity), John Cortese (Credit), Olivia Wassenaar (Infrastructure) and Scott Weiner (Real Estate).
See important disclaimers at the bottom of the page.
-
Fewer than one in six US workers aged 45 to 54 contribute the maximum to their 401(k) accounts, see chart below. Coupled with rising costs, inadequate savings and the looming depletion of the Social Security trust fund, these factors underscore a retirement crisis in the US, requiring many households to boost their savings to achieve stable and sufficient income in retirement.
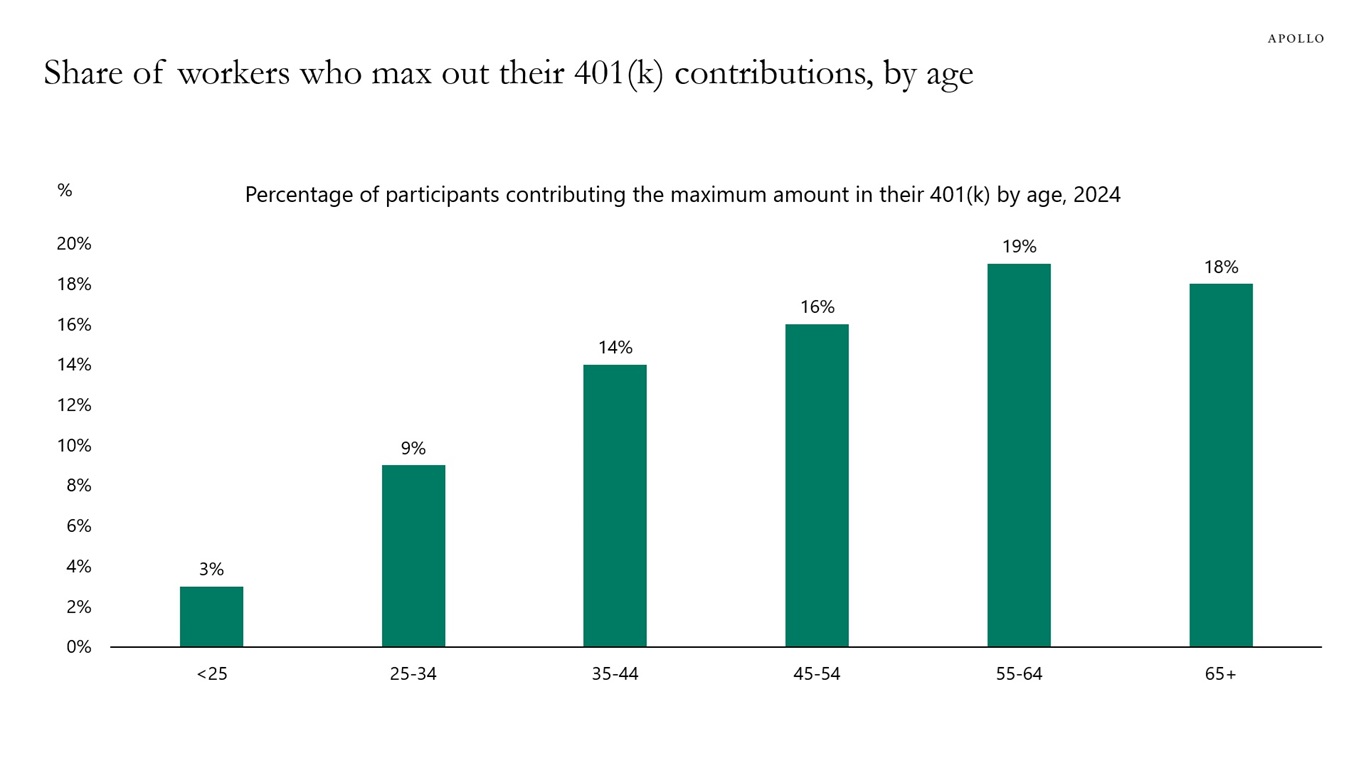
Sources: How America Saves 2025, Vanguard, Apollo Chief Economist Register here to watch our 2026 Outlook class on Apollo Academy on Tuesday, December 16, 2025 at 11:00 AM ET — eligible for 1 CE credit. In addition to the macro outlook, you’ll also hear asset class perspectives from David Sambur (Private Equity), John Cortese (Credit), Olivia Wassenaar (Infrastructure) and Scott Weiner (Real Estate).
See important disclaimers at the bottom of the page.
-
The historical relationship between the S&P 500 forward P/E ratio and subsequent 10-year annualized returns shows that investors should expect to get zero in return in the S&P 500 over the coming decade, see chart below.
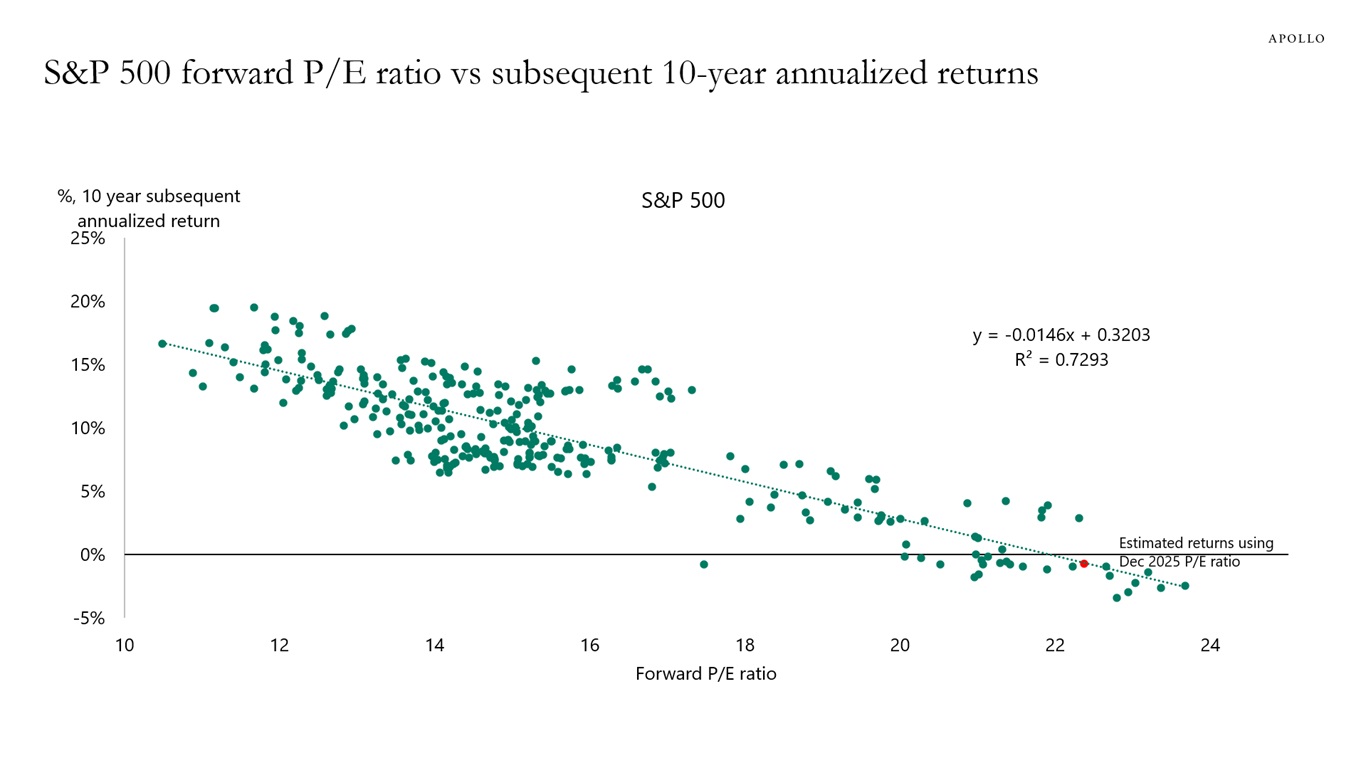
Sources: Bloomberg, Apollo Chief Economist Register here to watch our 2026 Outlook class on Apollo Academy on Tuesday, December 16, 2025 at 11:00 AM ET — eligible for 1 CE credit. In addition to the macro outlook, you’ll also hear asset class perspectives from David Sambur (Private Equity), John Cortese (Credit), Olivia Wassenaar (Infrastructure) and Scott Weiner (Real Estate).
See important disclaimers at the bottom of the page.
-
Why are long-term interest rates going up when the Fed is cutting rates, see the first chart? Is the market worried about growing Treasury issuance, or about a new Fed leadership effectively raising the inflation target from 2% to, say, 4%?
The reality is that about a year ago, long-term interest rates started drifting higher than what would have been predicted by short-term interest rates and oil prices, see the second and third charts.
This pattern of rising long-term interest rates is highly unusual when we look at the historical reaction during Fed cutting cycles, see the fourth chart.
The bottom line is that the yield curve continues to steepen, and investors across all asset classes need to think about why, see the fifth chart.
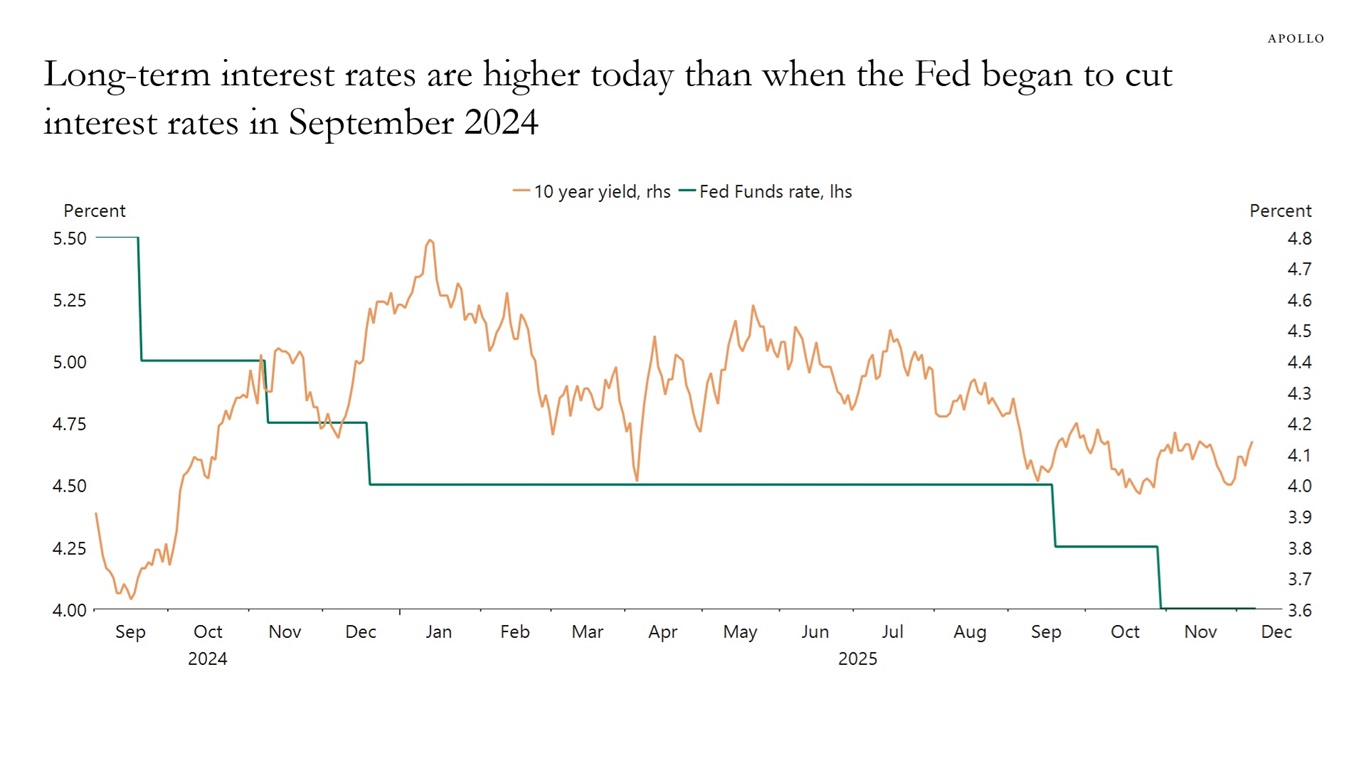
Sources: Federal Reserve, US Department of Treasury, Macrobond, Apollo Chief Economist 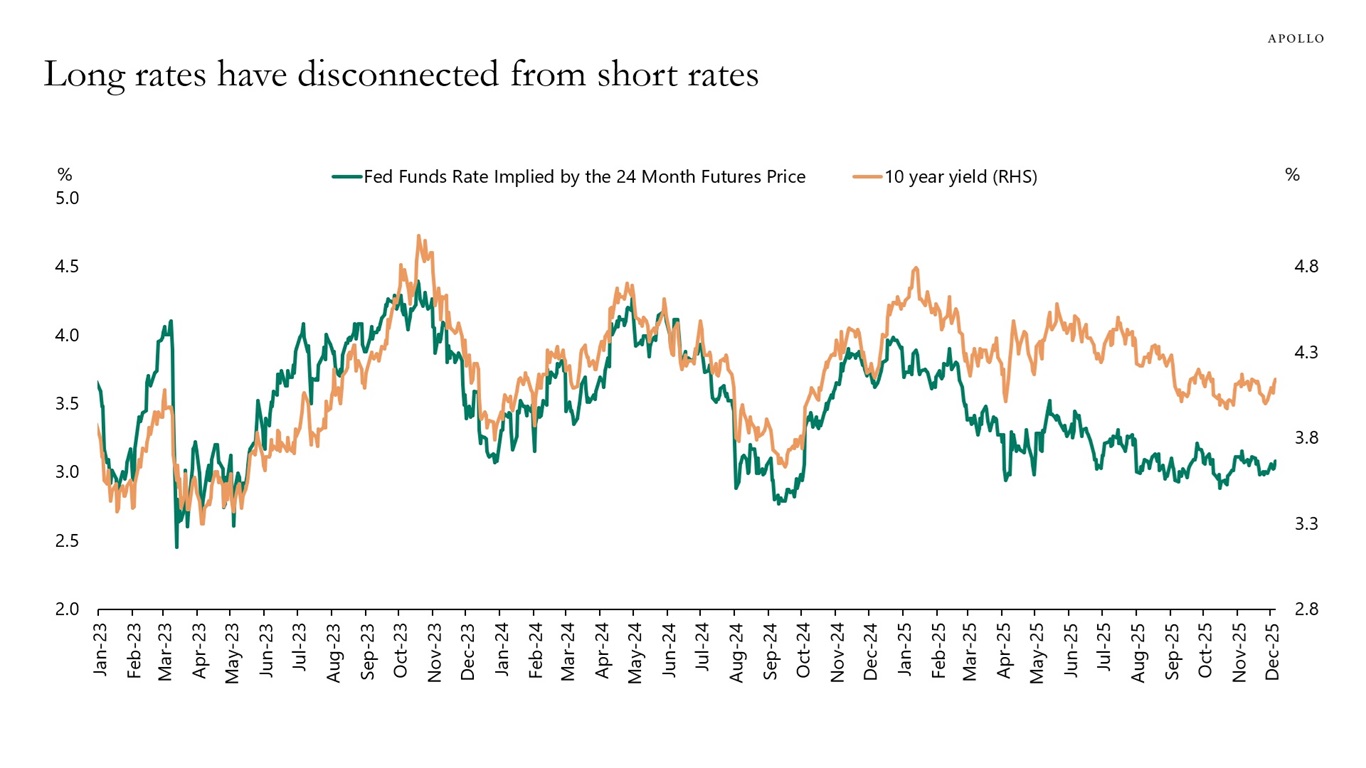
Sources: Haver Analytics, Apollo Chief Economist 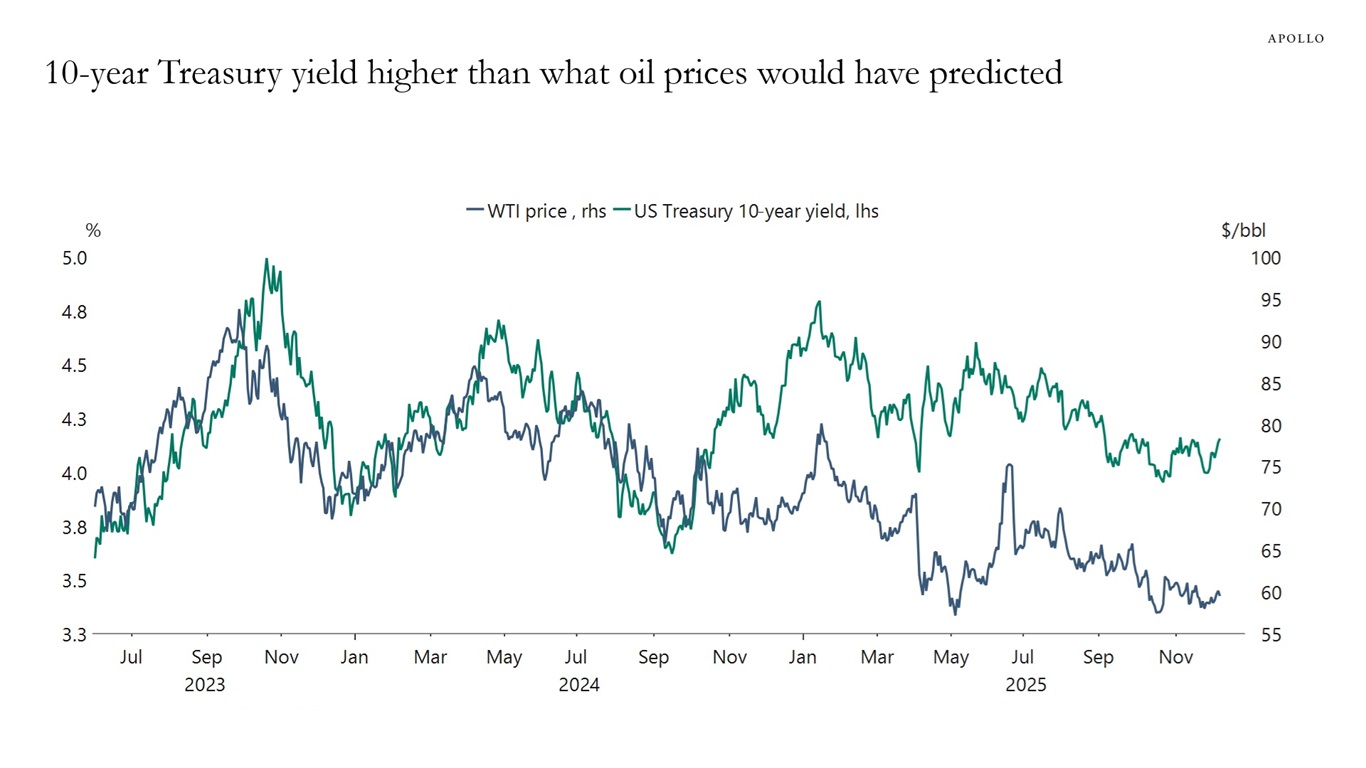
Sources: Bloomberg, Macrobond, Apollo Chief Economist 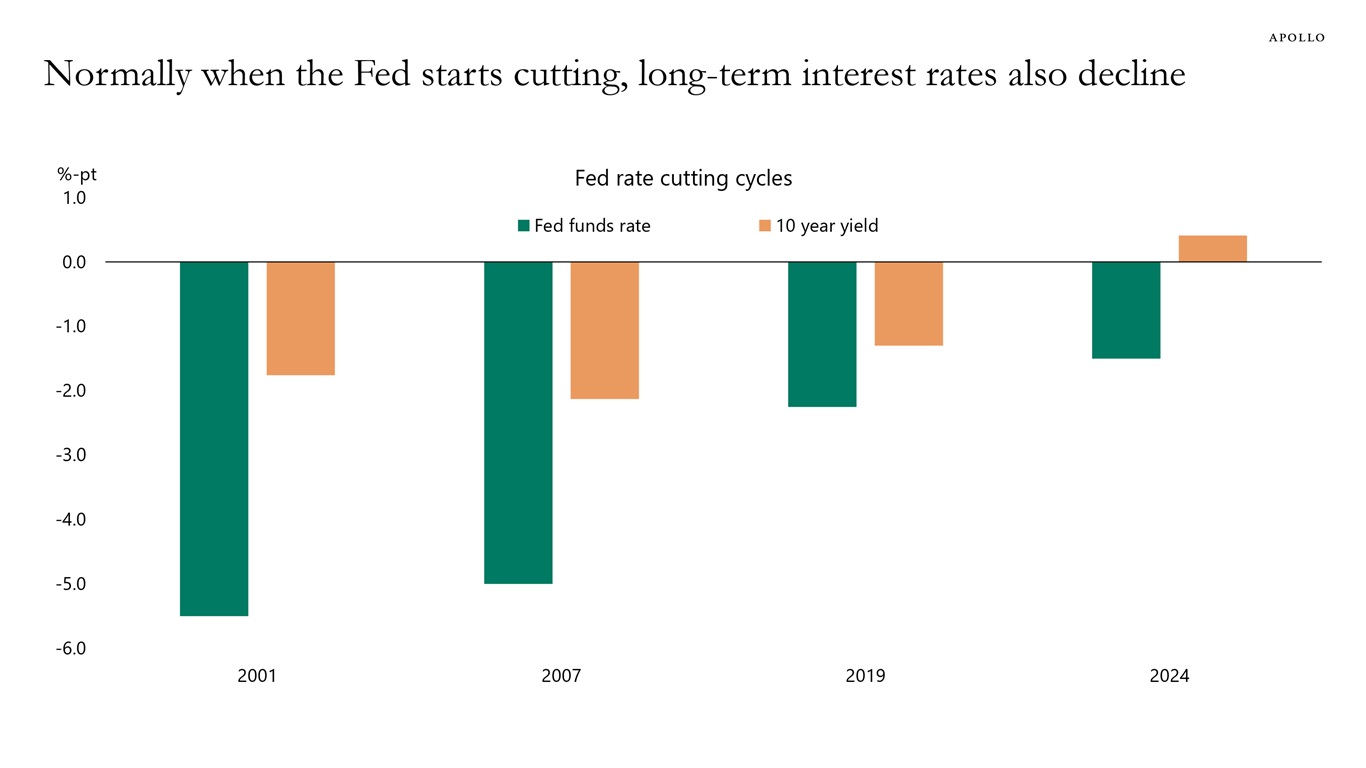
Note: 2001 is from Jan 2001 to June 2003, 2007 is from September 2007 to December 2008, 2019 is from August 2019 to March 2020 and 2024 is from September 2024 to December 2025. Sources: Haver Analytics, Apollo Chief Economist 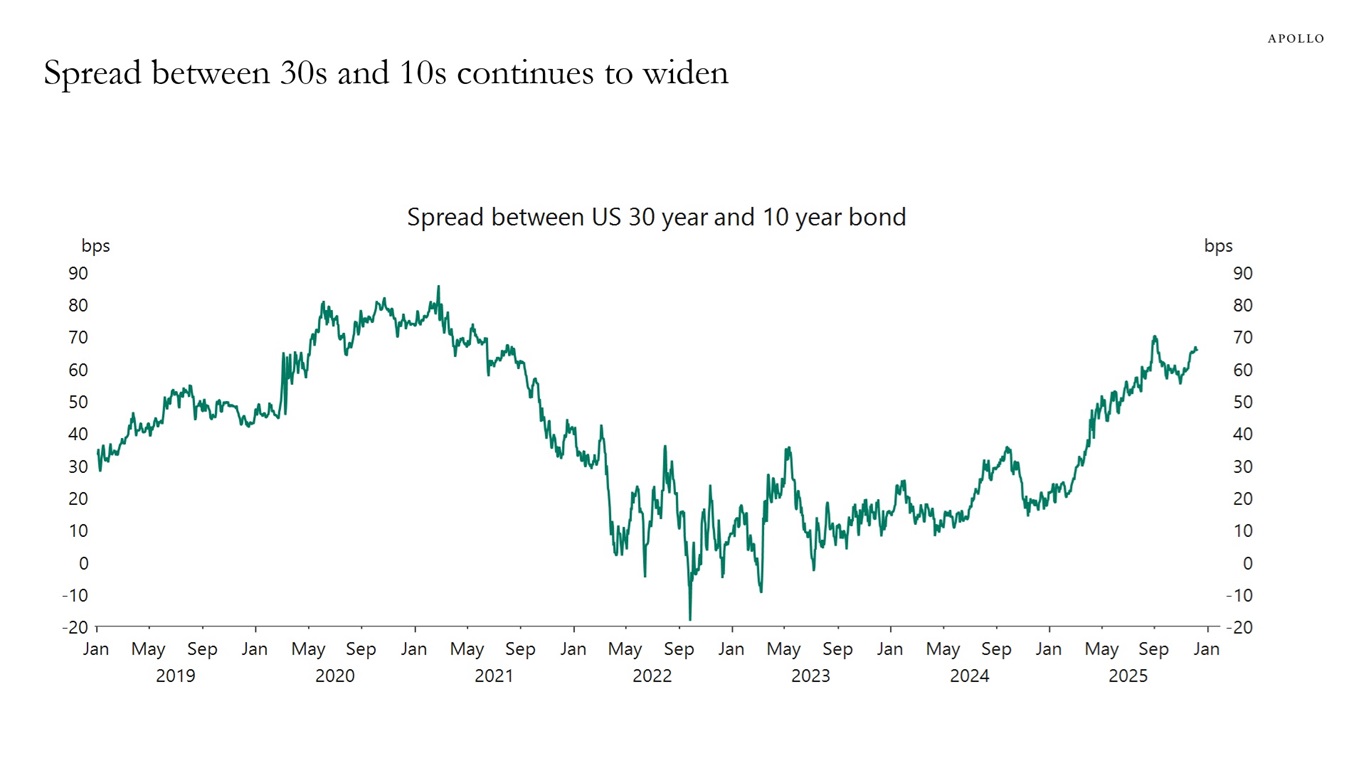
Sources: Bloomberg, Macrobond, Apollo Chief Economist See important disclaimers at the bottom of the page.
-
After the Fed started raising interest rates in 2022, more deals over $1 billion have moved from IPOs to private markets, see chart below.
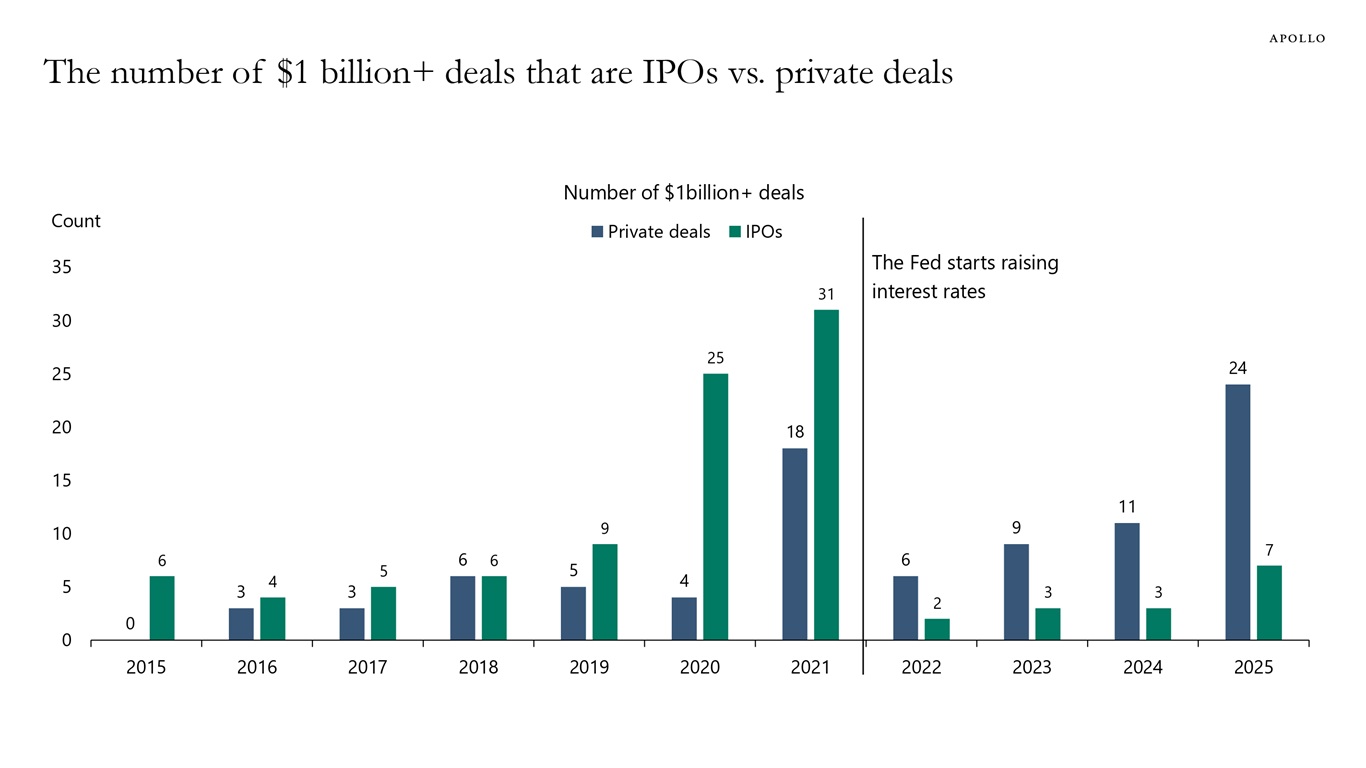
Note: Data as of December 8th, 2025. Sources: PitchBook, Apollo Chief Economist See important disclaimers at the bottom of the page.
-
Forty percent of companies in the Russell 2000 Index have no earnings, see chart below.
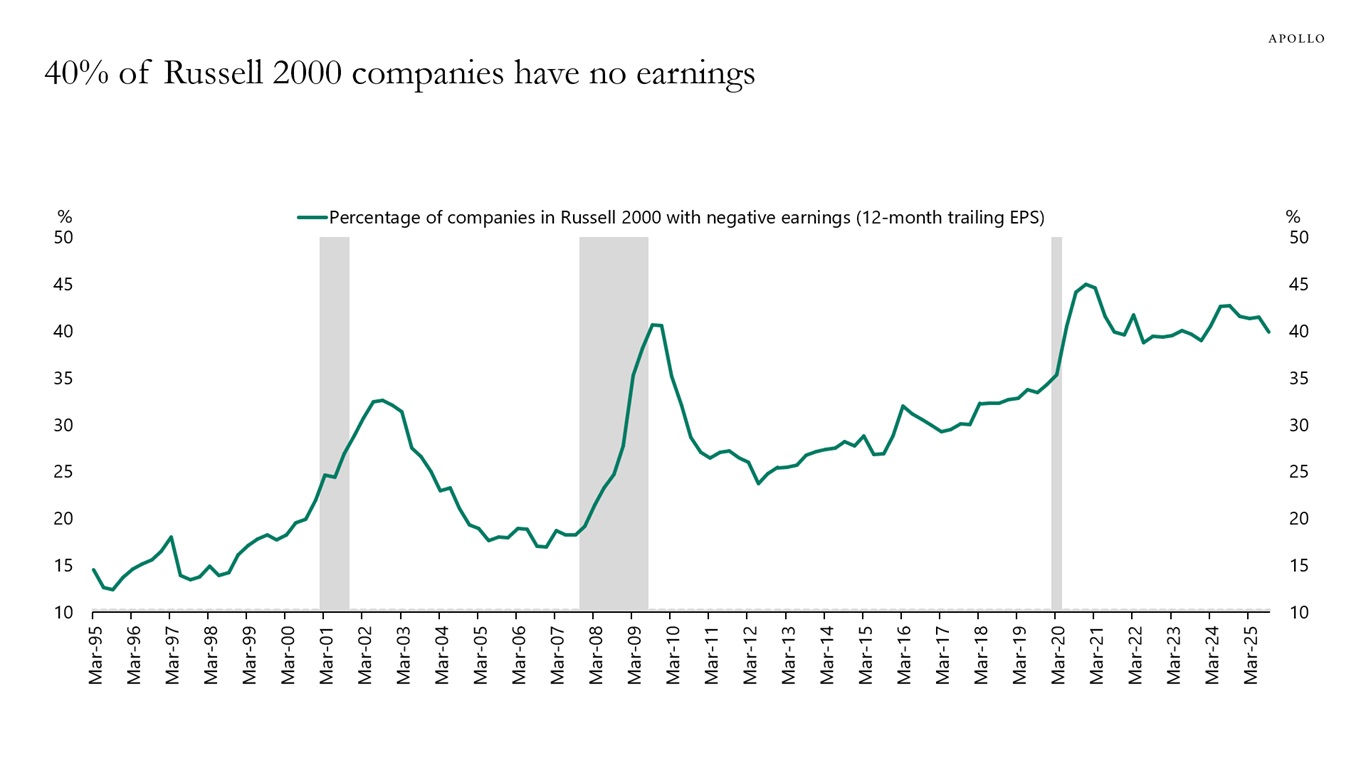
Sources: Bloomberg, Apollo Chief Economist See important disclaimers at the bottom of the page.
-
A record-high share of total wealth in the household sector is owned by people that are more than 70 years old, see chart below.
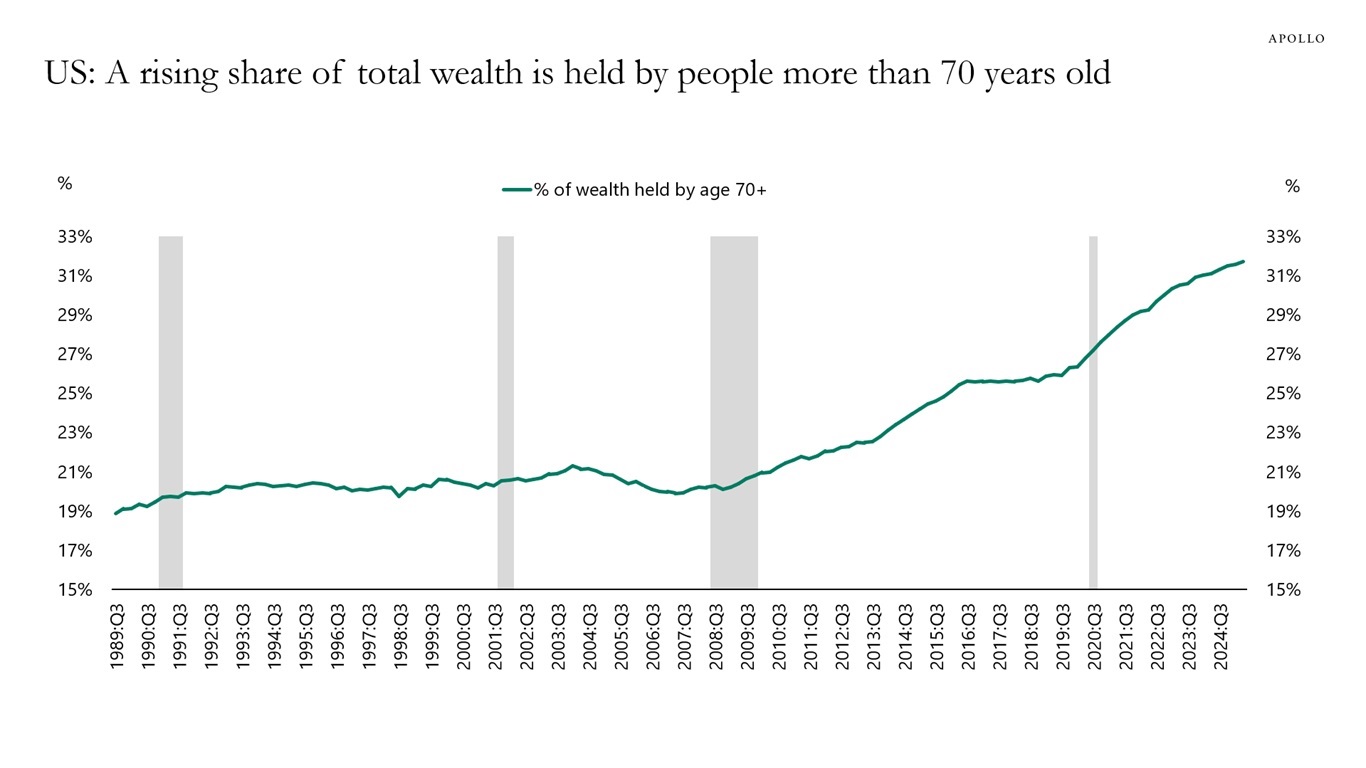
Sources: Federal Reserve, Apollo Chief Economist See important disclaimers at the bottom of the page.

This presentation may not be distributed, transmitted or otherwise communicated to others in whole or in part without the express consent of Apollo Global Management, Inc. (together with its subsidiaries, “Apollo”).
Apollo makes no representation or warranty, expressed or implied, with respect to the accuracy, reasonableness, or completeness of any of the statements made during this presentation, including, but not limited to, statements obtained from third parties. Opinions, estimates and projections constitute the current judgment of the speaker as of the date indicated. They do not necessarily reflect the views and opinions of Apollo and are subject to change at any time without notice. Apollo does not have any responsibility to update this presentation to account for such changes. There can be no assurance that any trends discussed during this presentation will continue.
Statements made throughout this presentation are not intended to provide, and should not be relied upon for, accounting, legal or tax advice and do not constitute an investment recommendation or investment advice. Investors should make an independent investigation of the information discussed during this presentation, including consulting their tax, legal, accounting or other advisors about such information. Apollo does not act for you and is not responsible for providing you with the protections afforded to its clients. This presentation does not constitute an offer to sell, or the solicitation of an offer to buy, any security, product or service, including interest in any investment product or fund or account managed or advised by Apollo.
Certain statements made throughout this presentation may be “forward-looking” in nature. Due to various risks and uncertainties, actual events or results may differ materially from those reflected or contemplated in such forward-looking information. As such, undue reliance should not be placed on such statements. Forward-looking statements may be identified by the use of terminology including, but not limited to, “may”, “will”, “should”, “expect”, “anticipate”, “target”, “project”, “estimate”, “intend”, “continue” or “believe” or the negatives thereof or other variations thereon or comparable terminology.