


The Daily Spark is moving to Apollo.com— read the latest from Torsten Slok here.
Want it delivered daily to your inbox?
-
We have updated our chart book with daily and weekly indicators, and the latest data shows that:
1. There is a capex boom underway, and corporate capex plans are moving higher driven by the One Big Beautiful Bill.
2. Daily data for job postings are rising.
3. Withheld income taxes are at higher levels than normal in January.
4. Weekly data for Broadway show attendance is also at higher levels than normally seen in January.
5. Weekly data for Redbook same-store retail sales continue to show solid growth in consumer spending.
The bottom line is that the US economy continues to perform well.
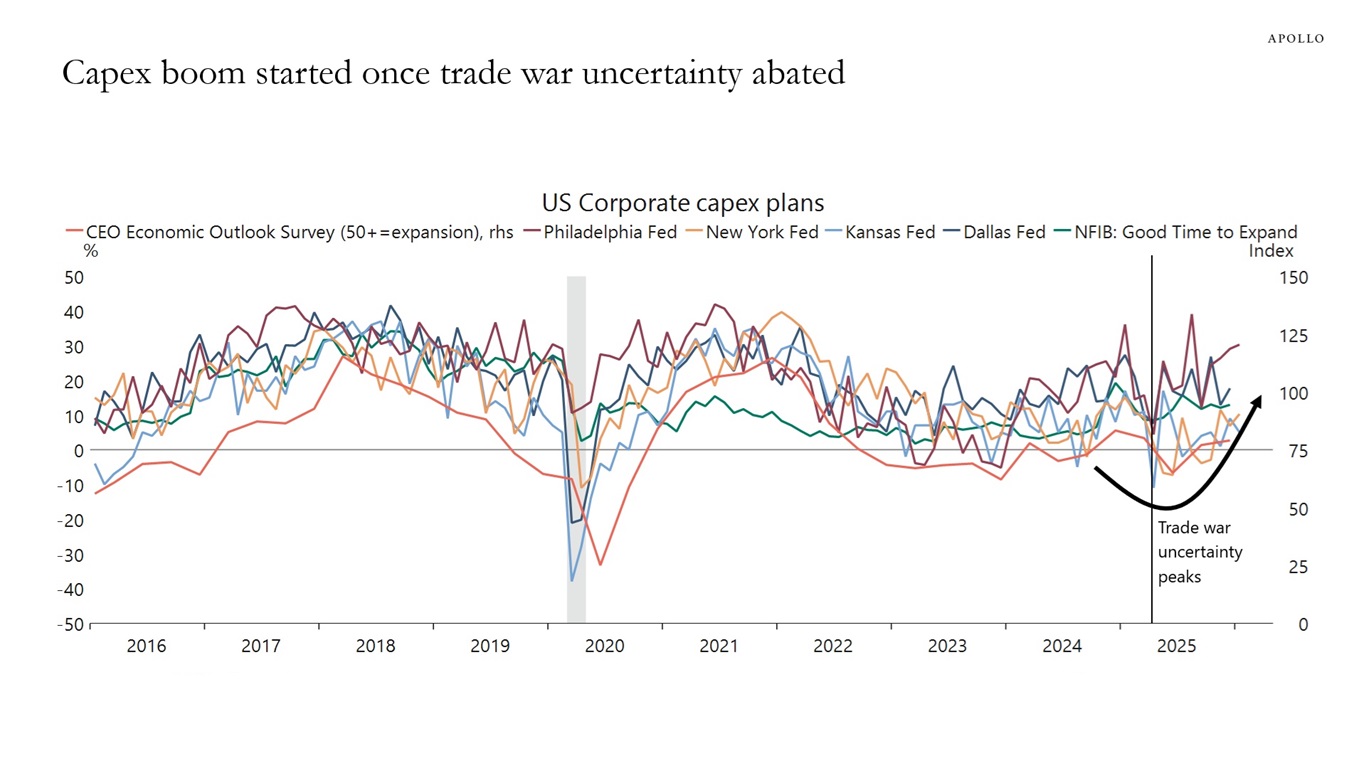
Sources: National Federation of Independent Business, Federal Reserve Bank of Dallas, Federal Reserve Bank of Kansas City, Federal Reserve Bank of New York, Federal Reserve Bank of Philadelphia, Business Roundtable,
Macrobond, Apollo Chief Economist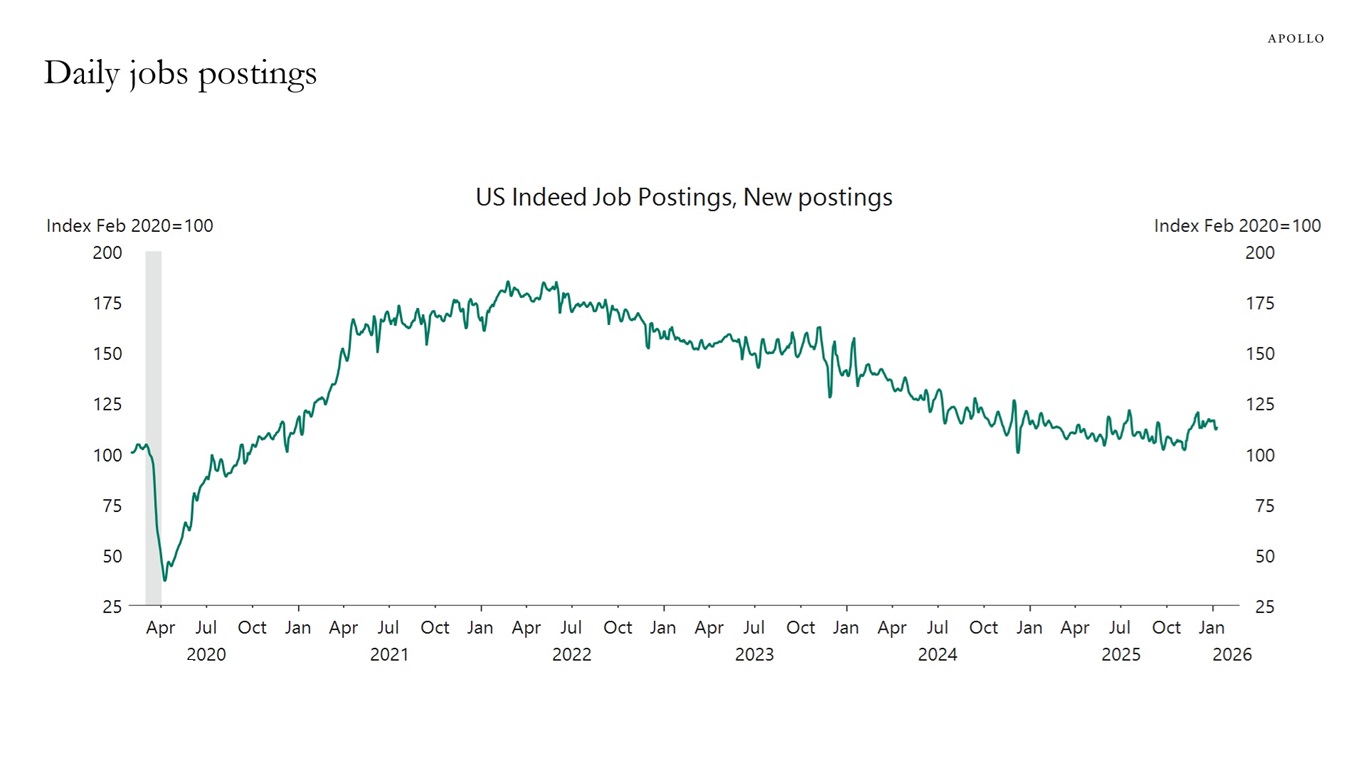
Sources: Indeed, Bloomberg, Macrobond, Apollo Chief Economist 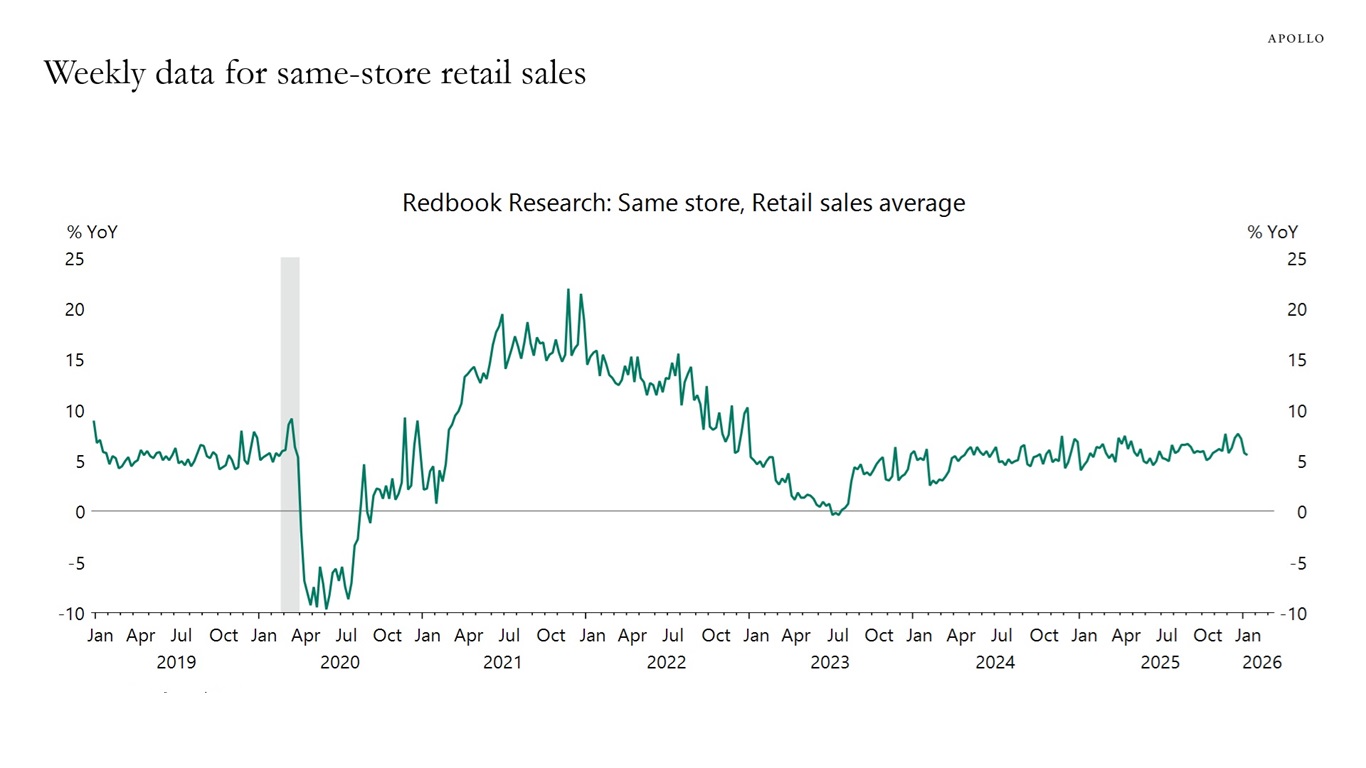
Sources: Redbook Research Inc., Macrobond, Apollo Chief Economist See important disclaimers at the bottom of the page.
-
Operating margin measures the share of revenue left after covering operating expenses such as wages, materials and overhead. The chart below shows that over the past 20 years, all of the increase in the S&P 500’s operating margin has come from tech‑related sectors, while operating margins for non‑tech companies have stayed near 9%.
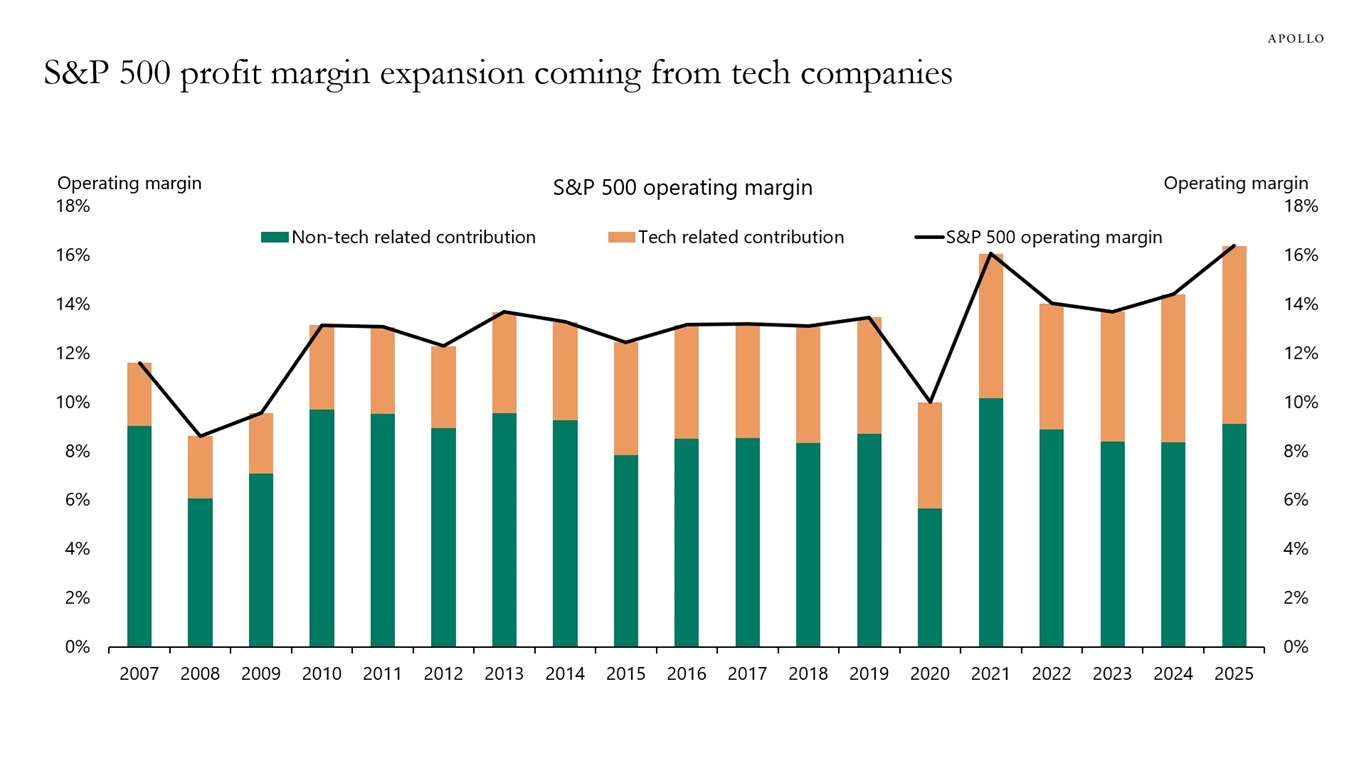
Note: Tech related includes communication services, consumer discretionary and information technology. Sources: Bloomberg, Apollo Chief Economist See important disclaimers at the bottom of the page.
-
AI has become one of the key themes underpinning current M&A activity, with AI‑related transactions representing a meaningful share of megadeals, see chart below.
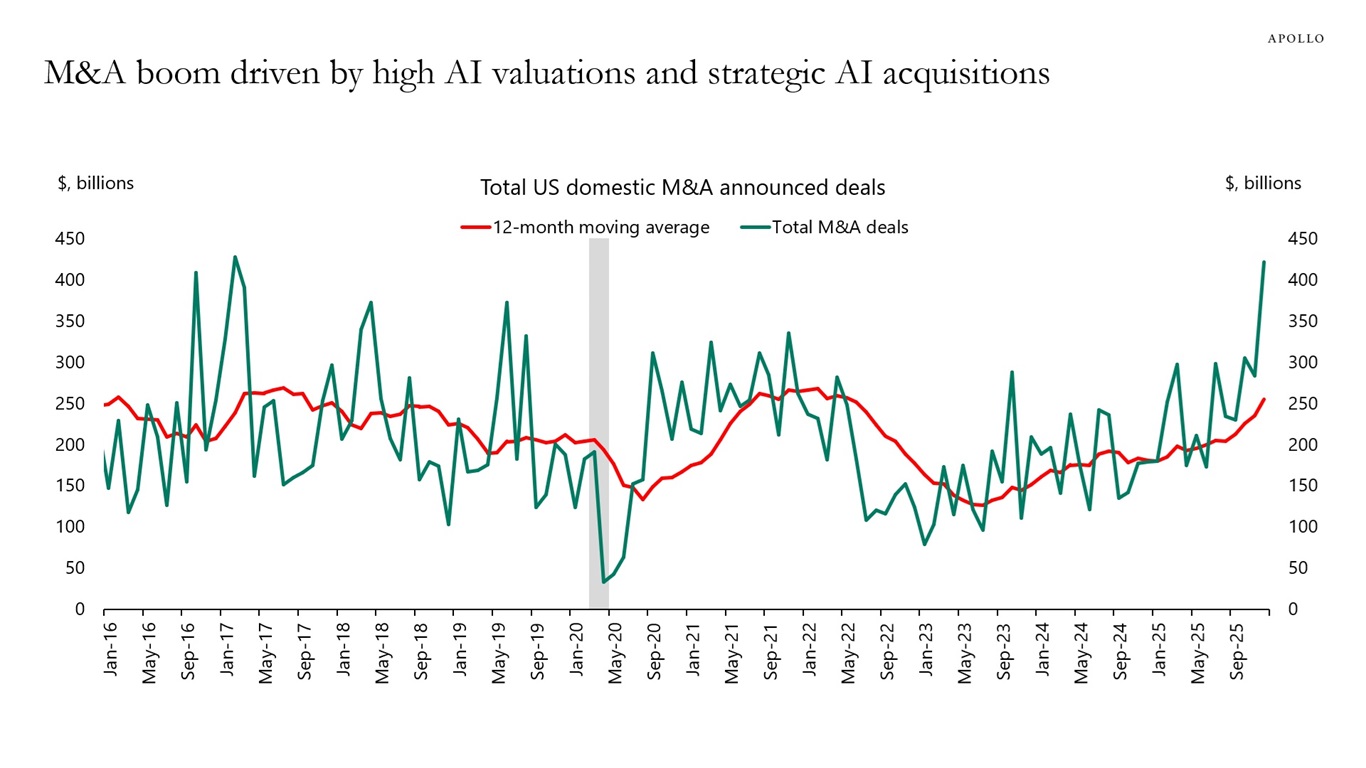
Note: Data through December 2025. Sources: Bloomberg, Apollo Chief Economist See important disclaimers at the bottom of the page.
-
For many years, the investment grade credit index has been dominated by banks. But that is changing as hyperscalers take on more debt and become a larger share of the index, see chart below.
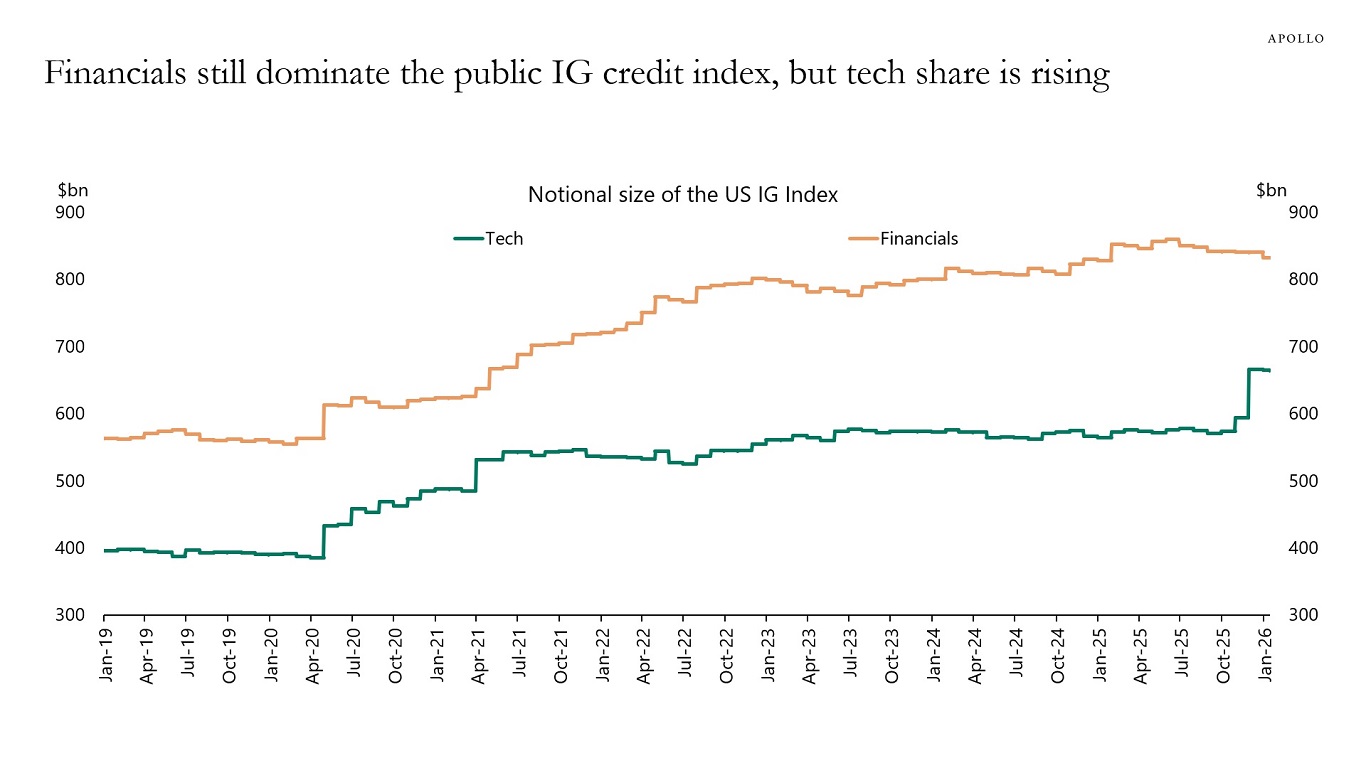
Note: Tech includes hyperscaler and telecom/cable companies. Financials include six big banks. Sources: ICE BofA Indices, Apollo Chief Economist See important disclaimers at the bottom of the page.
-
The proportion of US households composed of a single individual continues to rise, see chart below.
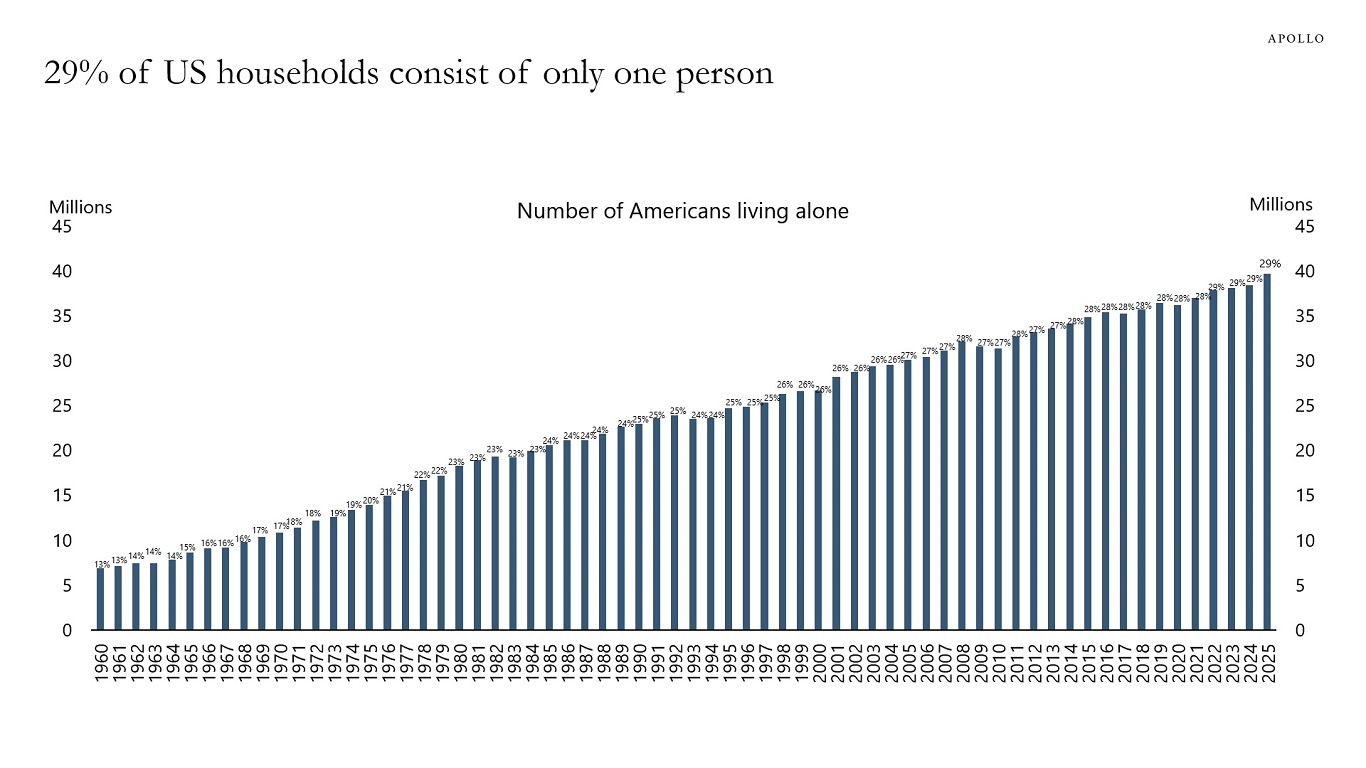
Sources: US Census Bureau, Apollo Chief Economist See important disclaimers at the bottom of the page.
-
Investment grade credit spreads are widening for hyperscalers and tightening for industrials, see chart below.
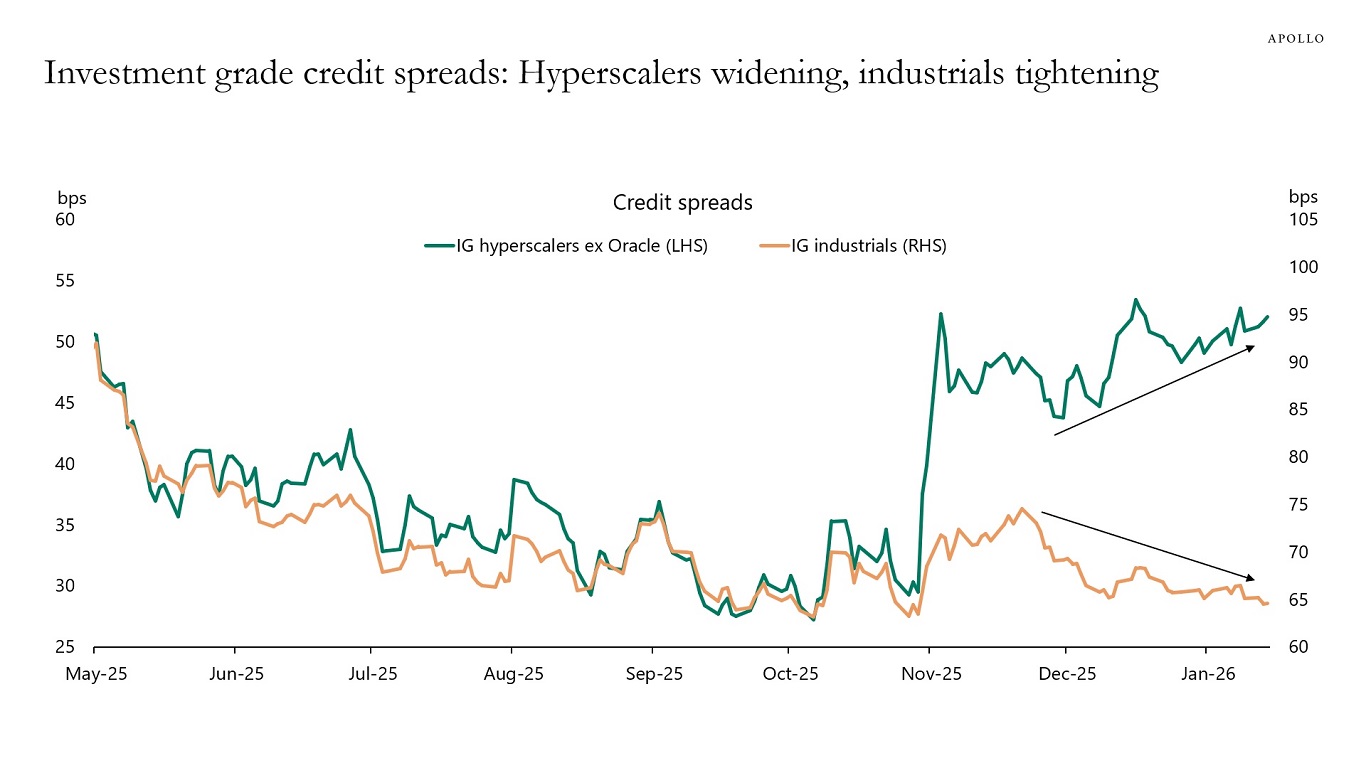
Note: 7 to 11 year maturity. Sources: ICE BofA Indices, Apollo Chief Economist See important disclaimers at the bottom of the page.
-
Stock prices of companies with negative earnings continue to outperform stock prices of companies with positive earnings, see chart below.
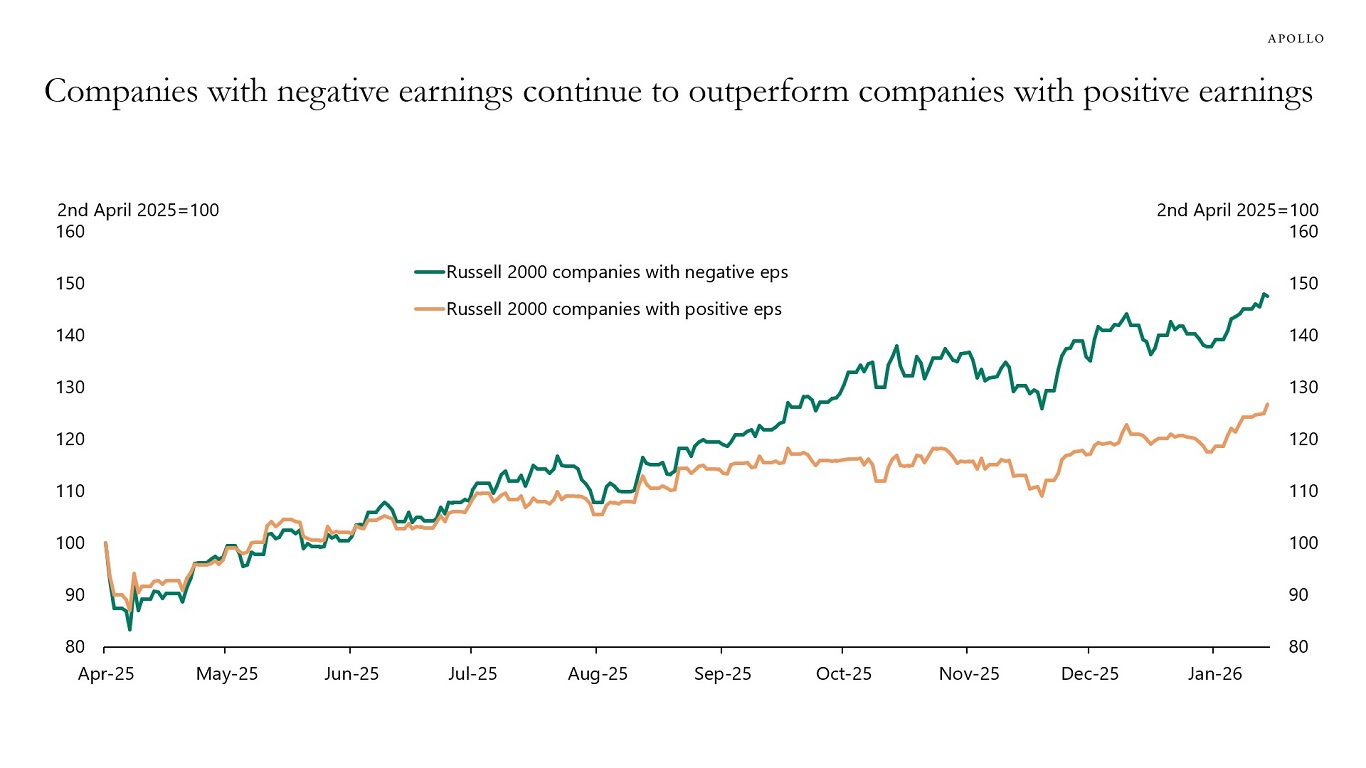
Note: Using Russell 2000 companies as of 2025 with trailing EPS, 1,120 companies have positive EPS, and 806 companies have negative EPS. Sources: Bloomberg, Apollo Chief Economist See important disclaimers at the bottom of the page.
-
Data from the Fed shows that lower-income households are experiencing higher inflation because their consumer spending baskets place greater weight on categories like rent, electricity, food, transportation and other necessities whose prices have risen faster.
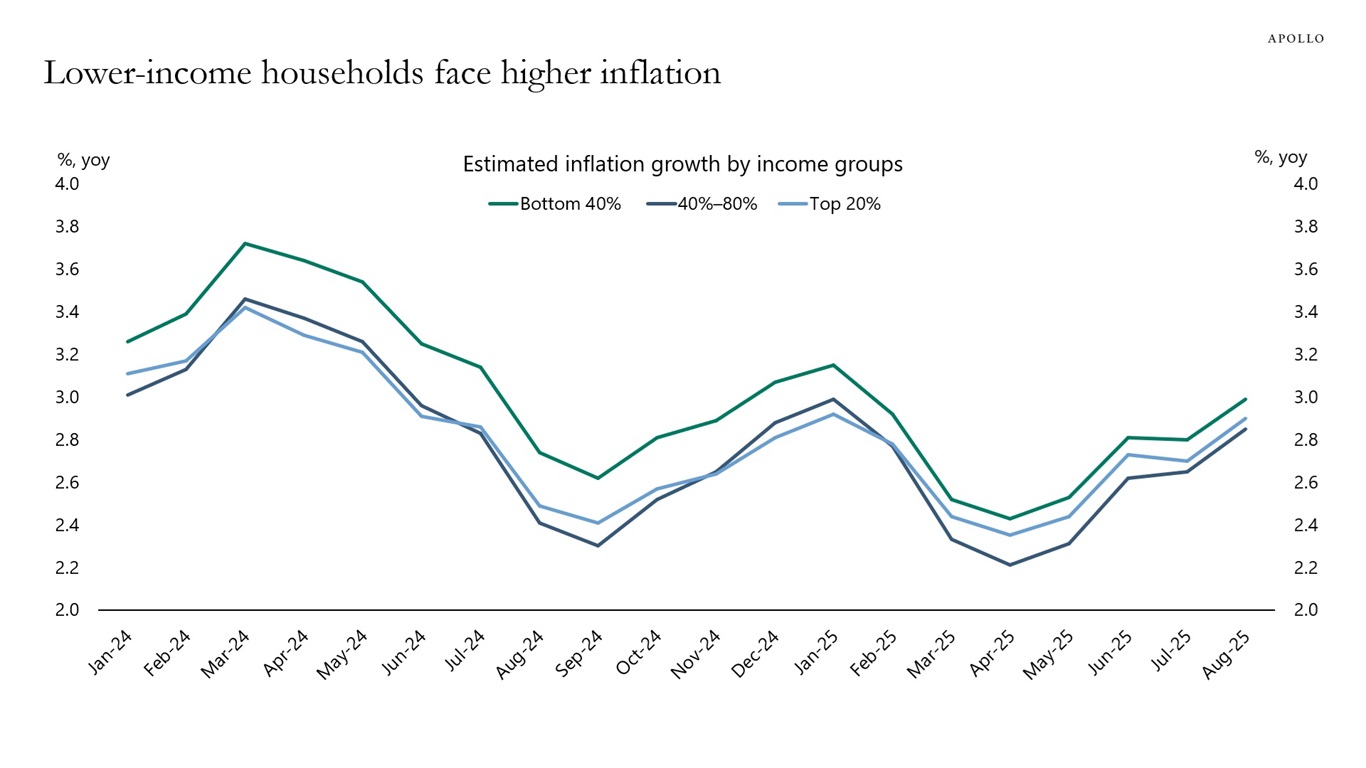
Note: Inflation by income group is estimated by anchoring relative inflation differentials to US headline CPI (YoY). Monthly inflation gaps by income cohort are added to headline CPI inflation to recover implied inflation levels for the bottom 40%, middle 40%, and top 20% of households. Relative differences across income groups are preserved. Sources: Federal Reserve Bank of New York, Apollo Chief Economist See important disclaimers at the bottom of the page.
-
US oil production has increased dramatically over the past 15 years (see the first chart), and most of the rise is used for exports (see the second chart).
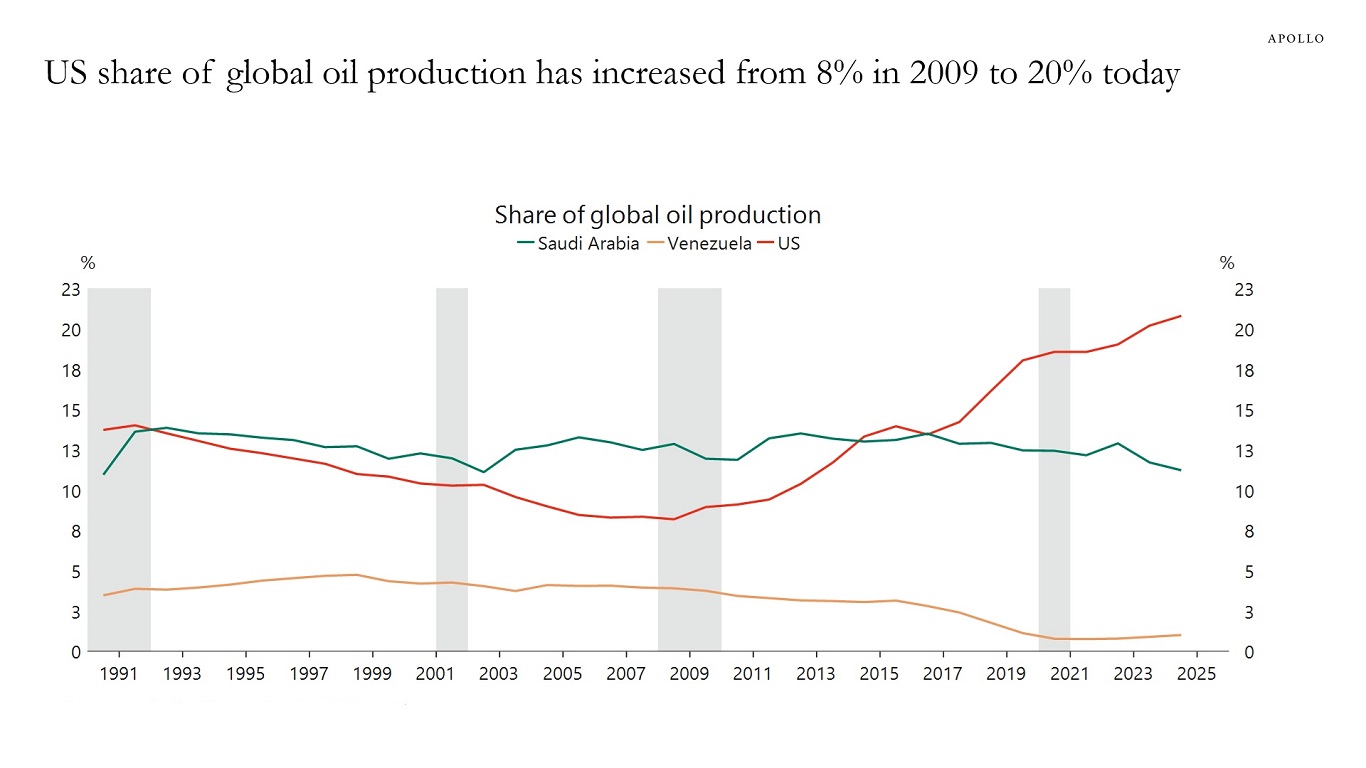
Sources: Energy Institute, Macrobond, Apollo Chief Economist 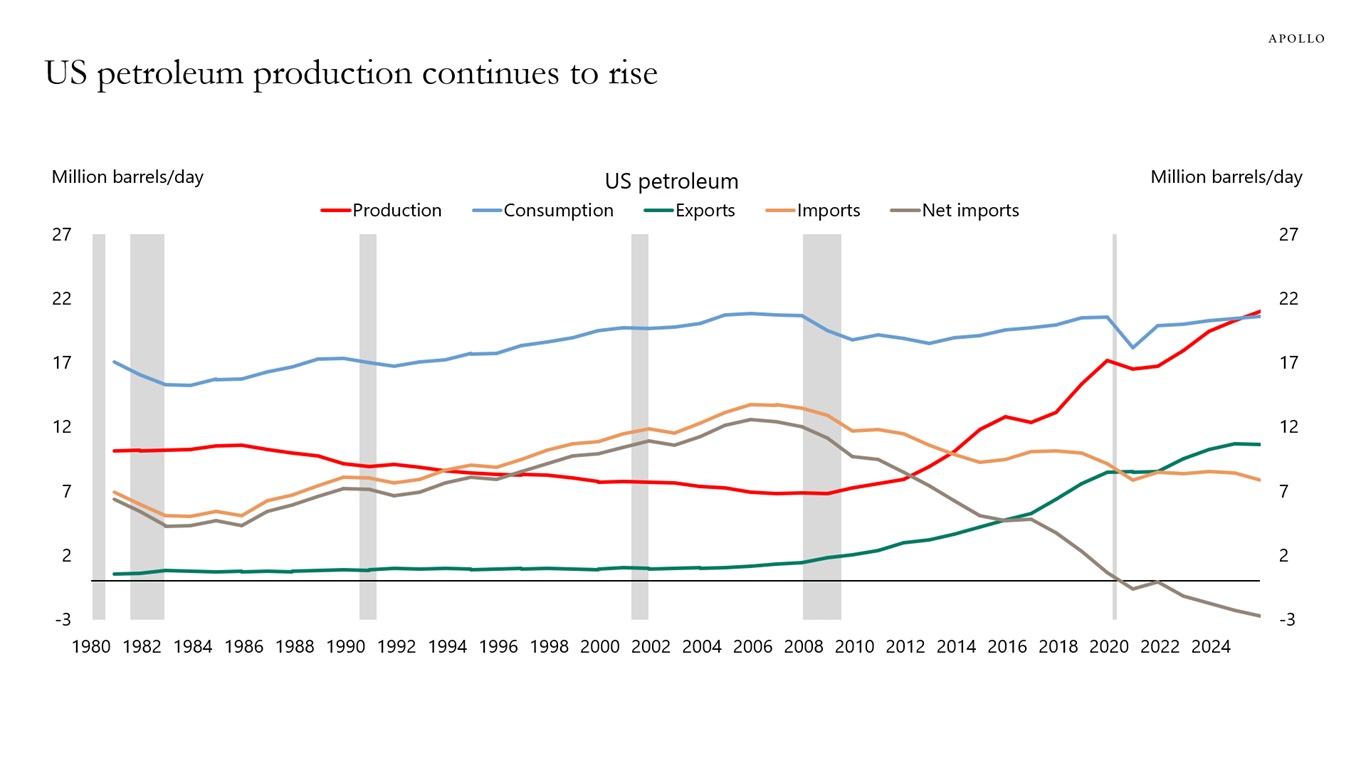
Note: 2025 data are averages through November 2025. Sources: EIA, Apollo Chief Economist See important disclaimers at the bottom of the page.
-
The probability of a recession in 2026 continues to decline, see the first chart, and the consensus continues to revise up the growth forecast for the year, see the second chart.
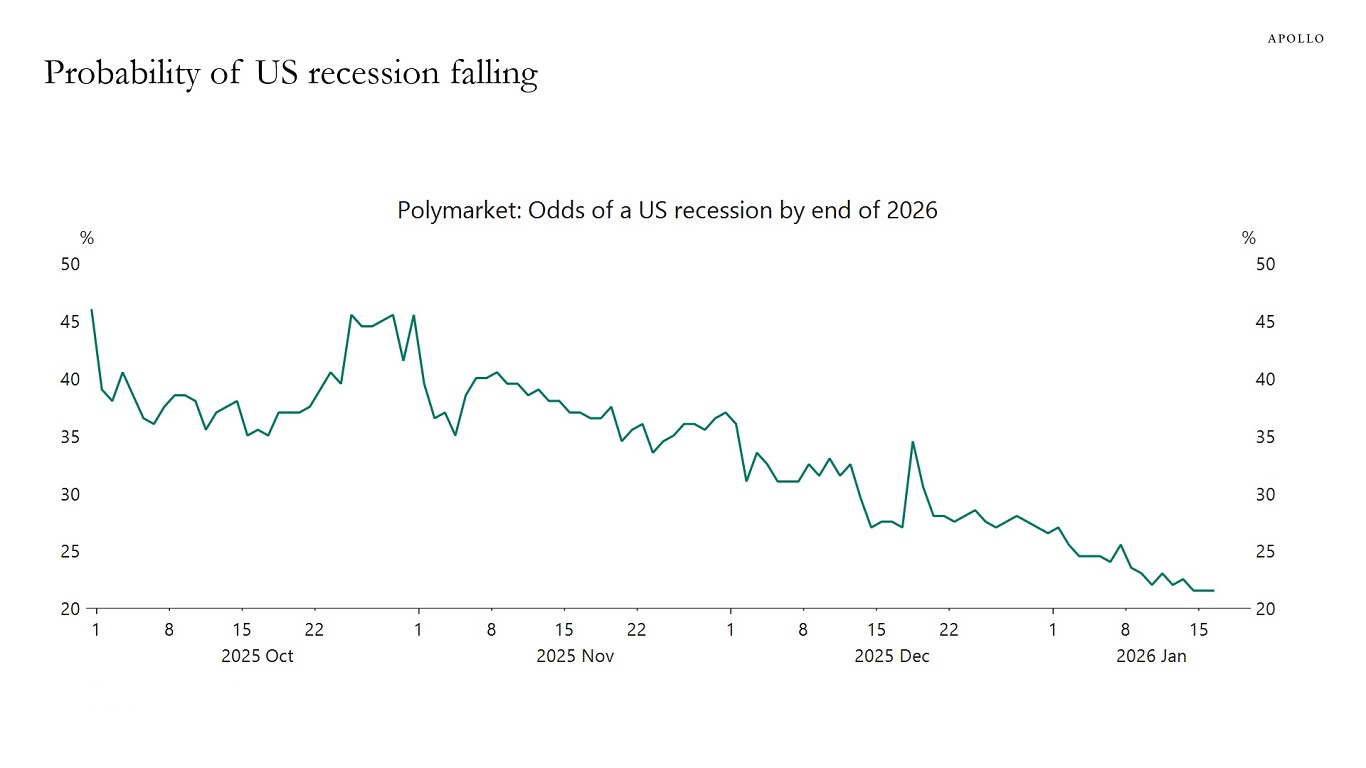
Sources: Polymarket, Macrobond, Apollo Chief Economist 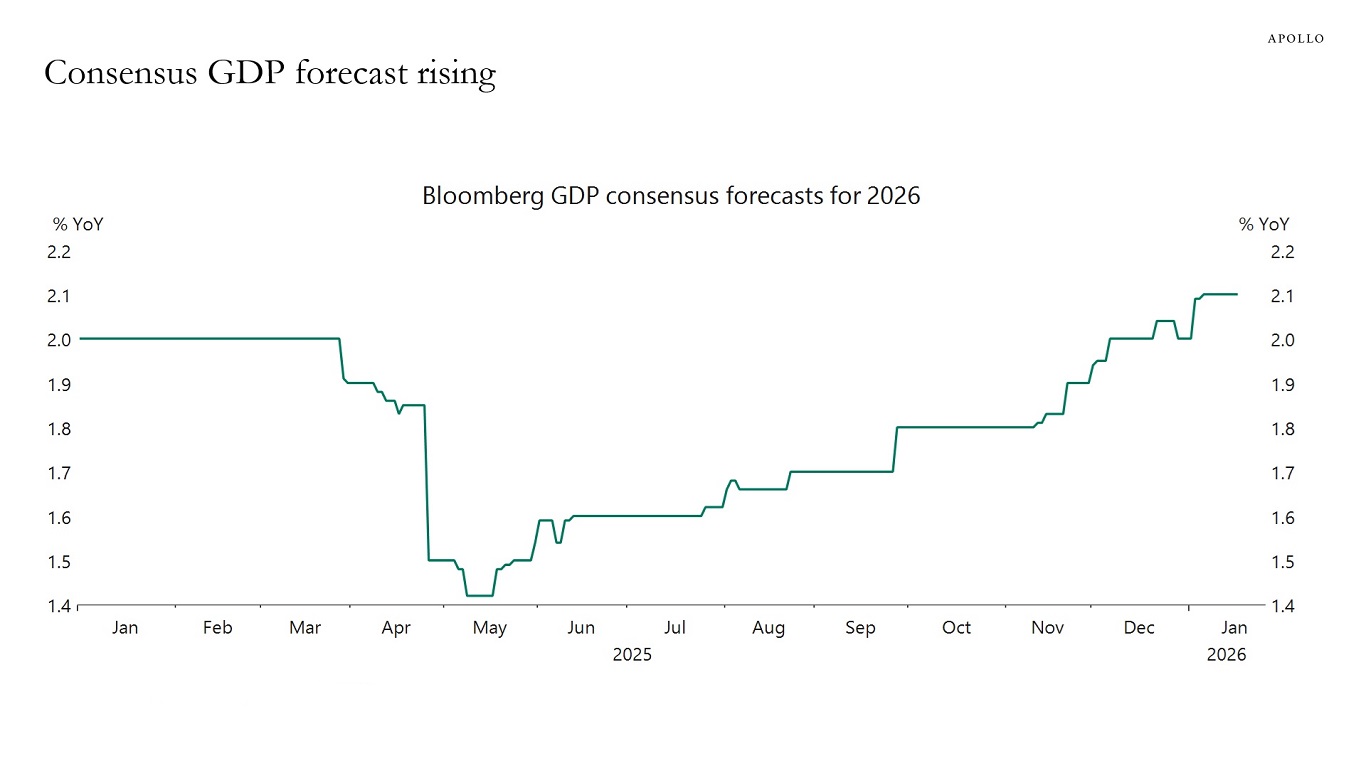
Sources: Bloomberg, Macrobond, Apollo Chief Economist See important disclaimers at the bottom of the page.

This presentation may not be distributed, transmitted or otherwise communicated to others in whole or in part without the express consent of Apollo Global Management, Inc. (together with its subsidiaries, “Apollo”).
Apollo makes no representation or warranty, expressed or implied, with respect to the accuracy, reasonableness, or completeness of any of the statements made during this presentation, including, but not limited to, statements obtained from third parties. Opinions, estimates and projections constitute the current judgment of the speaker as of the date indicated. They do not necessarily reflect the views and opinions of Apollo and are subject to change at any time without notice. Apollo does not have any responsibility to update this presentation to account for such changes. There can be no assurance that any trends discussed during this presentation will continue.
Statements made throughout this presentation are not intended to provide, and should not be relied upon for, accounting, legal or tax advice and do not constitute an investment recommendation or investment advice. Investors should make an independent investigation of the information discussed during this presentation, including consulting their tax, legal, accounting or other advisors about such information. Apollo does not act for you and is not responsible for providing you with the protections afforded to its clients. This presentation does not constitute an offer to sell, or the solicitation of an offer to buy, any security, product or service, including interest in any investment product or fund or account managed or advised by Apollo.
Certain statements made throughout this presentation may be “forward-looking” in nature. Due to various risks and uncertainties, actual events or results may differ materially from those reflected or contemplated in such forward-looking information. As such, undue reliance should not be placed on such statements. Forward-looking statements may be identified by the use of terminology including, but not limited to, “may”, “will”, “should”, “expect”, “anticipate”, “target”, “project”, “estimate”, “intend”, “continue” or “believe” or the negatives thereof or other variations thereon or comparable terminology.