


The Daily Spark is moving to Apollo.com— read the latest from Torsten Slok here.
Want it delivered daily to your inbox?
-
Ninety-one percent of US investment grade bonds are trading below par, see chart below.

Source: Bloomberg, Apollo Chief Economist. Note: Data used for members in the LBUSTRUU Index. See important disclaimers at the bottom of the page.
-
Modified duration measures the expected change in a bond’s price to a 1% change in interest rates. The charts below show that since the Fed started raising rates, index duration has declined both for high yield and investment grade, with high yield duration currently standing at 4% and investment grade duration at 7.5%.
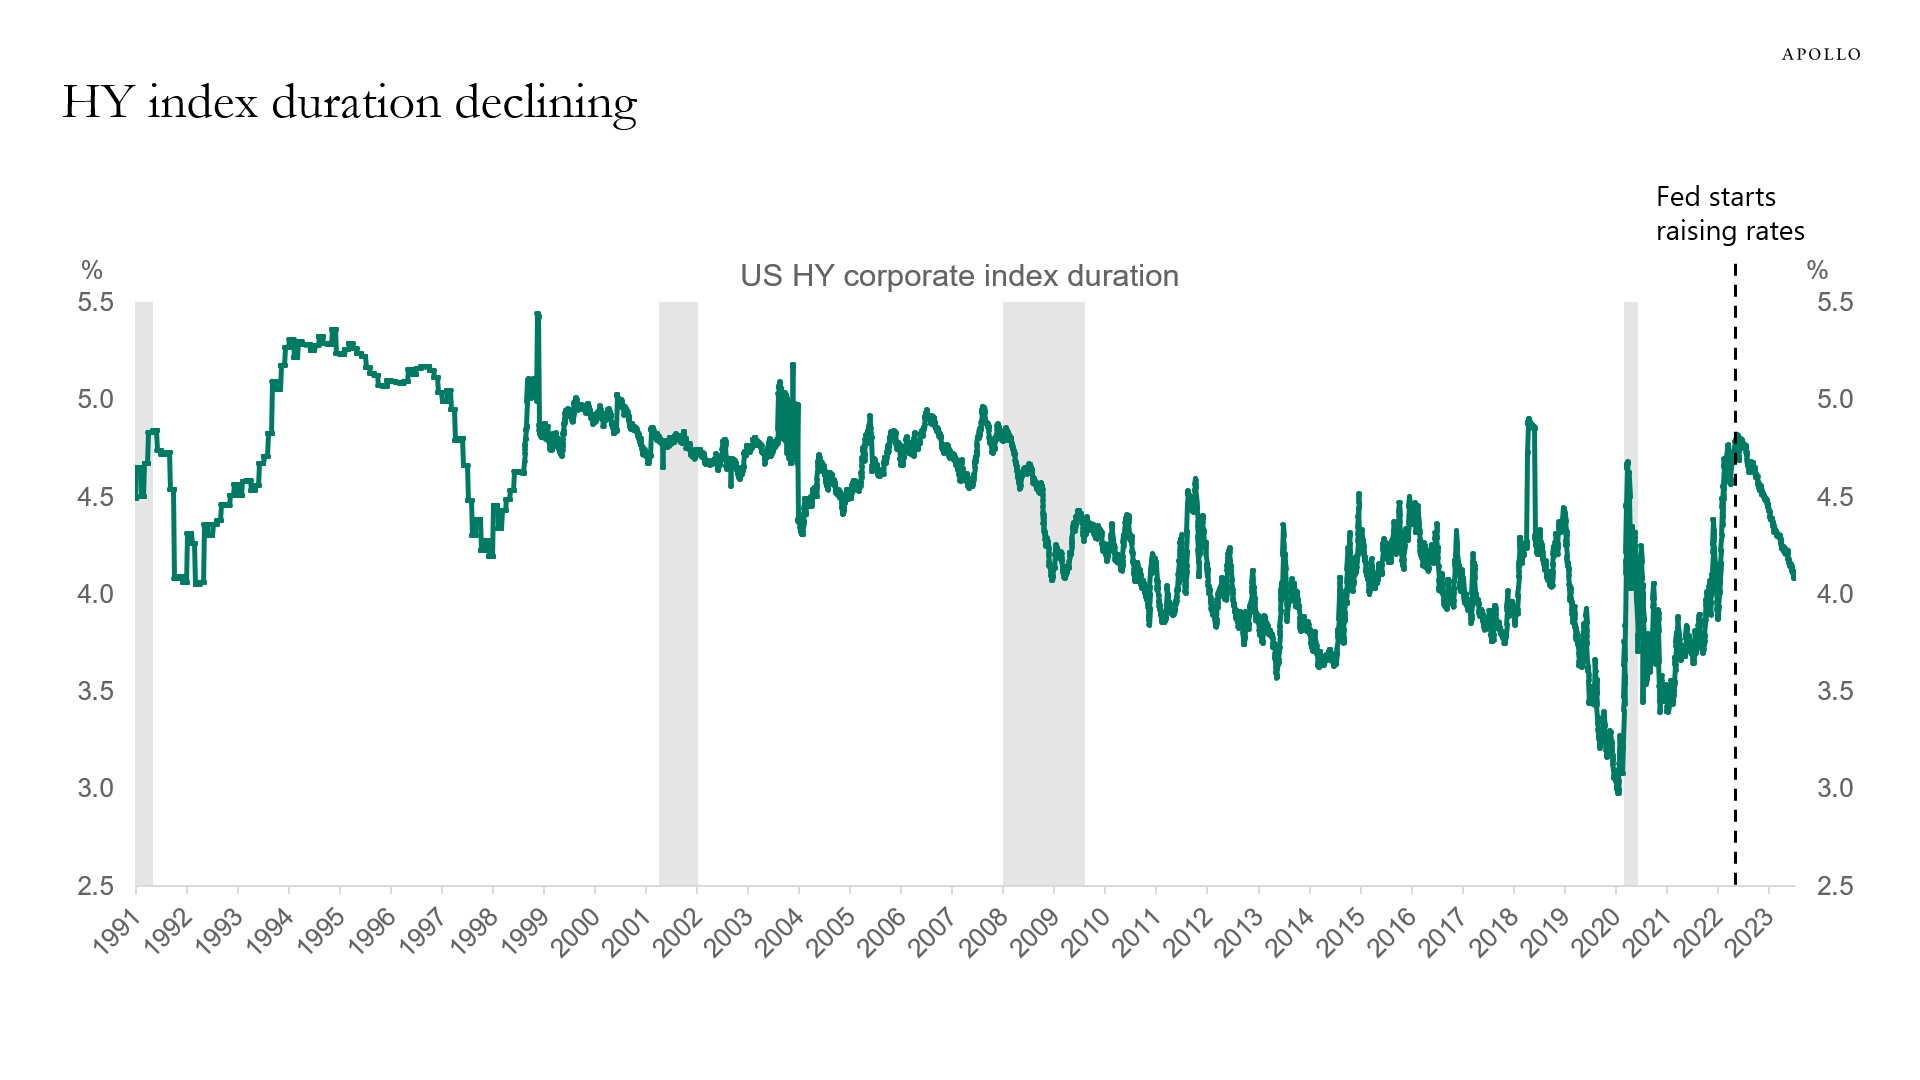
Source: Bloomberg, Apollo Chief Economist. Note: The measure used is modified duration, which measures the expected change in a bond’s price to a 1% change in interest rates. 
Source: Bloomberg, Apollo Chief Economist. Note: The measure used is modified duration, which measures the expected change in a bond’s price to a 1% change in interest rates. See important disclaimers at the bottom of the page.
-
Twenty percent of the high yield index trades with yields higher than 10%, see chart below.
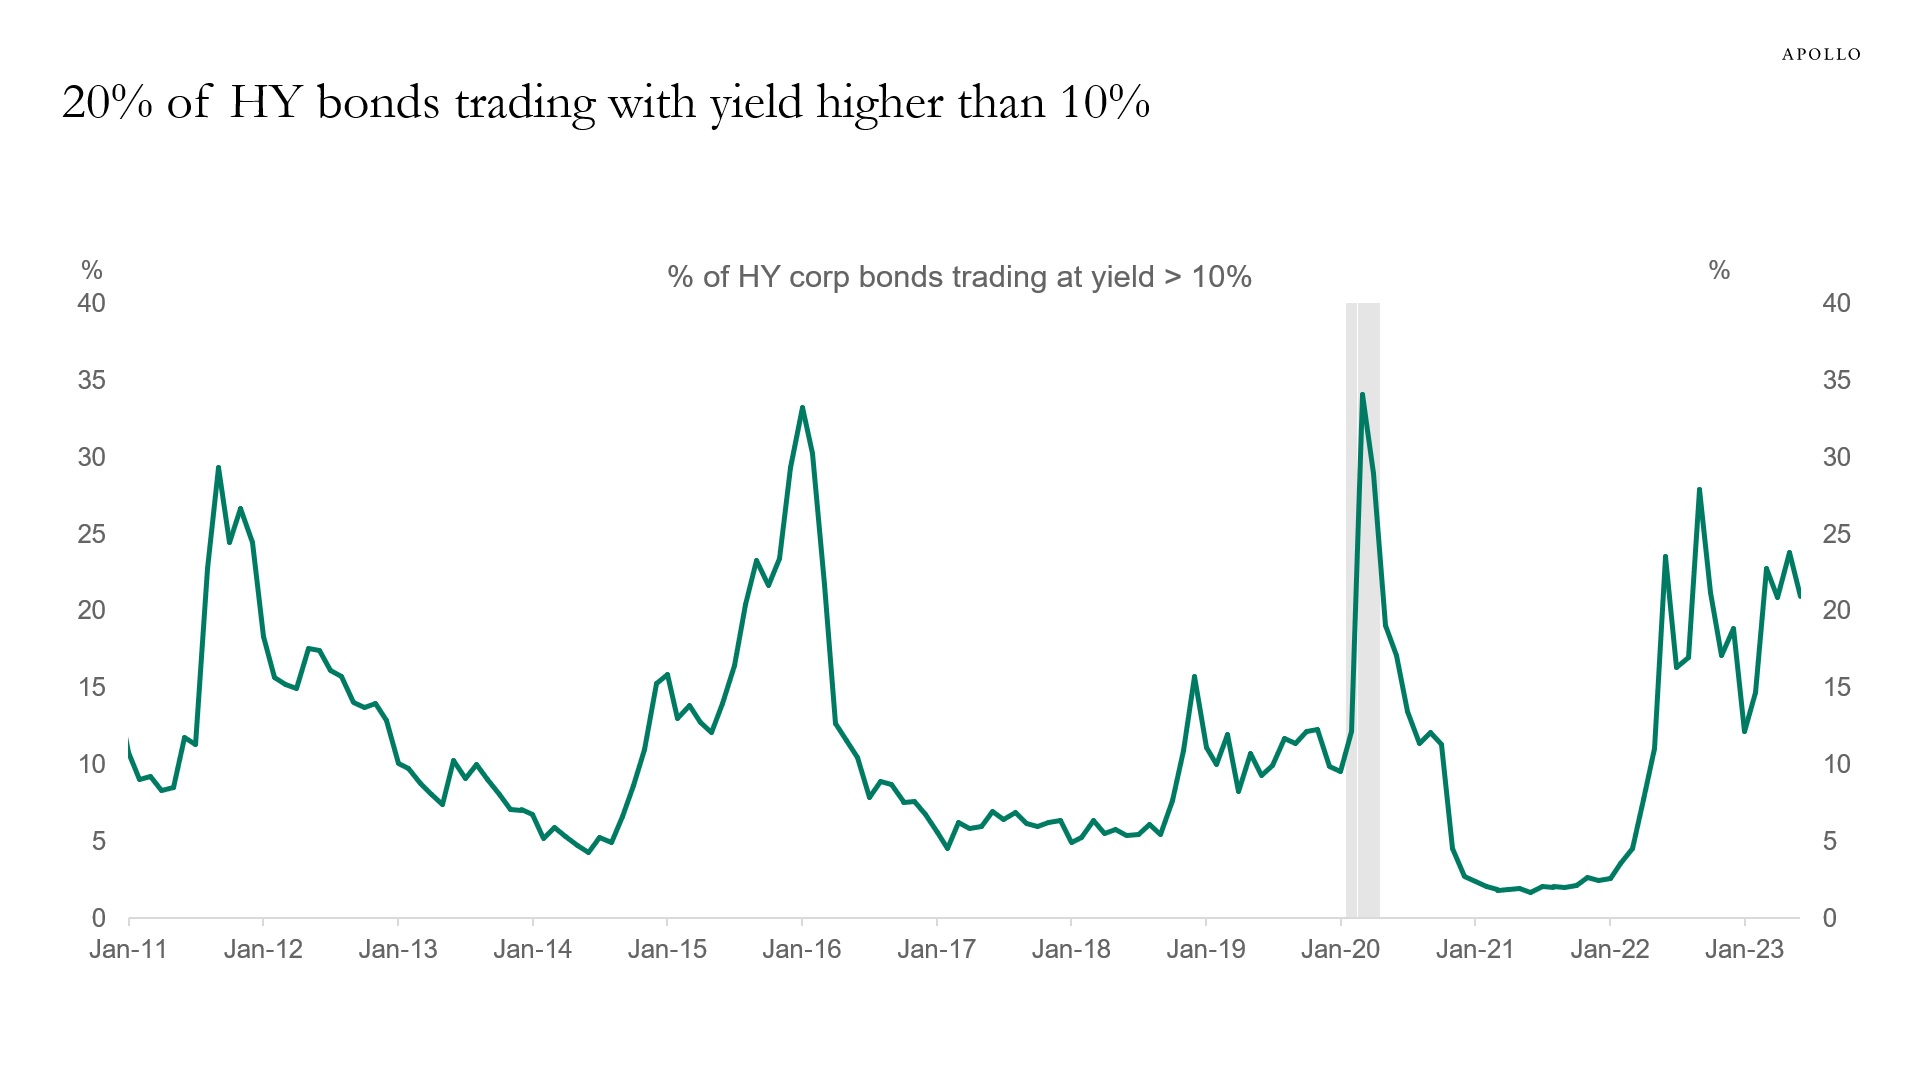
Source: Bloomberg, Apollo Chief Economist. Note: HY bond universe is H0A0 Index. See important disclaimers at the bottom of the page.
-
The high and rising share of small-cap companies with negative earnings makes middle-market companies more vulnerable as the Fed keeps interest rates higher for longer, see chart below.
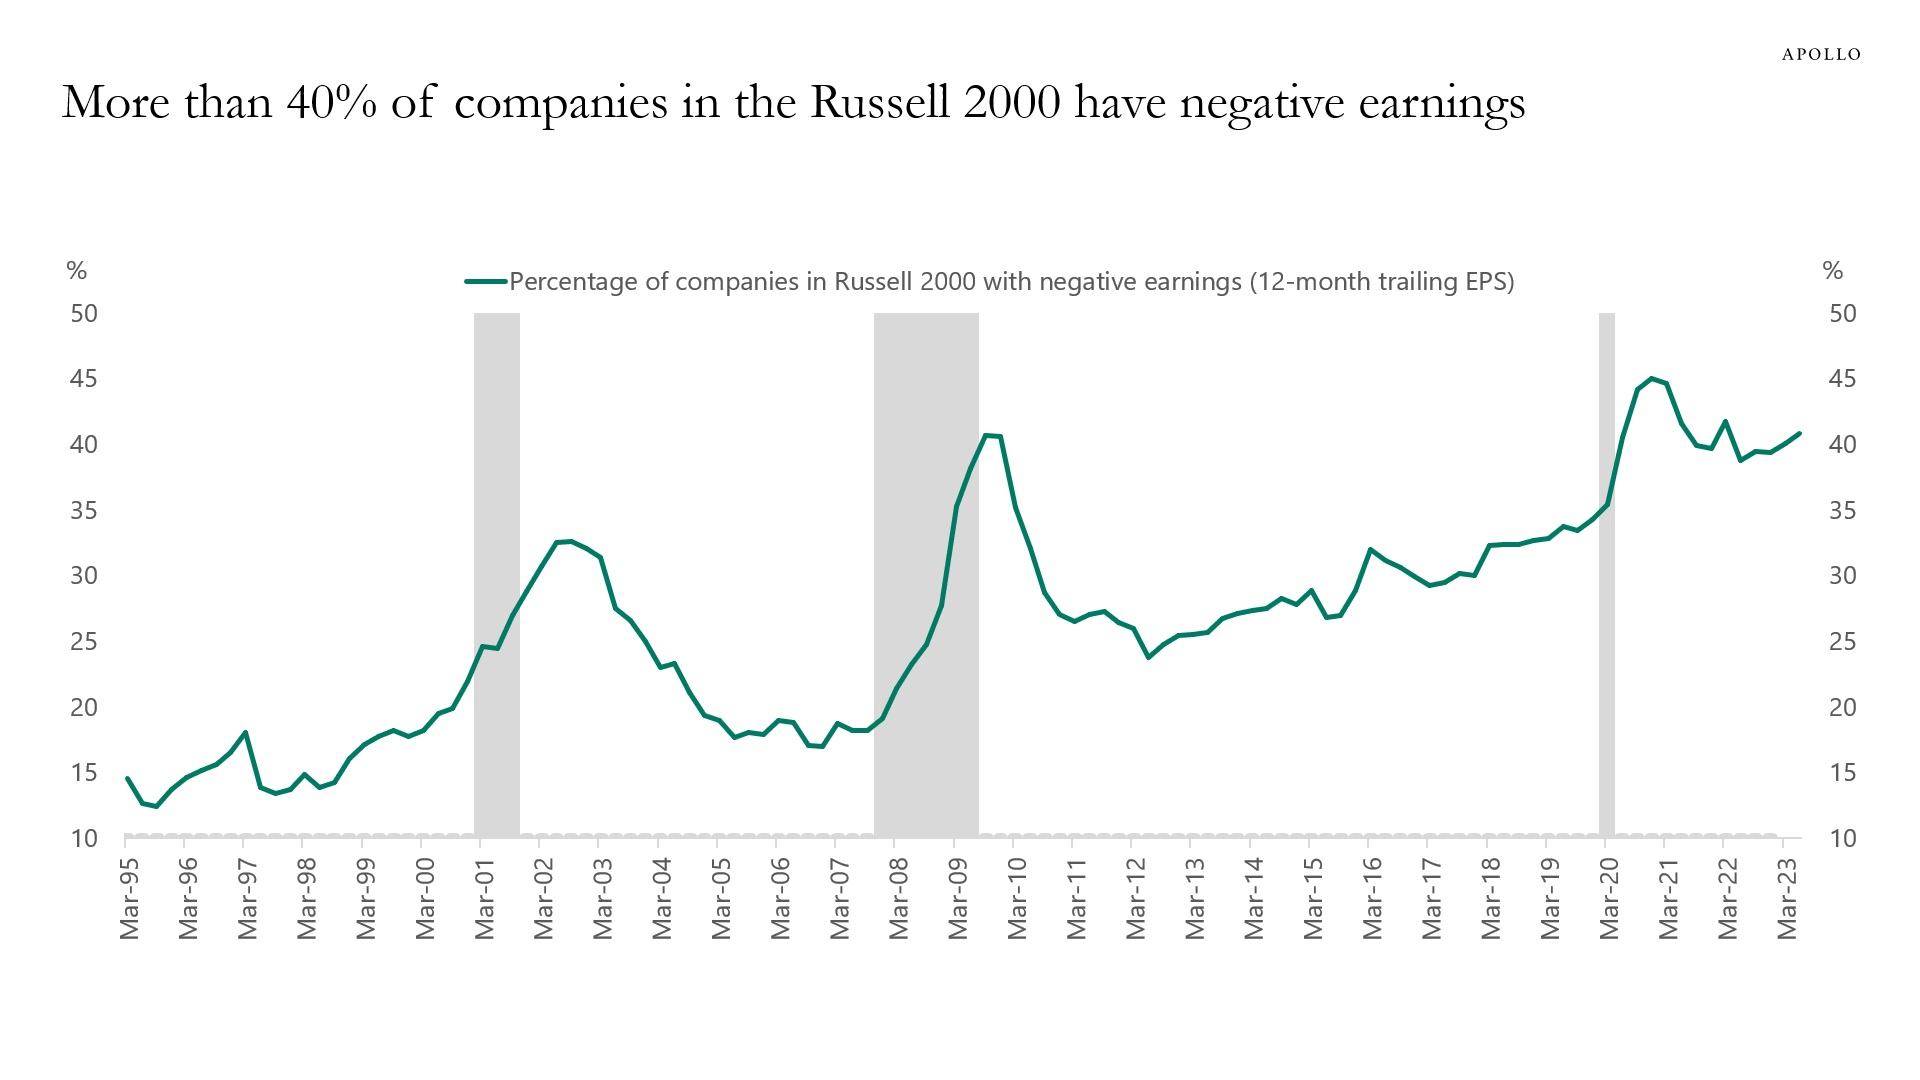
Source: Bloomberg, Apollo Chief Economist See important disclaimers at the bottom of the page.
-
Imports are falling, and this normally only happens when the economy is in a recession, see chart below.
The weakness in the goods sector is offset by continued strength in the less interest rate-sensitive service sector, which makes up 80% of GDP.
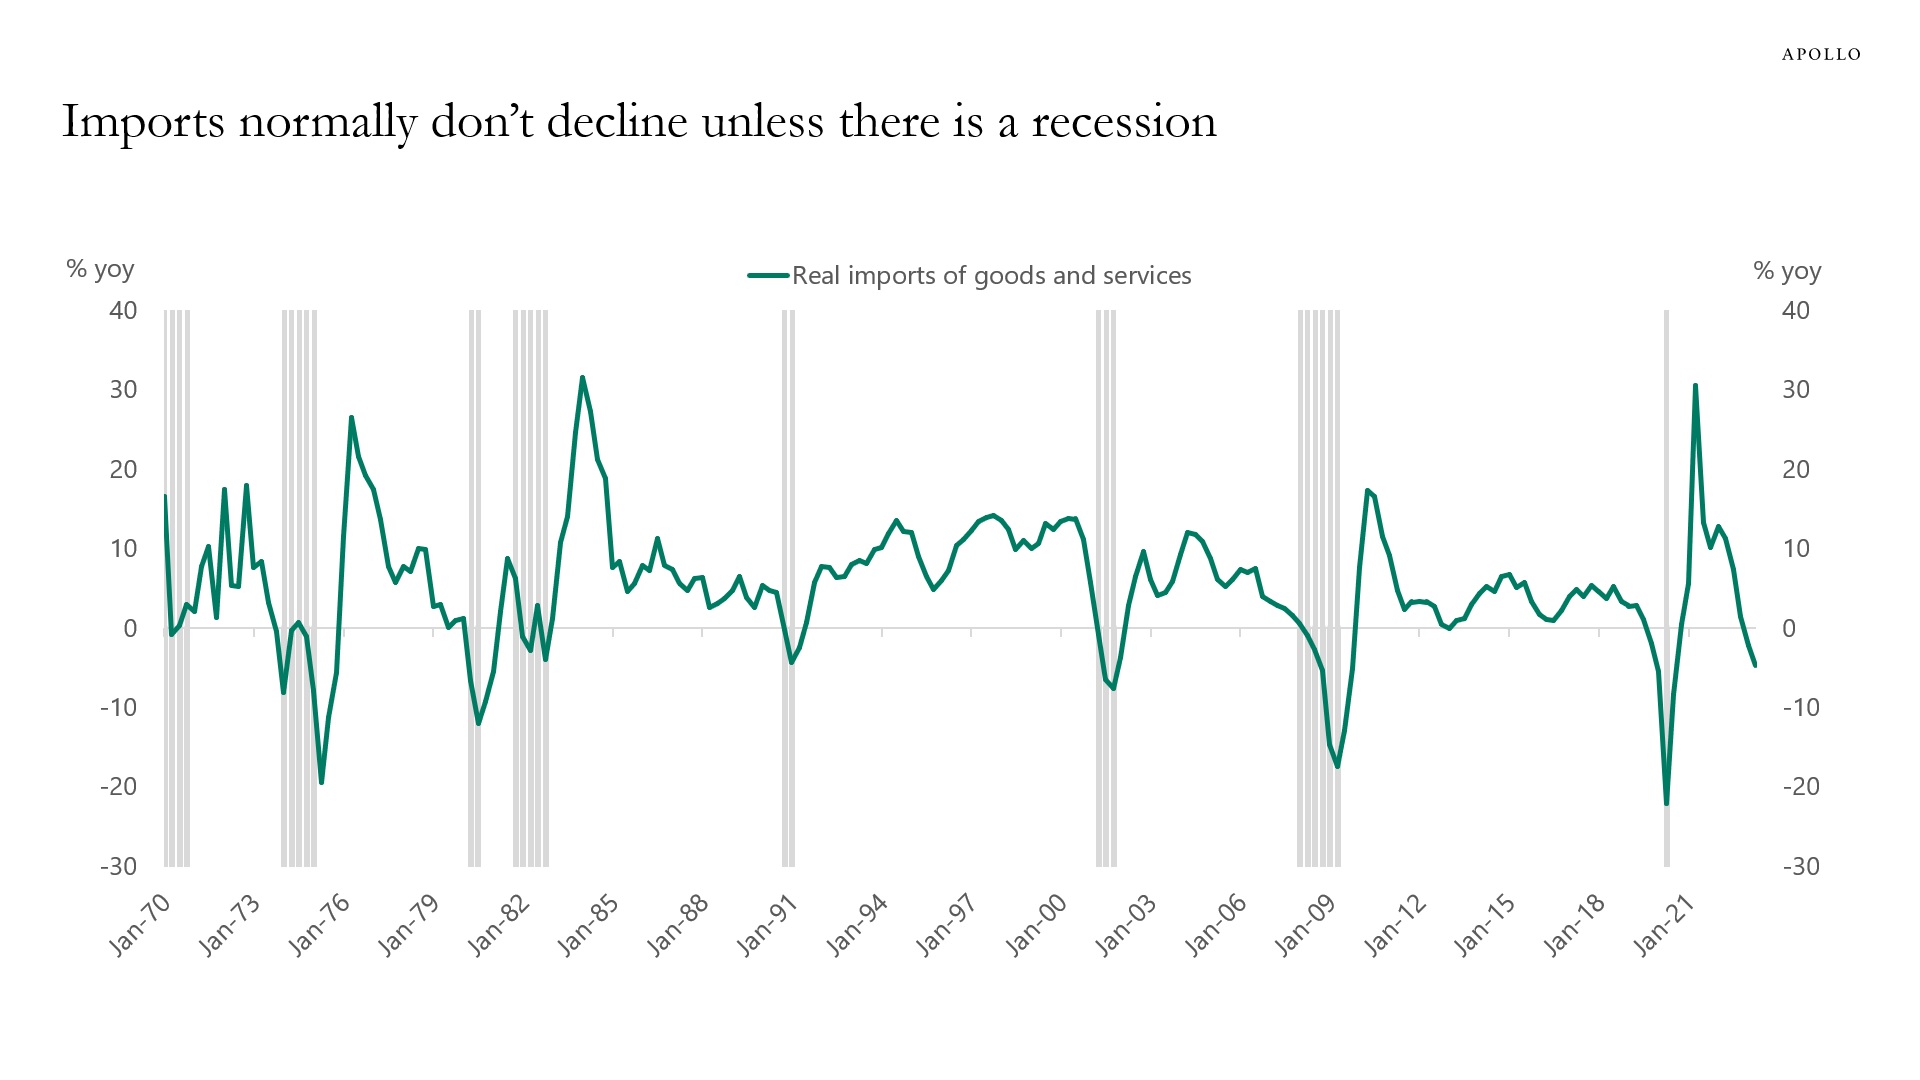
Source: BEA, FRED, Apollo Chief Economist See important disclaimers at the bottom of the page.
-
There are a total of 45 million people with student loans, and the average monthly student loan payment is around $200. So resuming student loan payments in October will subtract roughly $9 billion from consumer spending every month, or roughly $100 billion a year, and this will mainly have an impact on younger households, see chart below.
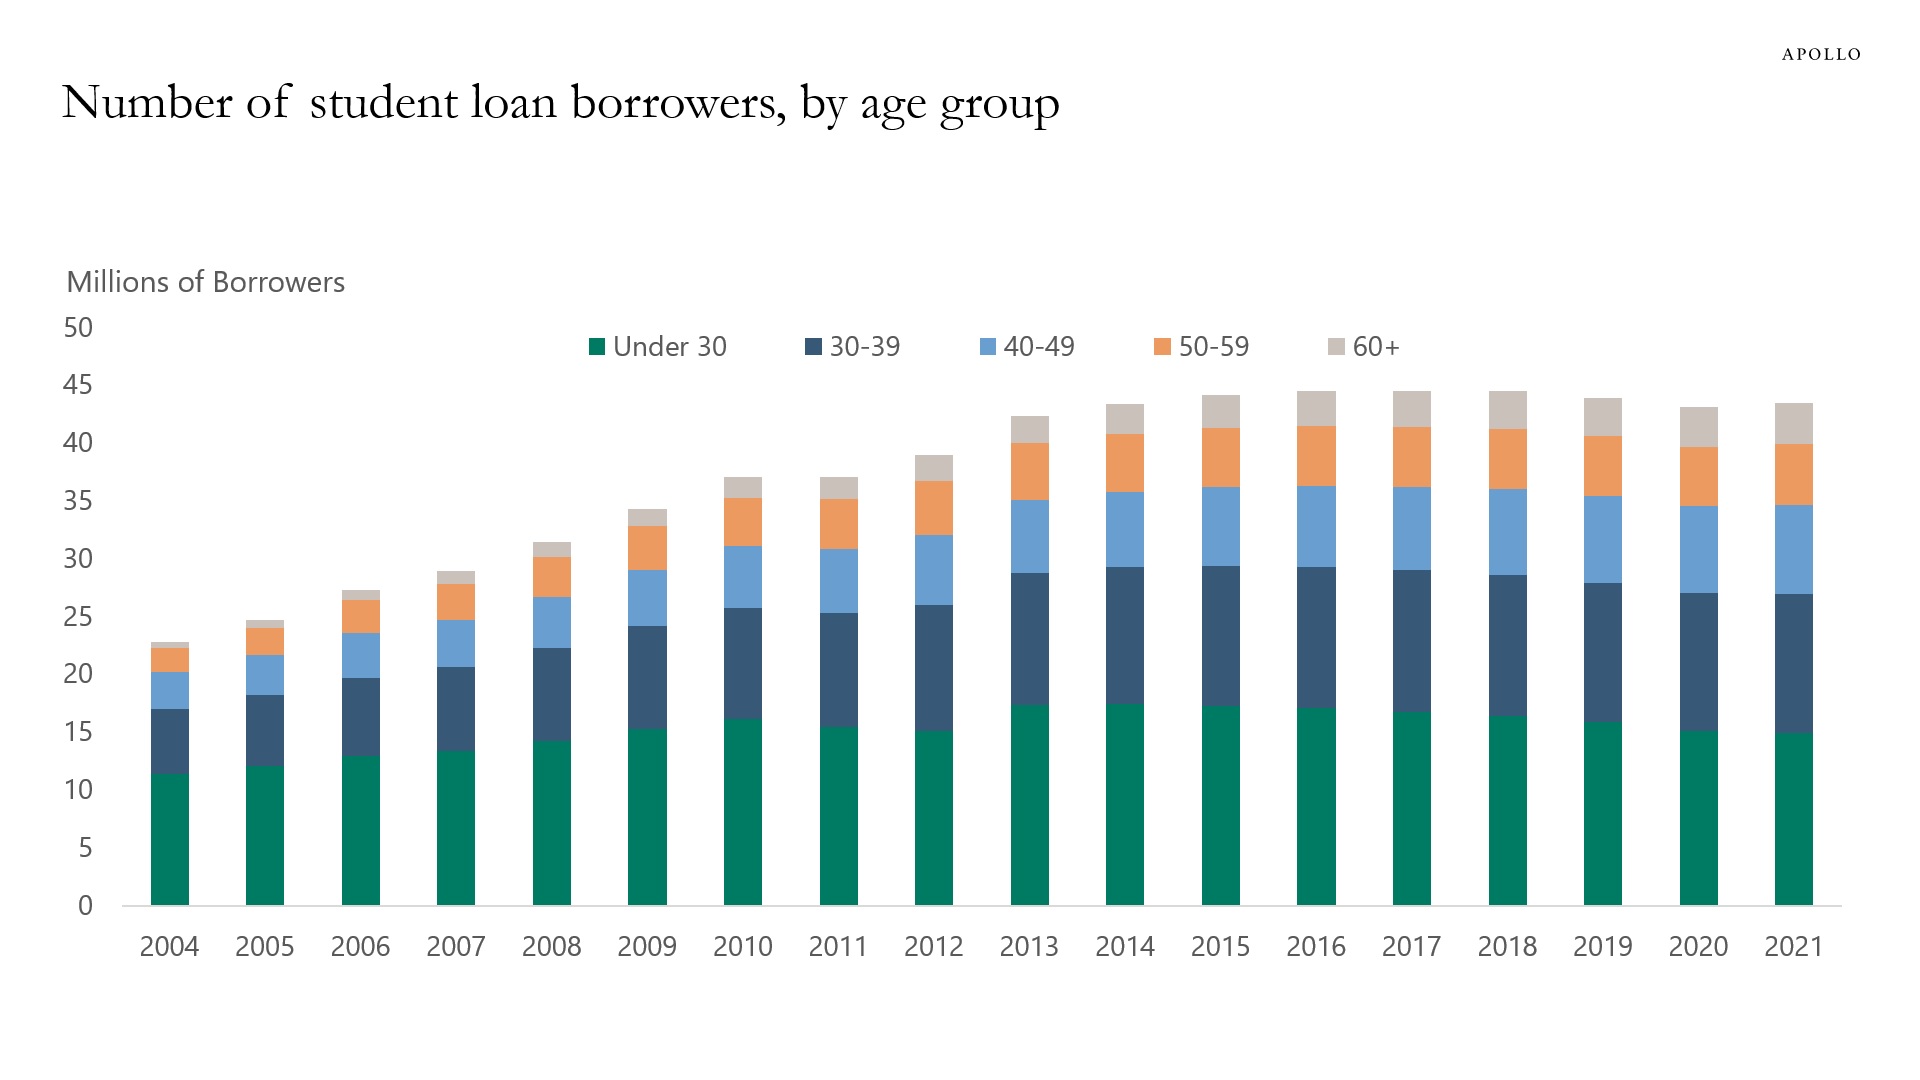
Source: FRBNY, Apollo Chief Economist See important disclaimers at the bottom of the page.
-
Total employment in the US economy is currently around 156 million, and we estimate that total employment of companies in the high yield index is 11 million, and total employment of companies in the leveraged loans index is 8 million, see chart below. With interest rates staying high for at least another year, the downside risks to employment continue to be meaningful.
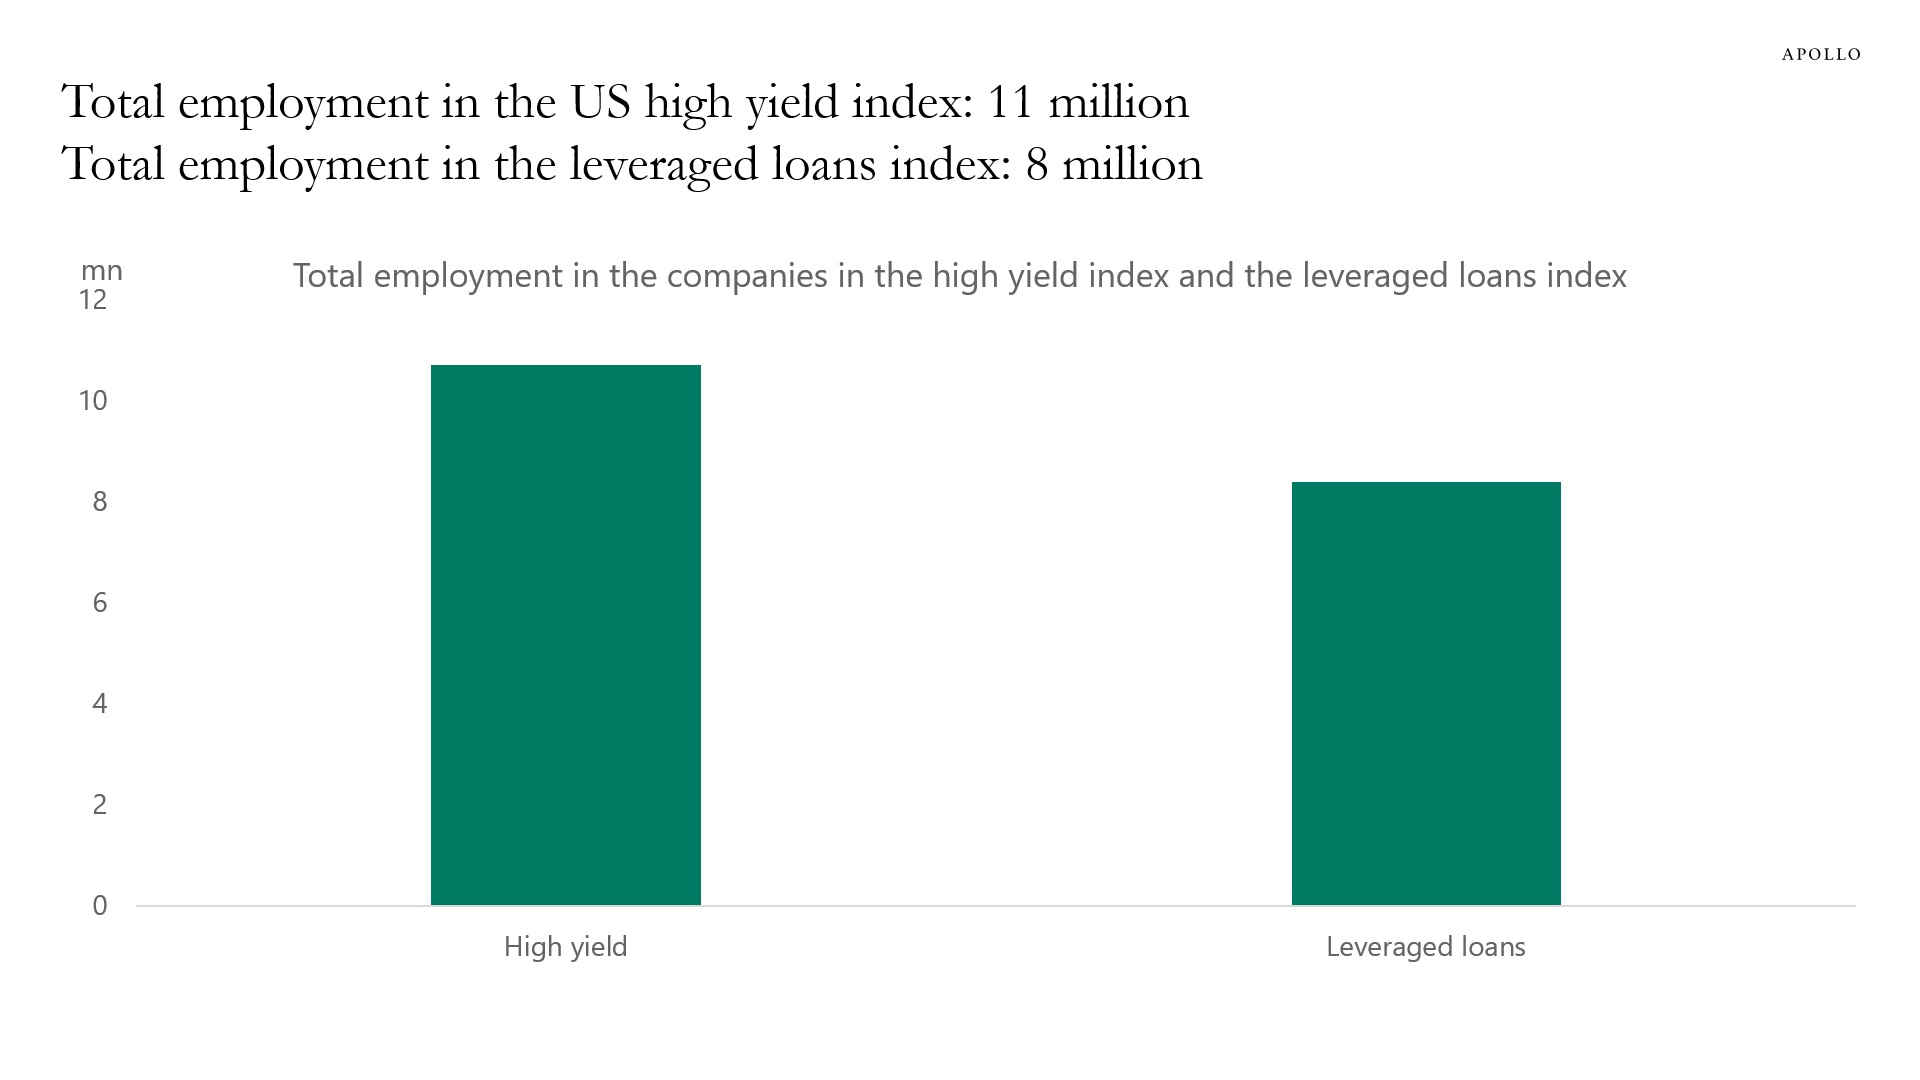
Source: Bloomberg, ICE BofA H0A0 Index, Morningstar LSTA Index, Apollo Chief Economist. Note: Data includes 858 companies in the HY index with employment data available for 589 companies and median employment assumed for the rest. Similarly, there are 1059 companies in the leveraged loans index with employment data available for 451 companies and median employment assumed for the rest. See important disclaimers at the bottom of the page.
-
With yields going up in Japan, the risk is that Japanese investors will now begin to sell US fixed income and start buying higher-yielding Japanese fixed income.
This is a big deal for global fixed income markets because Japanese investors are the biggest foreign holder of US Treasuries, and they also own significant amounts of US credit.
Our updated BoJ YCC exit chart book is available here, a few key stats:
- Japan is the largest holder of US Treasuries in the world, see the first chart below.
- The BoJ owns more than 50% of all JGBs outstanding, see the second chart.
- BoJ JGB buying has been a dominant force in markets for the past decade, see the third chart.
- Because of the significant yield differences in the front end of the yield curve between the US and Japan, the hedging costs for Japanese investors buying US Treasuries are very high at the moment, see the fourth chart.
- Also, this BoJ illustration of their policy change shows how they will now do “YCC with greater flexibility.”
All other central banks in the world, including the Fed, ECB, BoE BoC, and RBA, have aggressively raised short-term interest rates to get inflation under control. The BoJ has not raised short-term interest rates, and abandoning YCC is the BoJ’s response to high inflation. The BoJ YCC policy started in 2016.
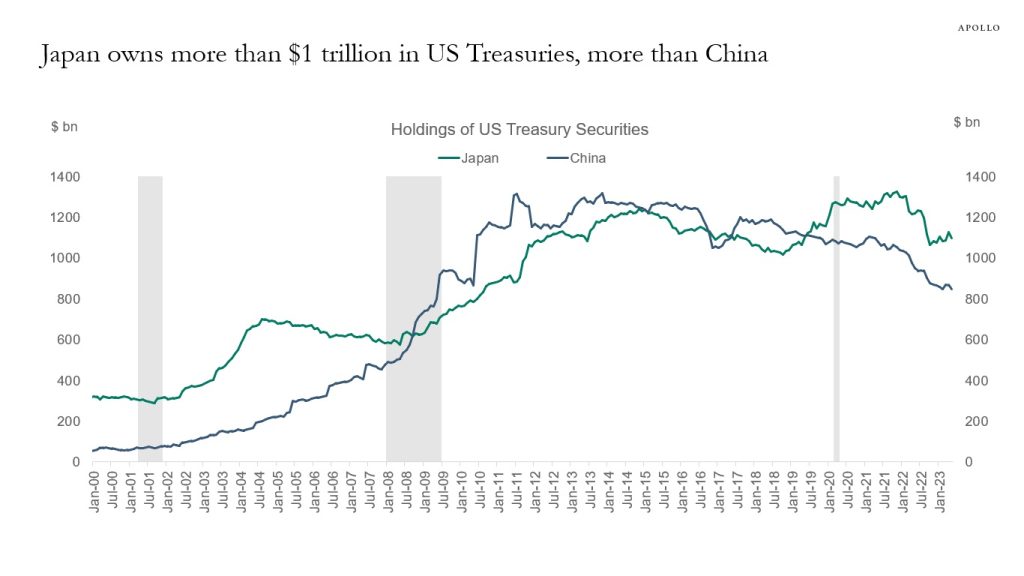
Source: Bloomberg, Apollo Chief Economist 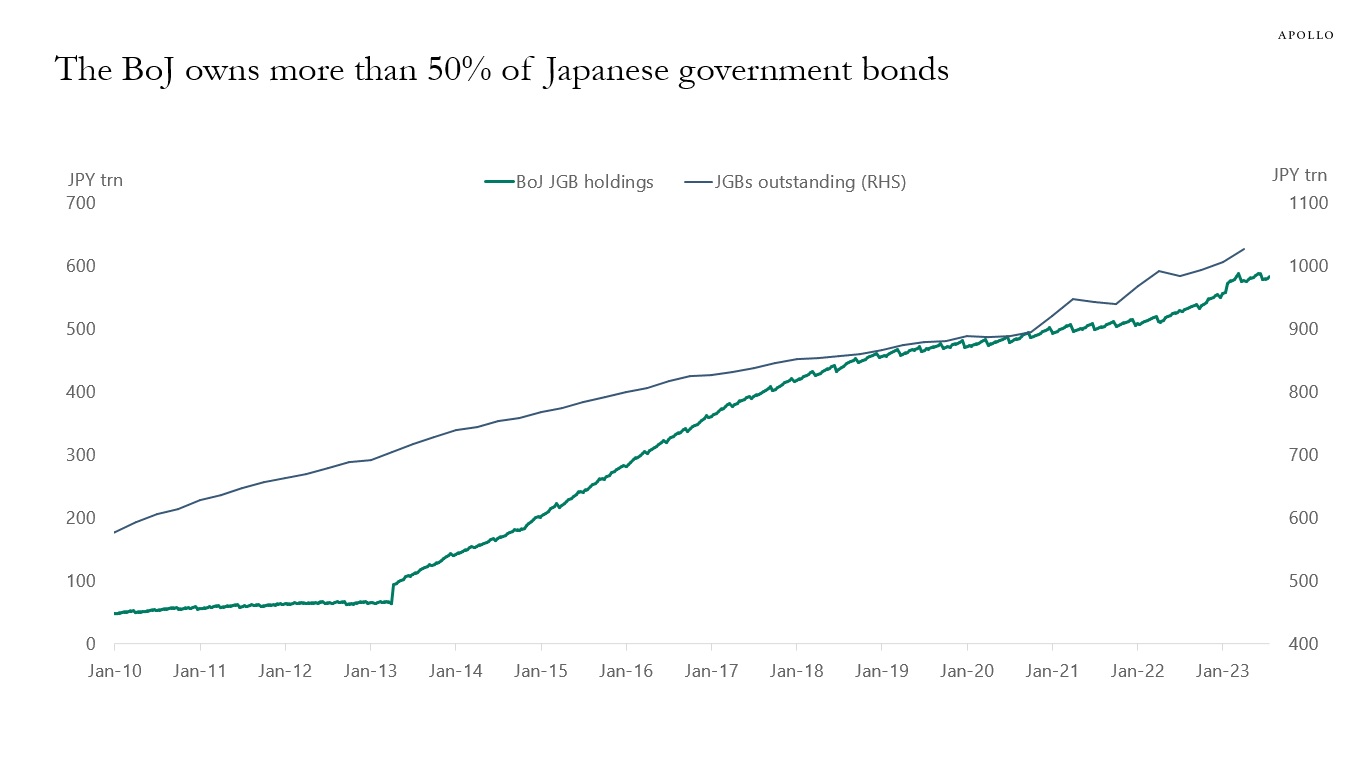
Source: BoJ, Bloomberg, Apollo Chief Economist 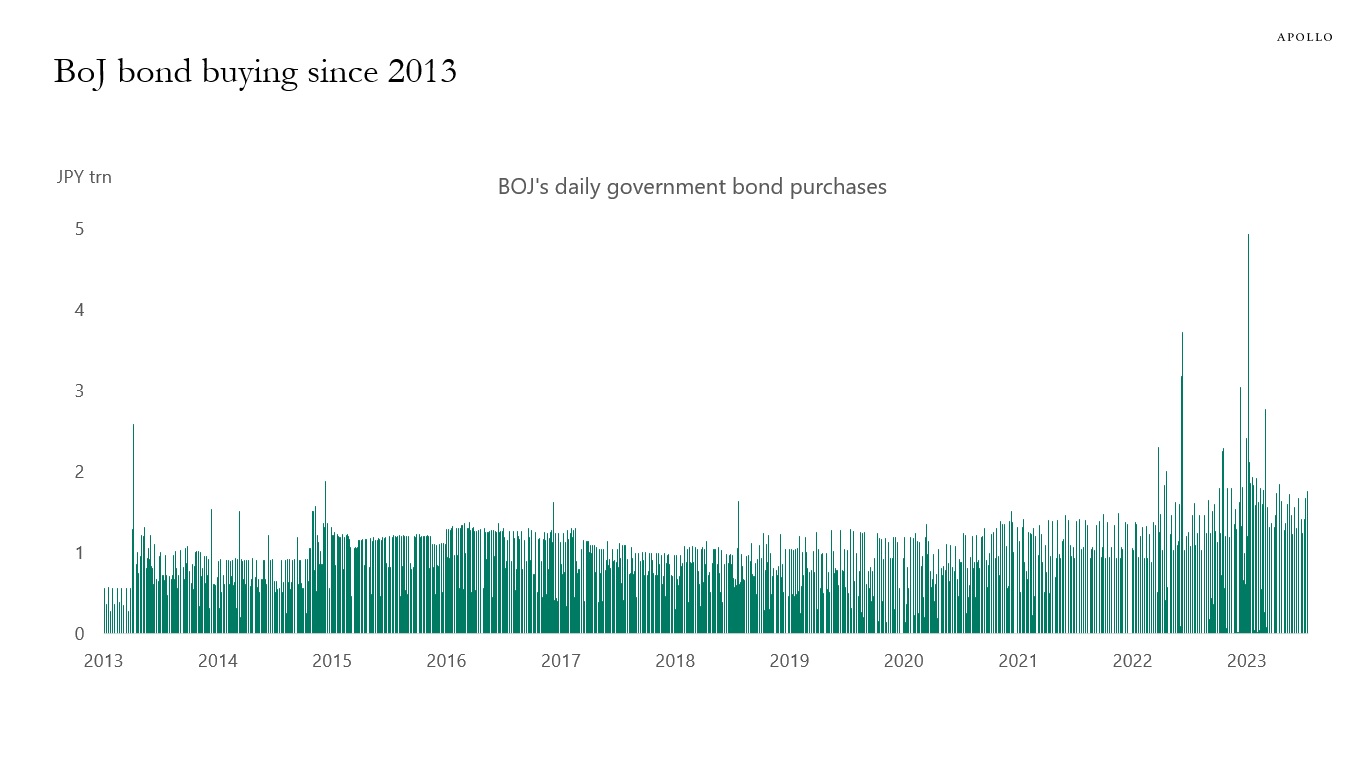
Source: Bloomberg, Apollo Chief Economist 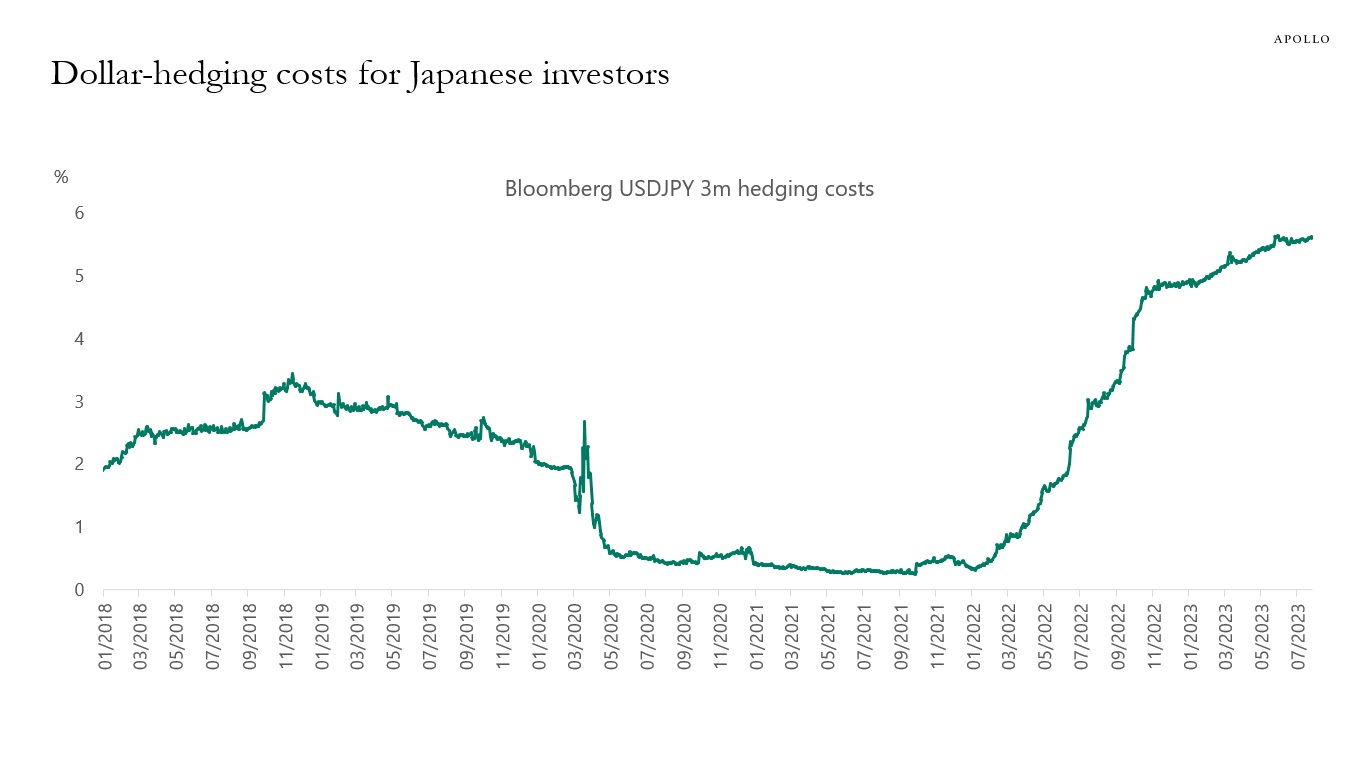
Source: Bloomberg, Apollo Chief Economist See important disclaimers at the bottom of the page.
-
The Fed has used the Taylor Rule framework for decades to understand what the Fed funds rate should be, and inserting the current level of inflation and unemployment into the Taylor Rule shows that the Fed funds rate today should be 9%, see chart below and our Daily Spark here.
The ongoing gap between the Fed funds rate predicted by the Taylor Rule and the actual Fed funds rate raises the question whether the Fed remains behind the curve. In other words, if the economy reaccelerates over the coming quarters with higher consumer spending and a boom in housing, it will increase the risk that the Taylor Rule was right and that the Fed will have to continue hiking.
In sum, for markets to continue to trade higher, the soft landing must be a soft landing, not a reacceleration, because if housing and consumer spending accelerate from here, the Fed will have to raise rates a lot more.
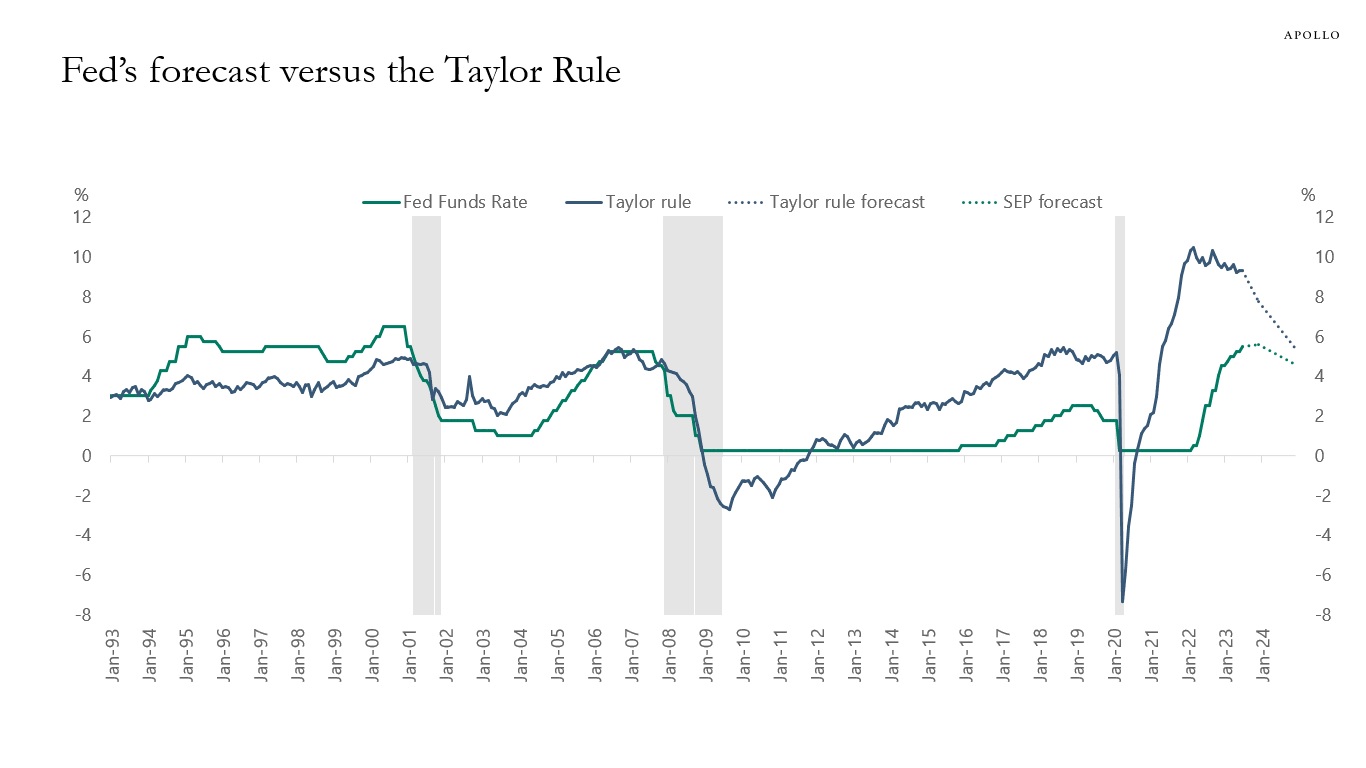
Source: Bloomberg, Fed SEP, Apollo Chief Economist. Note: Taylor Rule calculated using TAYL <GO> function on Bloomberg. See important disclaimers at the bottom of the page.
-
Fed hikes continue to slow down hiring for both small firms and for the broader economy, see charts below. The labor market is softening with hours worked, the number of job openings, and the quits rate all declining.
This is how monetary policy works; higher costs of capital slow down capex spending and hiring, and with rates staying at these levels for a couple of years, this process is going to continue.
That is why the consensus expects negative nonfarm payrolls for six months from October 2023 to March 2024.
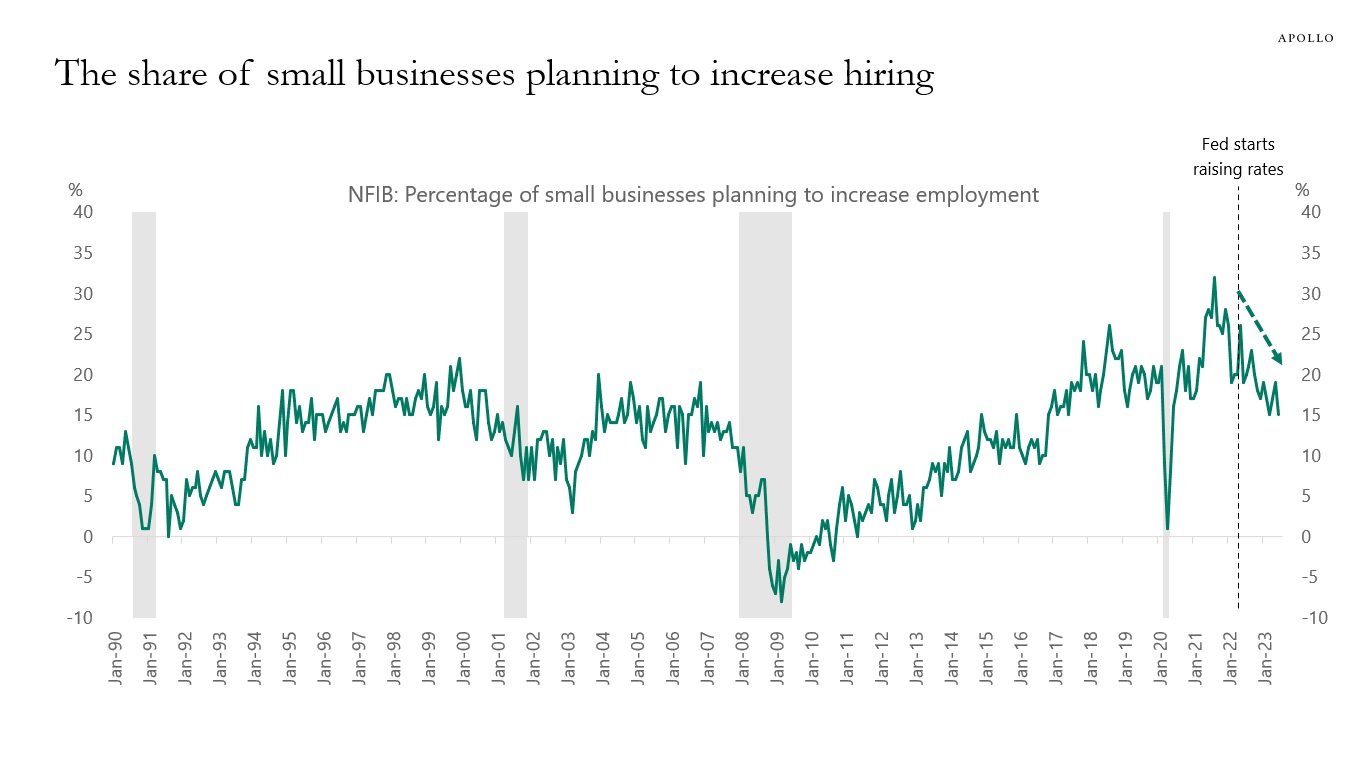
Source: NFIB, Haver Analytics, Apollo Chief Economist 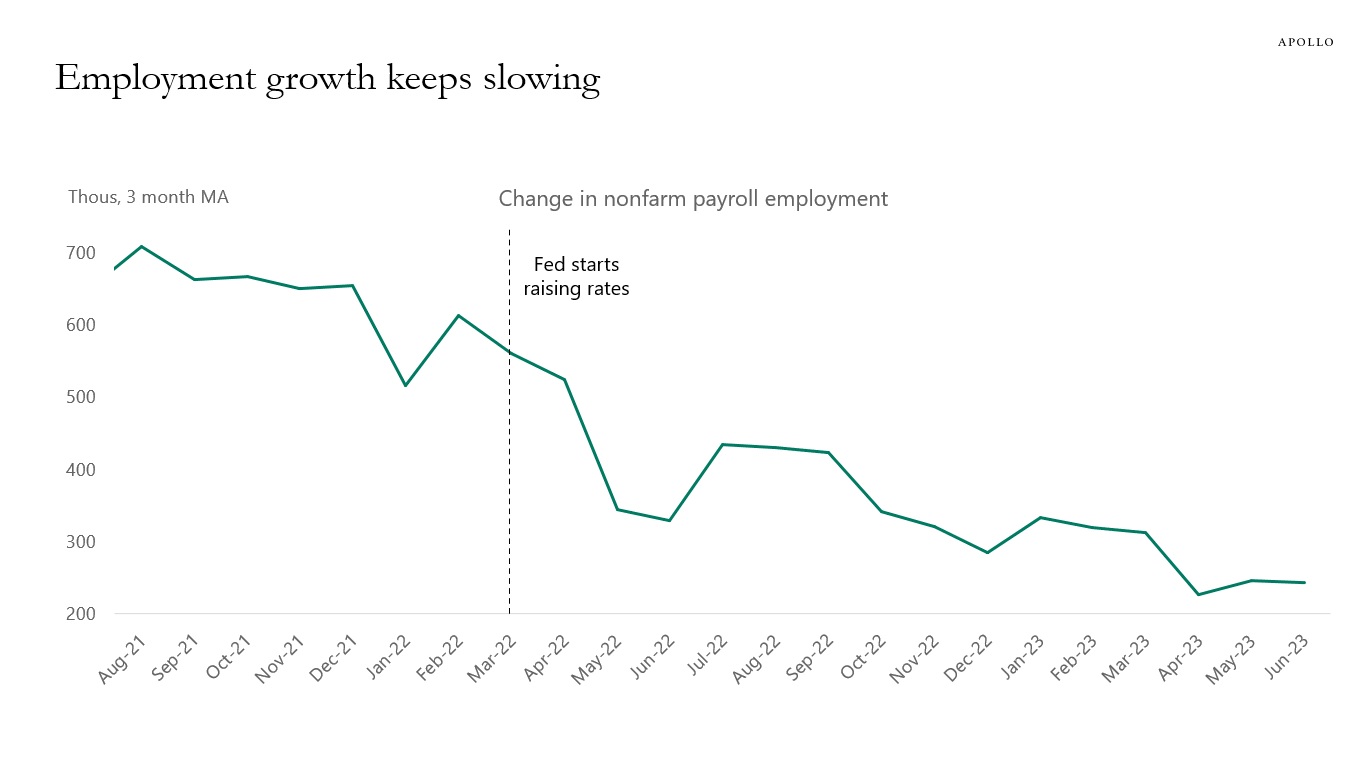
Source: BLS, Haver Analytics, Apollo Chief Economist See important disclaimers at the bottom of the page.

This presentation may not be distributed, transmitted or otherwise communicated to others in whole or in part without the express consent of Apollo Global Management, Inc. (together with its subsidiaries, “Apollo”).
Apollo makes no representation or warranty, expressed or implied, with respect to the accuracy, reasonableness, or completeness of any of the statements made during this presentation, including, but not limited to, statements obtained from third parties. Opinions, estimates and projections constitute the current judgment of the speaker as of the date indicated. They do not necessarily reflect the views and opinions of Apollo and are subject to change at any time without notice. Apollo does not have any responsibility to update this presentation to account for such changes. There can be no assurance that any trends discussed during this presentation will continue.
Statements made throughout this presentation are not intended to provide, and should not be relied upon for, accounting, legal or tax advice and do not constitute an investment recommendation or investment advice. Investors should make an independent investigation of the information discussed during this presentation, including consulting their tax, legal, accounting or other advisors about such information. Apollo does not act for you and is not responsible for providing you with the protections afforded to its clients. This presentation does not constitute an offer to sell, or the solicitation of an offer to buy, any security, product or service, including interest in any investment product or fund or account managed or advised by Apollo.
Certain statements made throughout this presentation may be “forward-looking” in nature. Due to various risks and uncertainties, actual events or results may differ materially from those reflected or contemplated in such forward-looking information. As such, undue reliance should not be placed on such statements. Forward-looking statements may be identified by the use of terminology including, but not limited to, “may”, “will”, “should”, “expect”, “anticipate”, “target”, “project”, “estimate”, “intend”, “continue” or “believe” or the negatives thereof or other variations thereon or comparable terminology.