


Want it delivered daily to your inbox?
-
The share of financial wealth in bank deposits is 51% in Japan, 37% in Germany and 11% in the United States, see chart below.
The bottom line is that there is enormous potential for consumers to put more money into yield products.
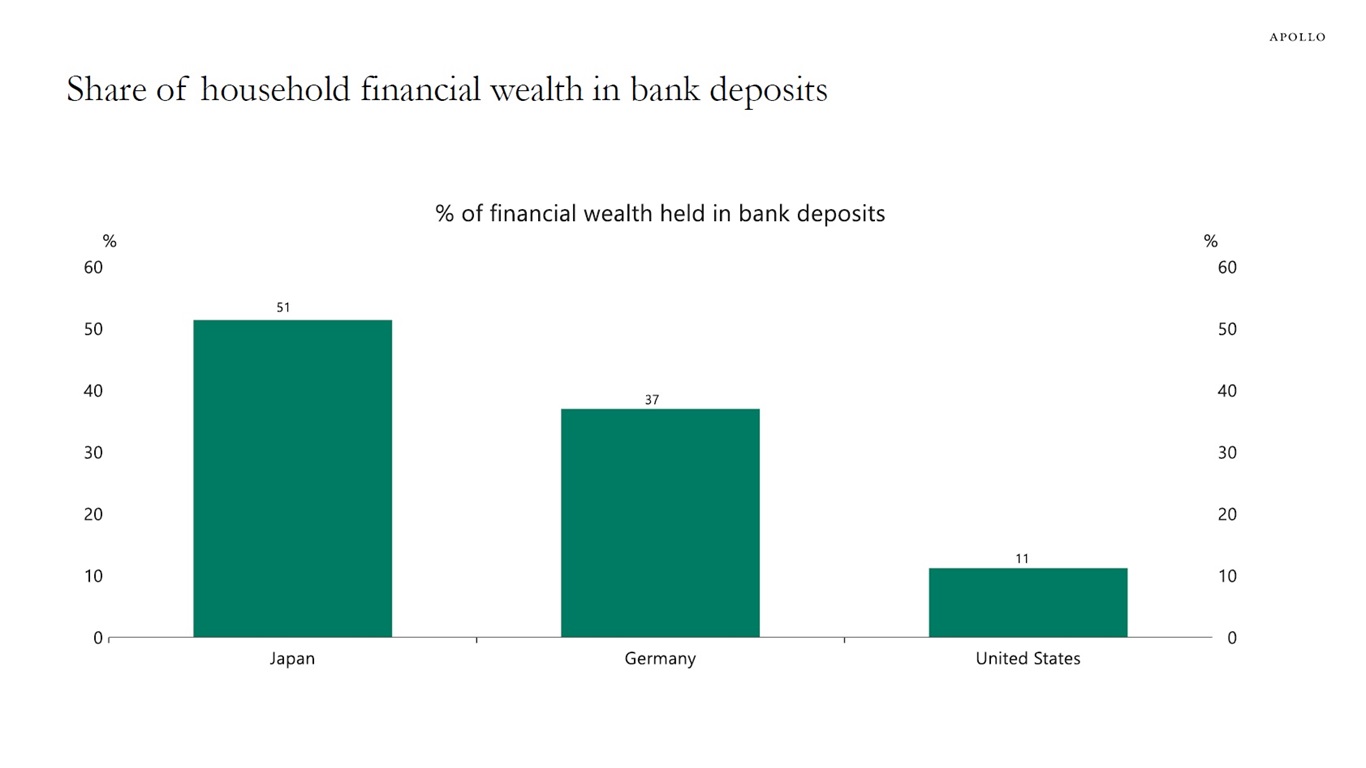
Data as of 2024. Sources: OECD (Organisation for Economic Co-operation and Development), Macrobond, Apollo Chief Economist See important disclaimers at the bottom of the page.
-
More than 4,500 objects were launched into space in 2025, up from 600 in 2019.
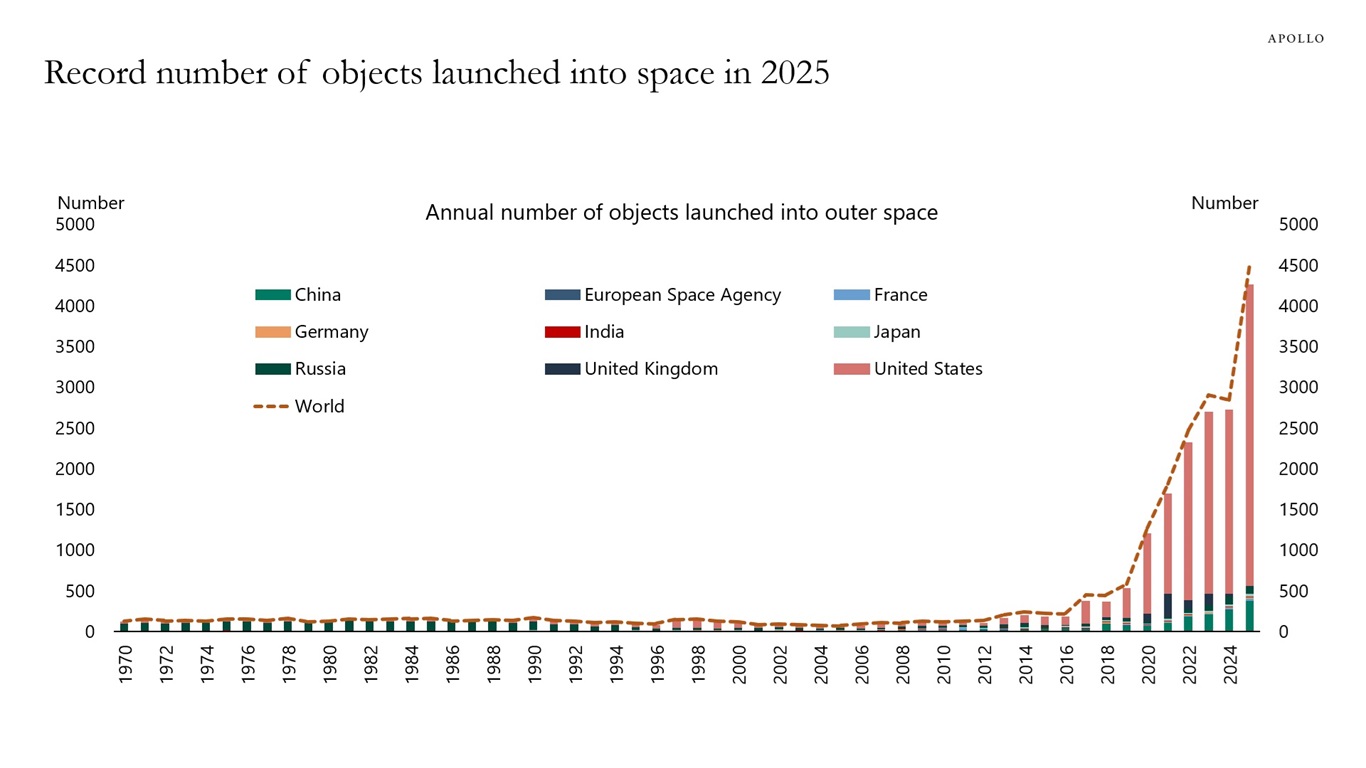
Note: Objects are defined here as satellites, probes, landers, crewed spacecrafts, and space station flight elements launched into Earth’s orbit or beyond. Sources: Our World in Data, United Nations Office for Outer Space Affairs, Apollo Chief Economist See important disclaimers at the bottom of the page.
-
The 10 biggest companies in the S&P 500 make up almost 40% of the index, and if Anthropic, OpenAI and SpaceX are added later this year, the concentration could approach 50%, see chart below. The bottom line is that the S&P 500 basically doesn’t offer much diversification anymore.
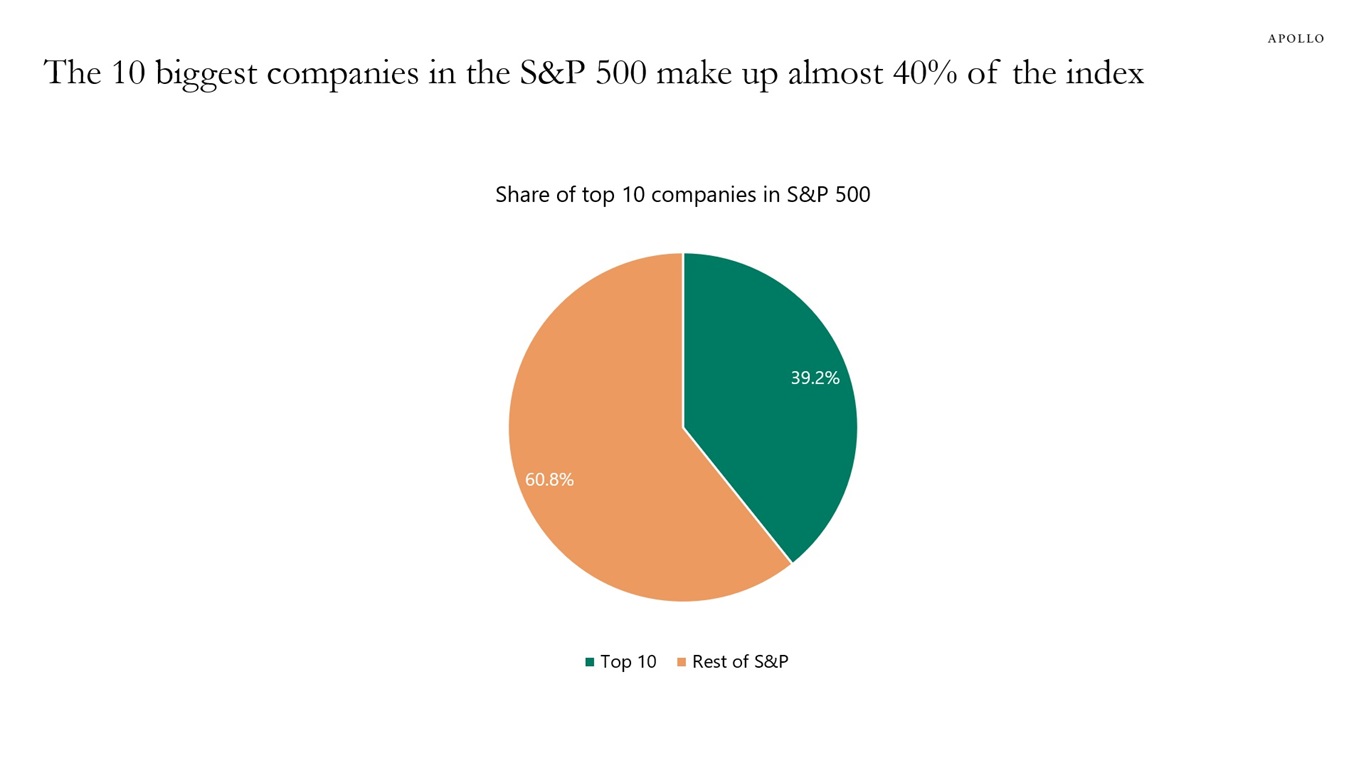
Sources: Bloomberg, Apollo Chief Economist See important disclaimers at the bottom of the page.
-
Our chart book (available here) documents the growing retirement crisis.
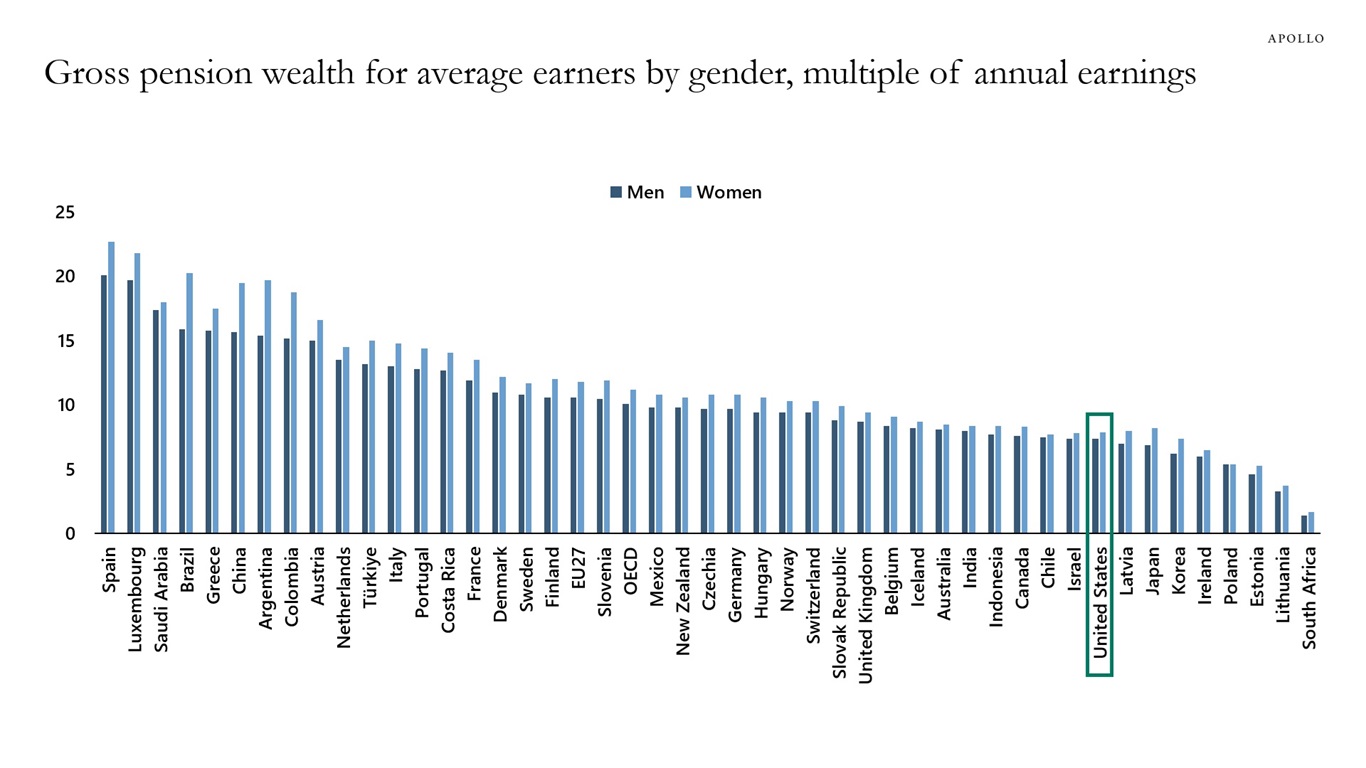
Note: Pension wealth – a measure of the stock of future discounted flows of pension benefits – takes account of these factors. It can be thought of as the lump sum needed at the retirement age to purchase, without paying any fees, an annuity giving the same flow of pension payments as that promised by mandatory retirement-income schemes. Since women’s life expectancy is longer than men’s, pension wealth for women is higher in all countries. Sources: OECD, Apollo Chief Economist See important disclaimers at the bottom of the page.
-
Software faces a massive $40 billion maturity wall in 2028, dominated by lower-rated B- credits, exposing the sector to refinancing risks amid AI disruption and rates higher for longer, see chart below.
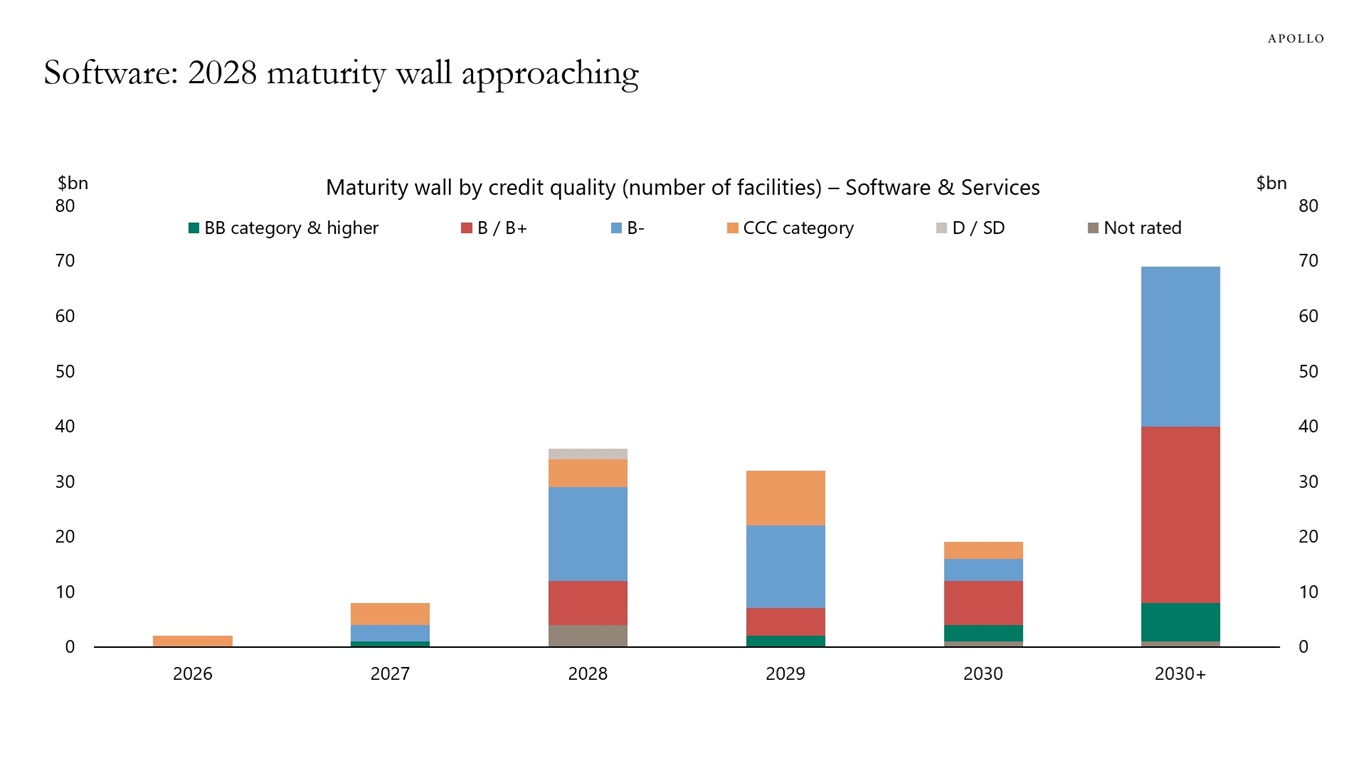
Note: Data through February 2026. Sources: PitchBook | LCD; Morningstar LSTA US Leveraged Loan Index, Apollo Chief Economist See important disclaimers at the bottom of the page.
-
With margin debt at record highs, any downturn in stocks risks turning into a sharper correction as leveraged investors are forced to sell into falling markets, see chart below.
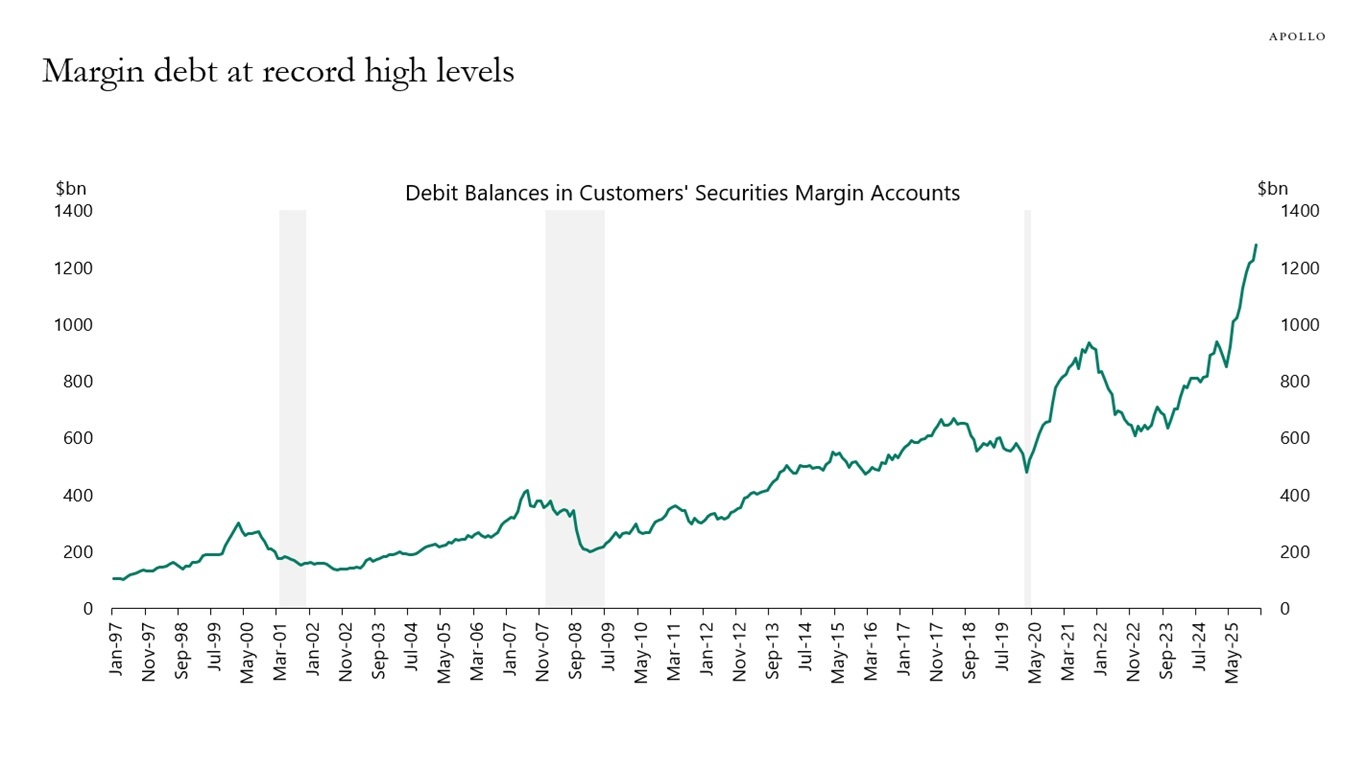
Sources: FINRA, Haver Analytics, Apollo Chief Economist See important disclaimers at the bottom of the page.
-
Our chart book (available here) looks at the simulated effects of $100 oil prices on the economy.
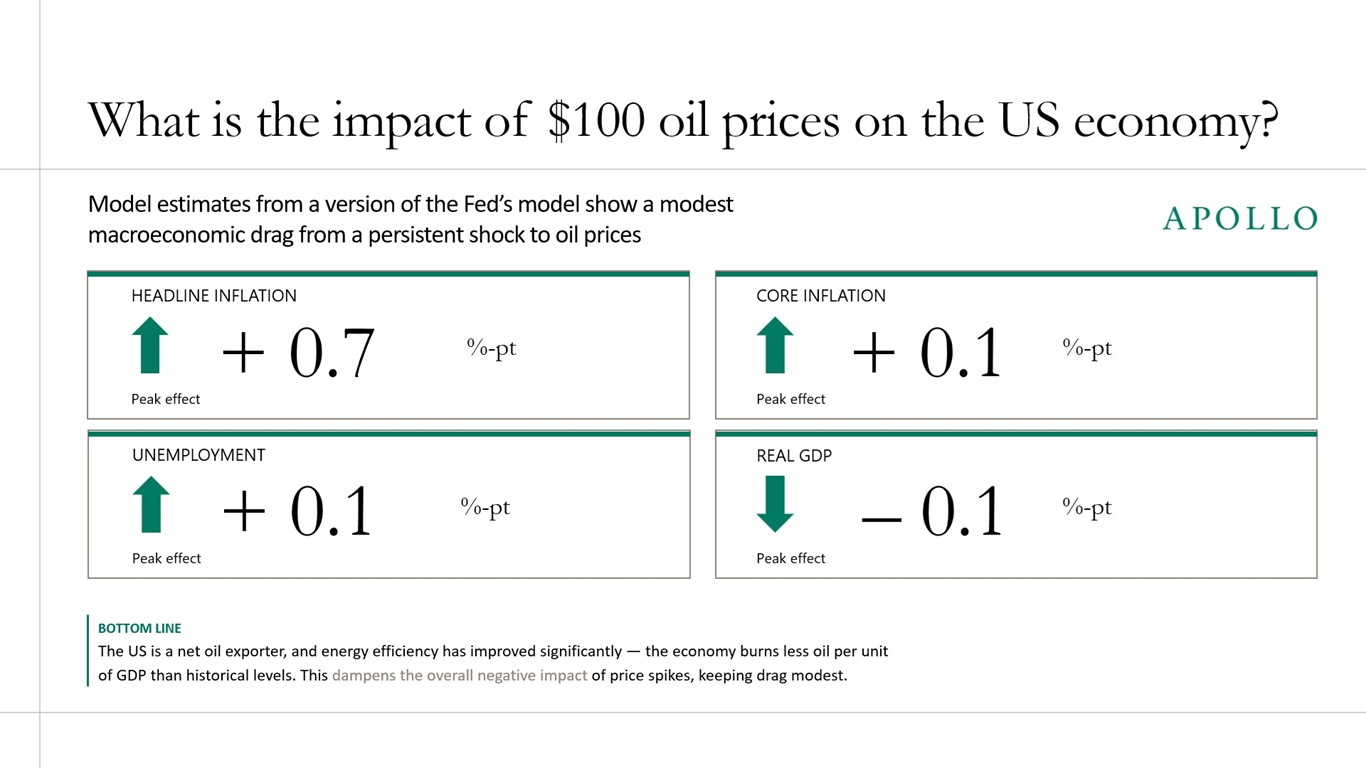
Note: Effects fade over several quarters. Source: Apollo Chief Economist
See important disclaimers at the bottom of the page.
-
Consumer spending data from the New York Fed shows a clear K-shaped pattern where growth has been faster for high-income households than low-income households, see the first chart below. The stronger growth in consumer spending for high-income households is driven by the K-shaped growth in wages and wealth, see the second and third chart.
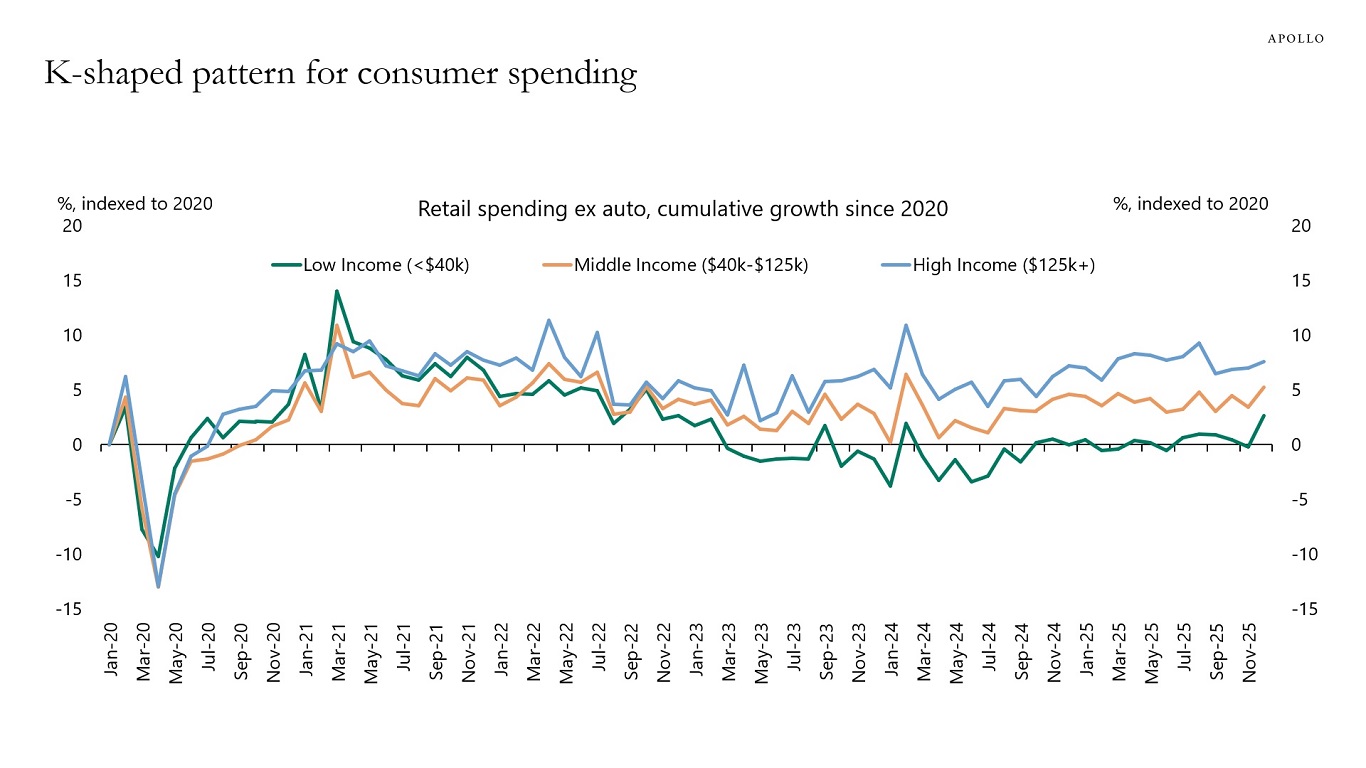
Sources: Economic Heterogeneity Indicators (EHIs) – FEDERAL RESERVE BANK of NEW YORK, Apollo Chief Economist 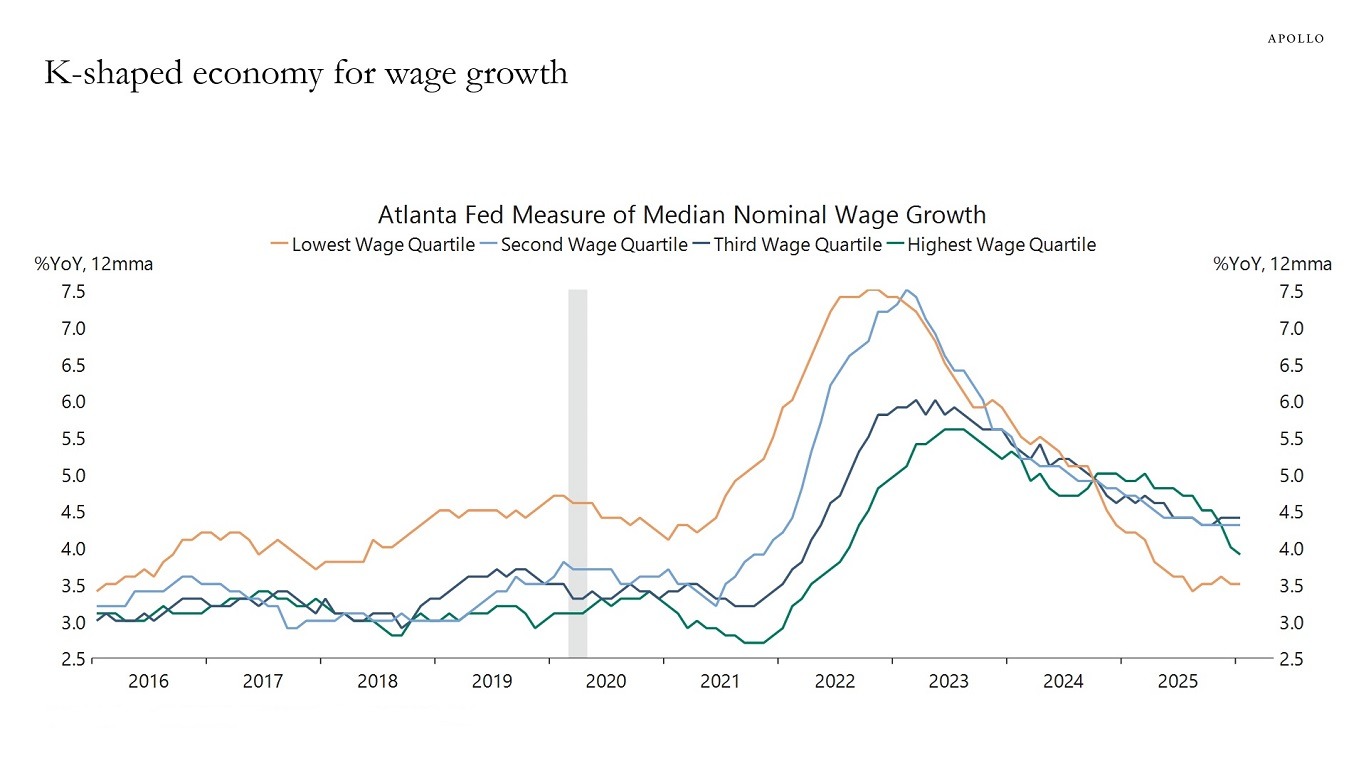
Sources: Federal Reserve Bank of Atlanta, Macrobond, Apollo Chief Economist 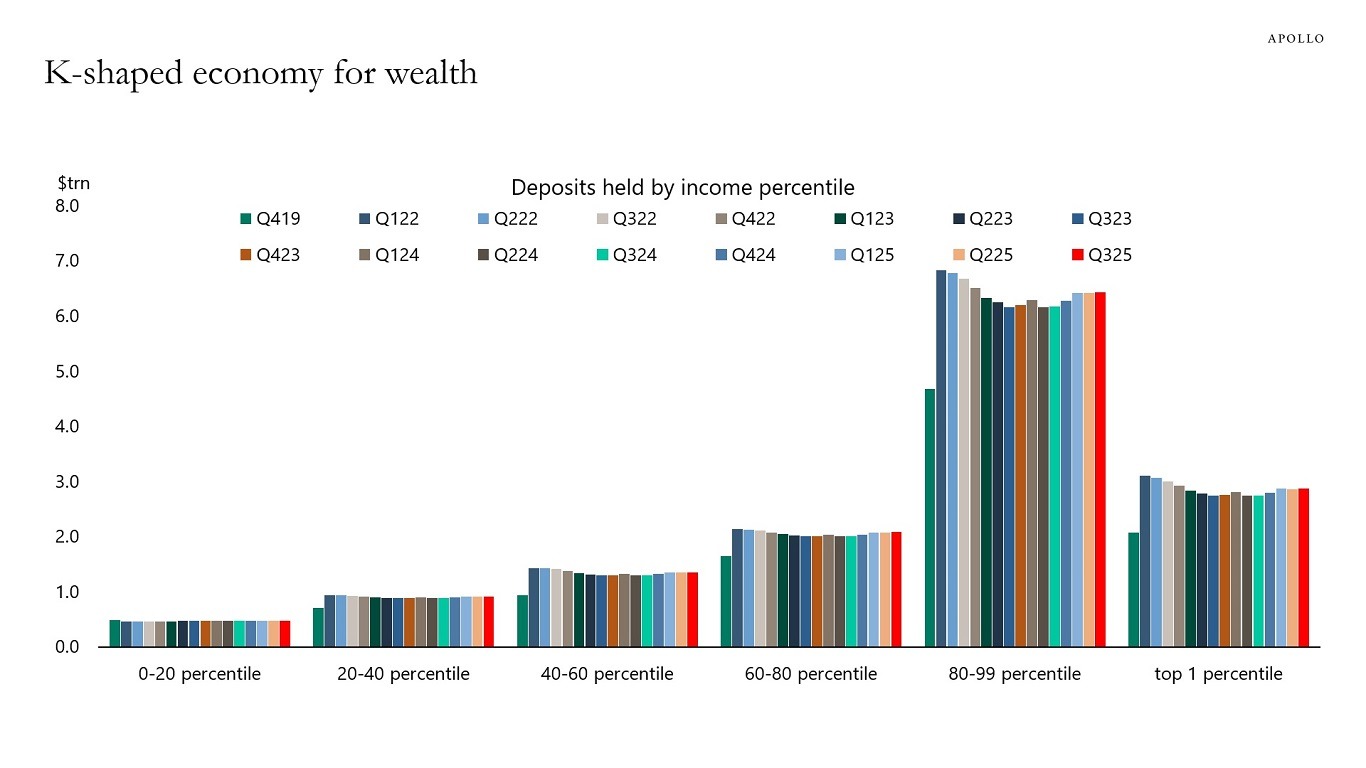
Sources: Federal Reserve Board, Haver Analytics, Apollo Chief Economist See important disclaimers at the bottom of the page.
-
Dallas Fed data show net unauthorized immigration flows turning negative, meaning more individuals are leaving the US than entering, see chart below.
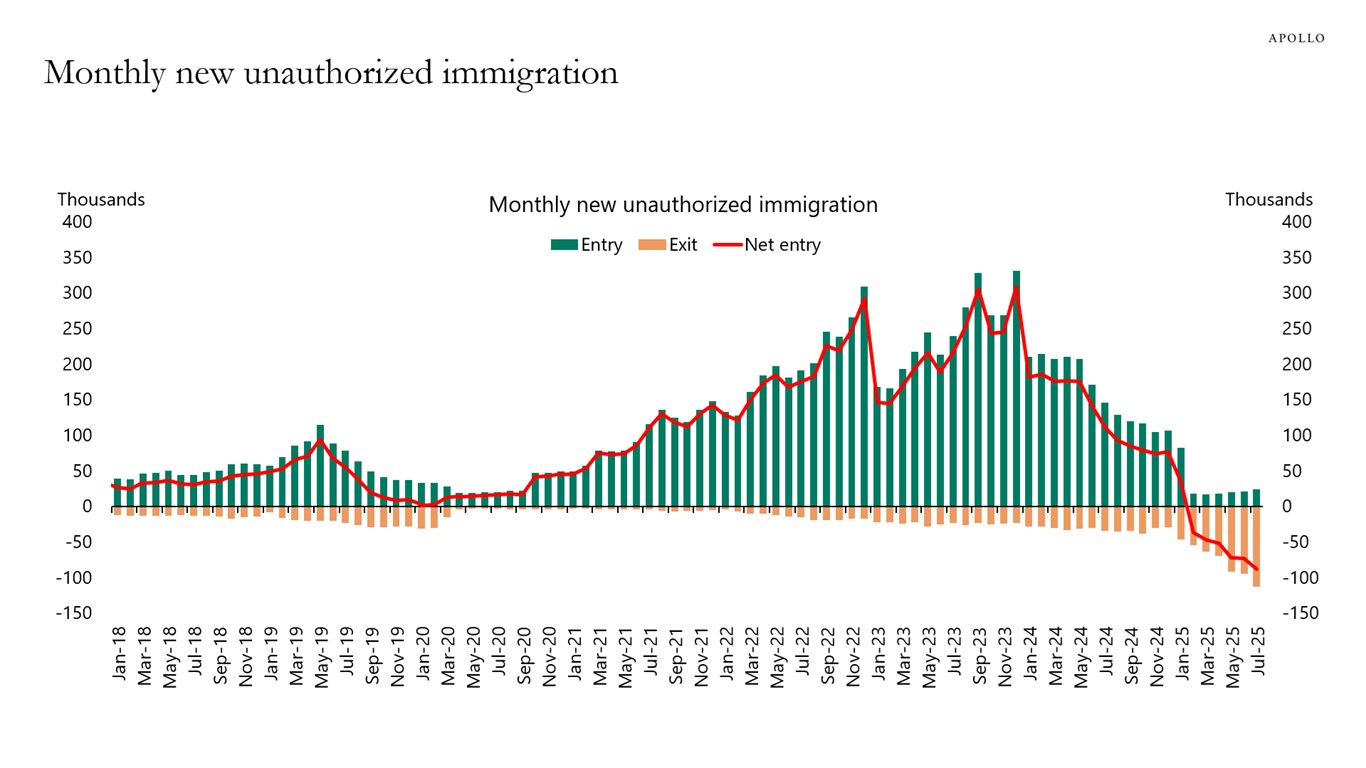
Sources: Federal Reserve Bank of Dallas, Apollo Chief Economist See important disclaimers at the bottom of the page.
-
The surge in new US business formation is being fueled by AI and large language models that are dramatically reducing the cost and complexity of launching a company, see chart below. As these firms scale, they will create jobs, underscoring that AI is likely to strengthen, not disrupt, the US labor market.
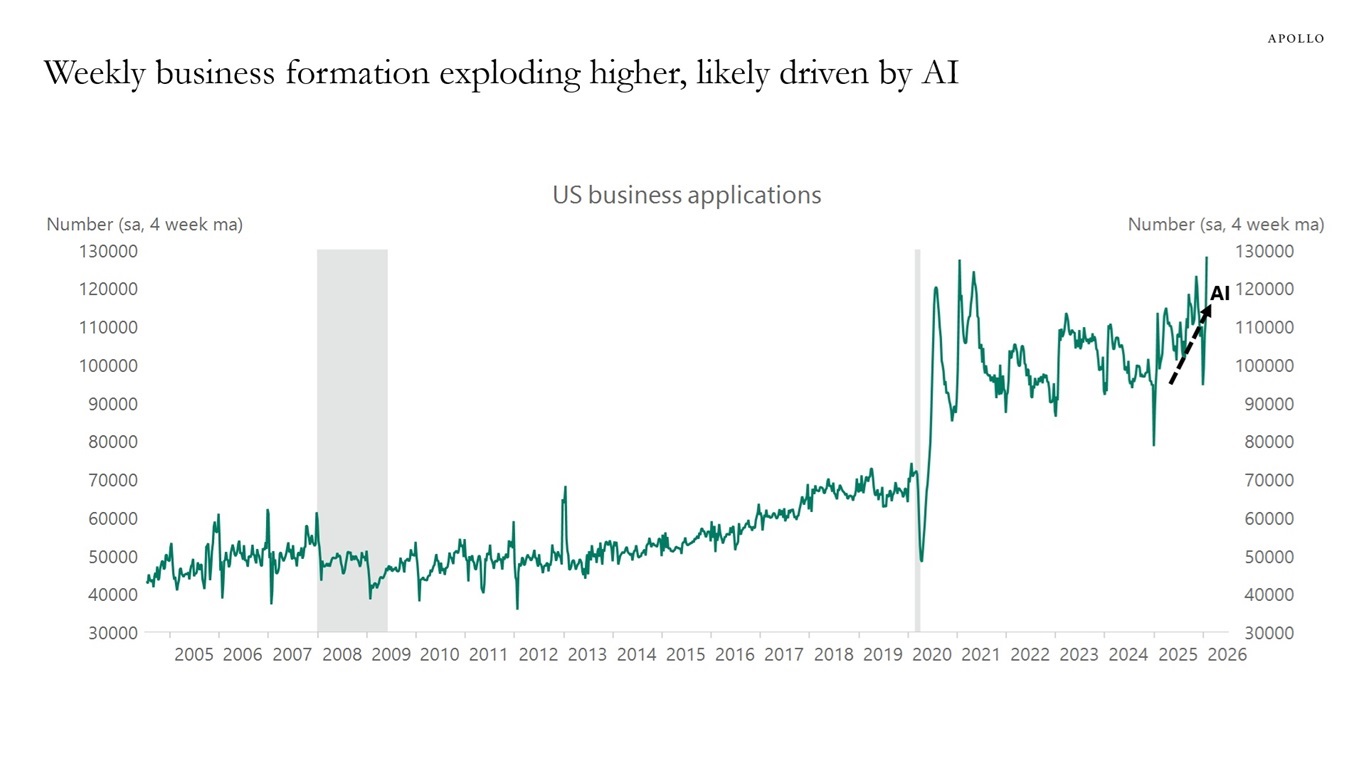
Sources: US Census Bureau, Macrobond, Apollo Chief Economist See important disclaimers at the bottom of the page.

This presentation may not be distributed, transmitted or otherwise communicated to others in whole or in part without the express consent of Apollo Global Management, Inc. (together with its subsidiaries, “Apollo”).
Apollo makes no representation or warranty, expressed or implied, with respect to the accuracy, reasonableness, or completeness of any of the statements made during this presentation, including, but not limited to, statements obtained from third parties. Opinions, estimates and projections constitute the current judgment of the speaker as of the date indicated. They do not necessarily reflect the views and opinions of Apollo and are subject to change at any time without notice. Apollo does not have any responsibility to update this presentation to account for such changes. There can be no assurance that any trends discussed during this presentation will continue.
Statements made throughout this presentation are not intended to provide, and should not be relied upon for, accounting, legal or tax advice and do not constitute an investment recommendation or investment advice. Investors should make an independent investigation of the information discussed during this presentation, including consulting their tax, legal, accounting or other advisors about such information. Apollo does not act for you and is not responsible for providing you with the protections afforded to its clients. This presentation does not constitute an offer to sell, or the solicitation of an offer to buy, any security, product or service, including interest in any investment product or fund or account managed or advised by Apollo.
Certain statements made throughout this presentation may be “forward-looking” in nature. Due to various risks and uncertainties, actual events or results may differ materially from those reflected or contemplated in such forward-looking information. As such, undue reliance should not be placed on such statements. Forward-looking statements may be identified by the use of terminology including, but not limited to, “may”, “will”, “should”, “expect”, “anticipate”, “target”, “project”, “estimate”, “intend”, “continue” or “believe” or the negatives thereof or other variations thereon or comparable terminology.