


Want it delivered daily to your inbox?
-
The inventory-to-sales ratio for retailers was 1.5 before the pandemic, and now it is 1.3, see chart below.
In other words, retailers will more quickly have empty shelves when goods no longer come in from China.

Sources: US Census Bureau, Apollo Chief Economist See important disclaimers at the bottom of the page.
-
The US is no longer importing cheap goods from China. As a result, the rest of the world will likely see a significant increase in imports of cheap Chinese goods that China can no longer sell in the US.
This creates a highly unusual macroeconomic situation, with upward pressure on inflation in the US and downward pressure on inflation in Europe, Canada, Australia, and Japan.
The consequence for markets is that rates will be higher in the US and lower in the rest of the world.

Source: Apollo Chief Economist See important disclaimers at the bottom of the page.
-
I will be giving a presentation on “The Growing Role of Private Credit” today at the Hoover Institution during a conference celebrating John Taylor and the Taylor role. My slides are available here, and all presentations and panels can be watched live here.
See important disclaimers at the bottom of the page.
-
The IMF just released their latest World Economic Outlook, and comparing their pre-tariff forecast from January with their forecast today shows that they expect the trade war to have a much bigger negative impact on the US economy than on other countries, including China, see chart below.

Sources: IMF, Apollo Chief Economist See important disclaimers at the bottom of the page.
-
The trade war is all about goods. However, the US is also connected with China via sales of American products in China to Chinese consumers.
For example, McDonald’s has 6,820 restaurants in China, Walmart operates 364 stores in China, and Apple sold 43 million iPhones in China in 2024.
Calculations from FactSet’s Geographic Revenue Exposure Database show that China makes up about 7% of total annual revenue in S&P 500 companies. Comparing the magnitude of the trade deficit with the revenue generated by S&P 500 companies in China shows that US companies made $1.2 trillion in revenue selling to Chinese consumers—about four times more than the size of the trade deficit in goods between China and the US, see chart below.
The bottom line is that if the US has to decouple completely from China, it would result in a significant decline in earnings for S&P 500 companies no longer selling products to Chinese consumers.
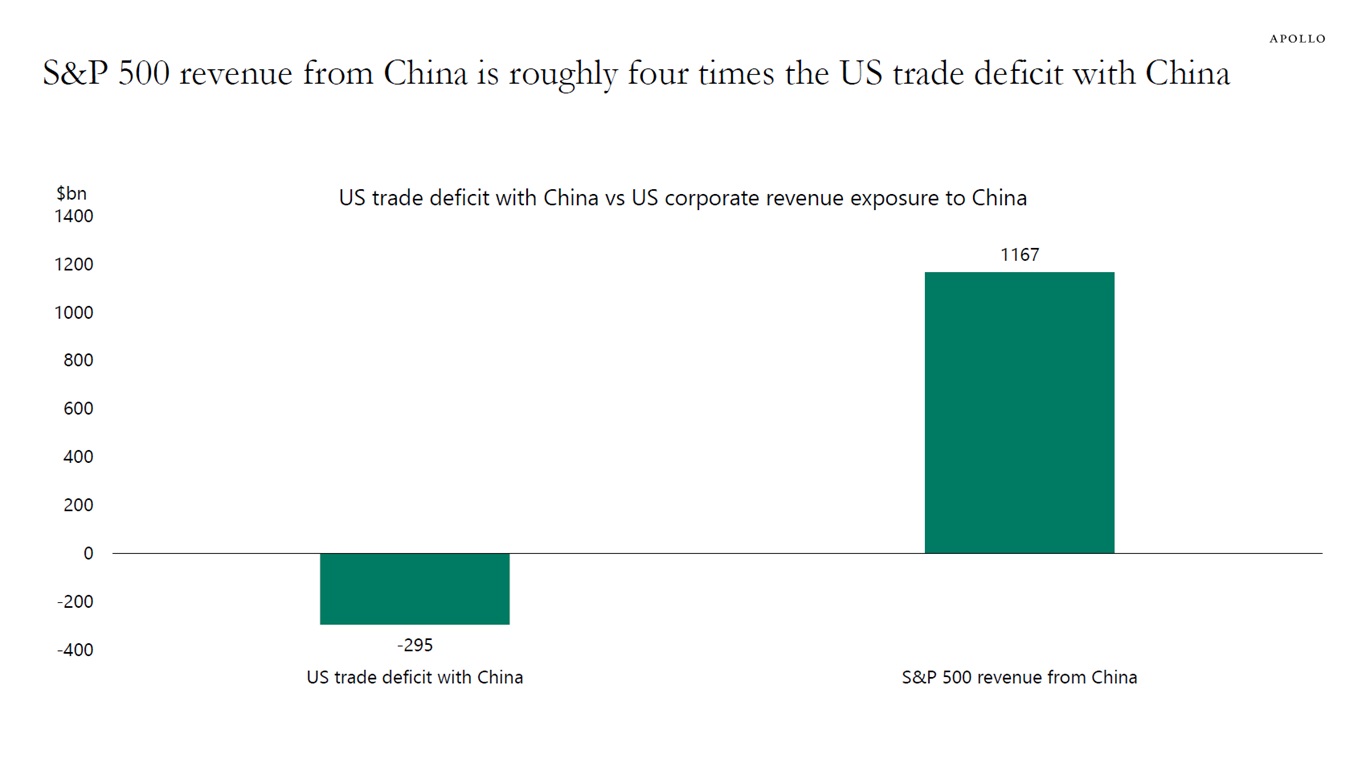
Note: S&P 500 revenue is calculated as revenue exposure to China (6.7%) multiplied by LTM total revenue. Sources: FactSet, BEA, Apollo Chief Economist See important disclaimers at the bottom of the page.
-
After Liberation Day on April 2, earnings expectations for the S&P 500 have been revised down significantly, and interest rate differentials no longer drive the dollar, see charts below.
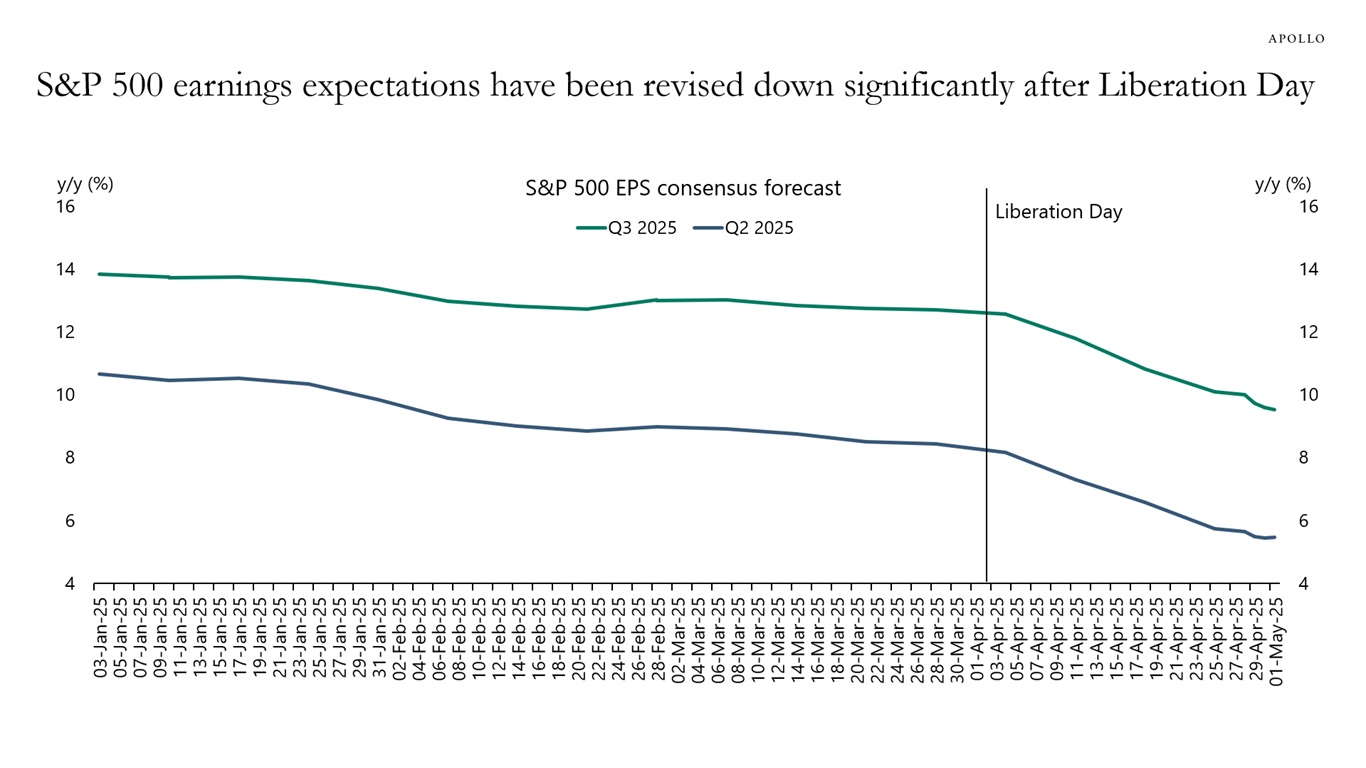
Sources: Bloomberg, Apollo Chief Economist 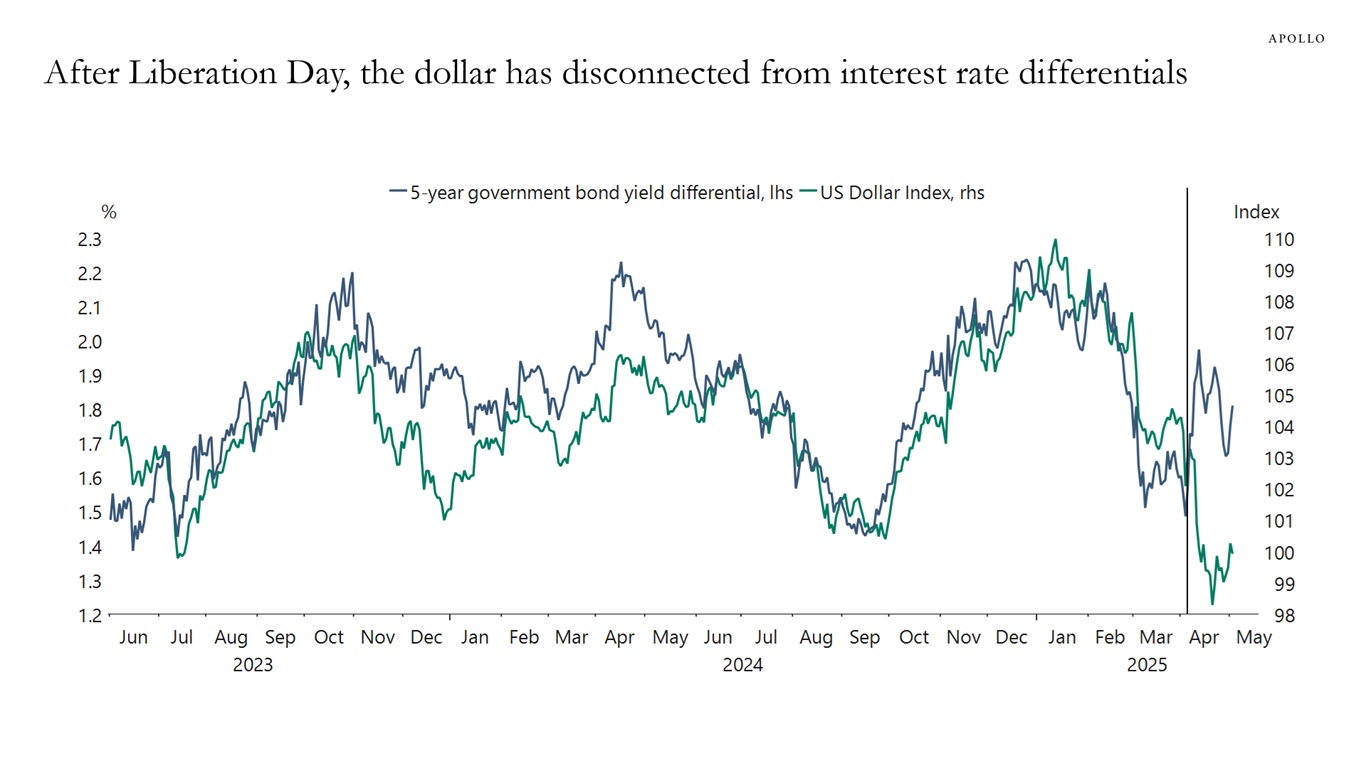
Note: Yield differential is DXY weighted. Sources: Bloomberg, Macrobond, Apollo Chief Economist See important disclaimers at the bottom of the page.
-
The Fed survey released this week shows how companies are responding to higher tariffs, and the first chart below shows that the top response is that companies are passing cost increases through to consumers.
The bottom line is that inflation will be rising significantly over the next six months, see also the second chart.
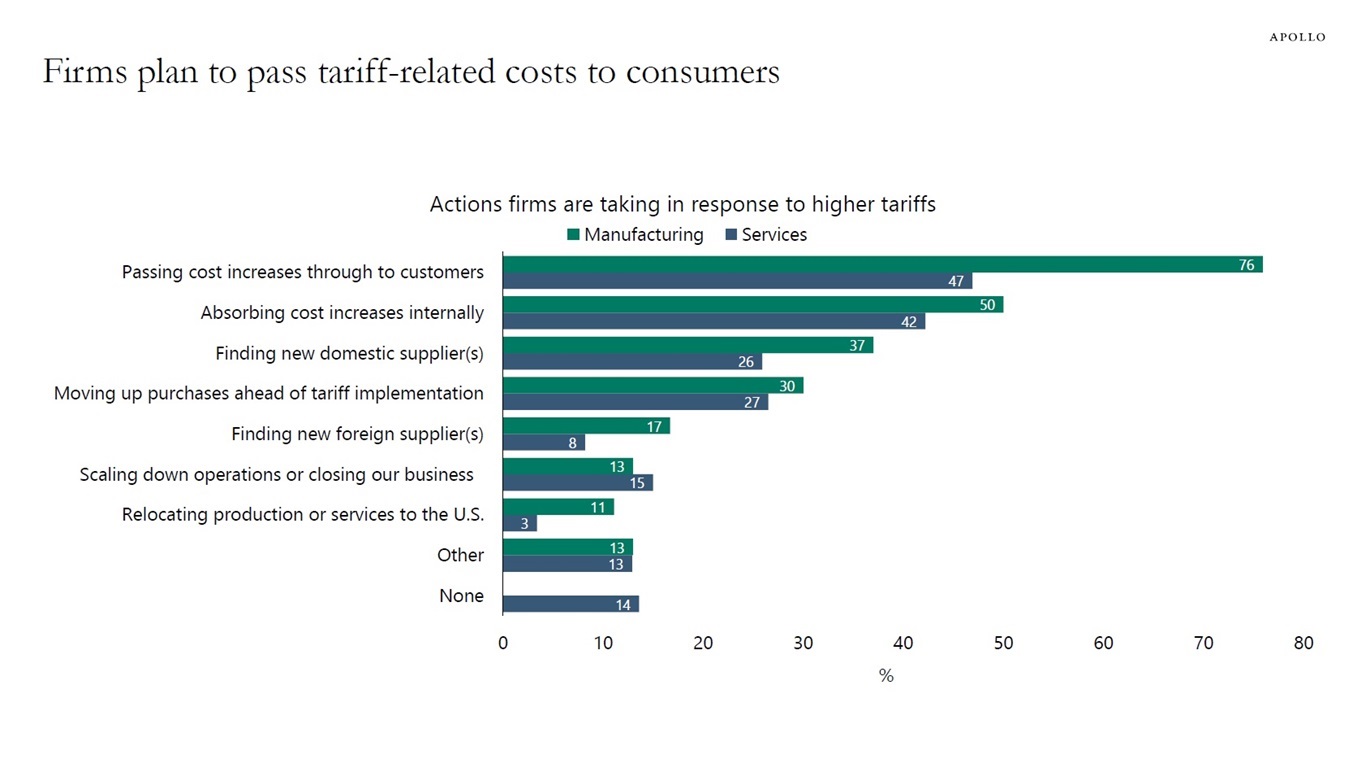
Sources: Federal Reserve Bank of Dallas, Apollo Chief Economist 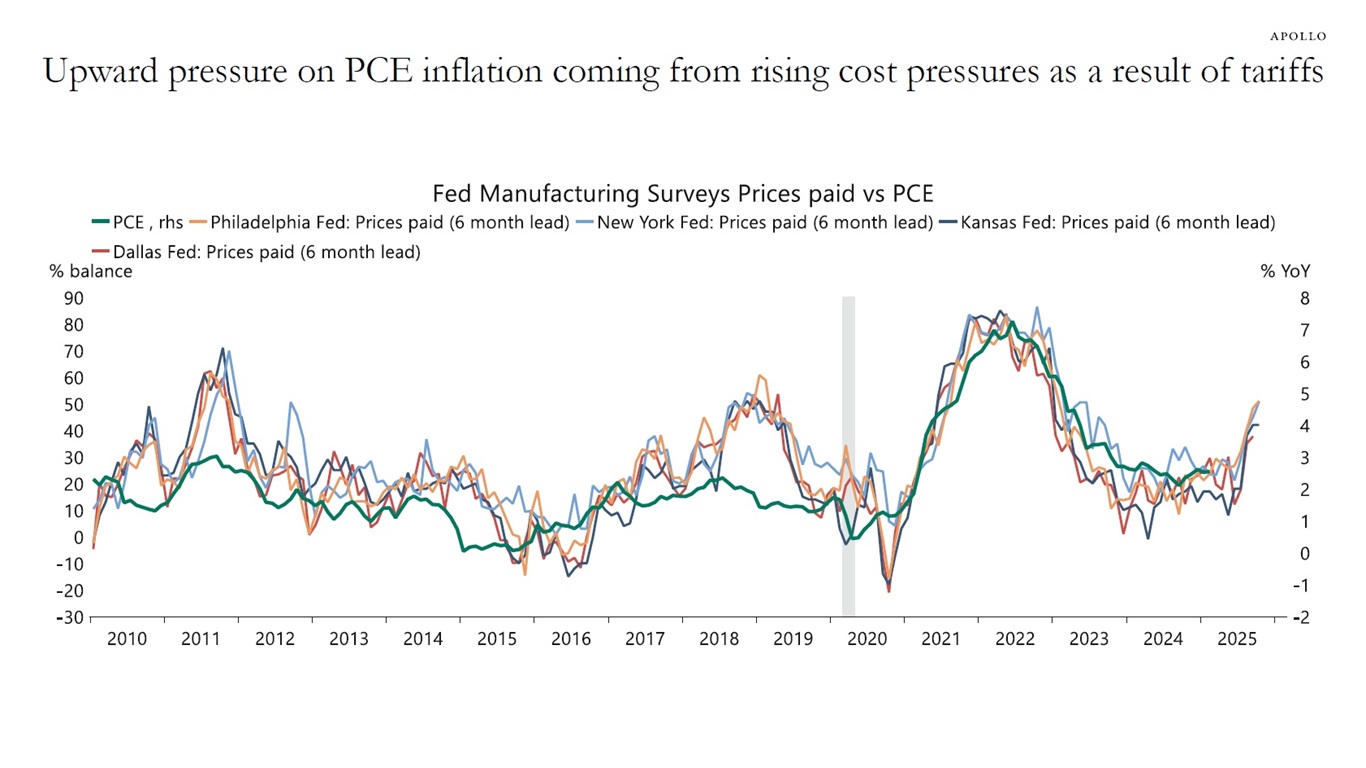
Sources: Federal Reserve Bank of Dallas, Federal Reserve Bank of Kansas City, Federal Reserve Bank of New York, Federal Reserve Bank of Philadelphia, US Bureau of Economic Analysis (BEA), Macrobond, Apollo Chief Economist See important disclaimers at the bottom of the page.
-
Estimates show that more than 90% of fireworks used in the United States are imported, and 95% of fireworks imported into the US come from China, see charts below.
Similarly, there are many different categories of products that are imported into the US where demand is inelastic, and China is the only provider of that product, see below.
The bottom line is that inflation will increase significantly for the product categories where China is the main producer of that good, likely including fireworks.
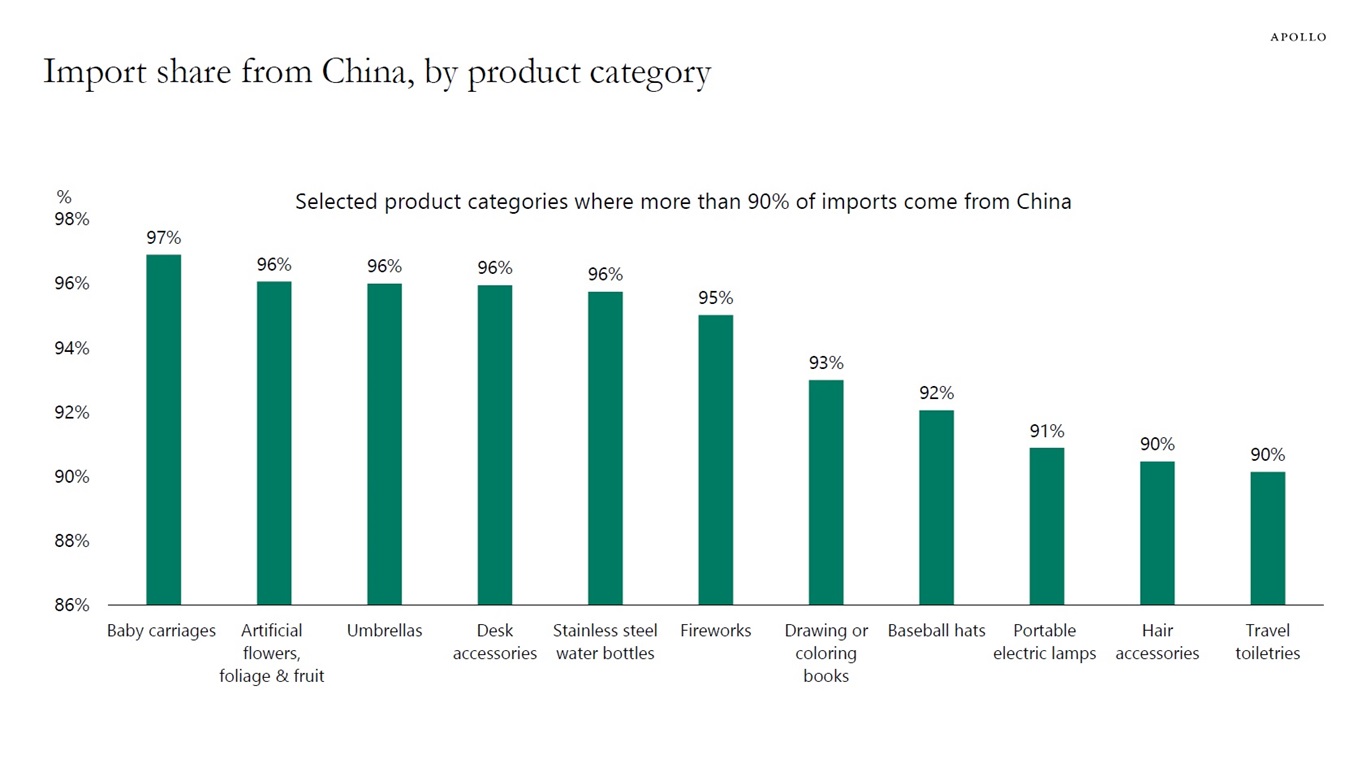
Sources: US Census Bureau, Apollo Chief Economist 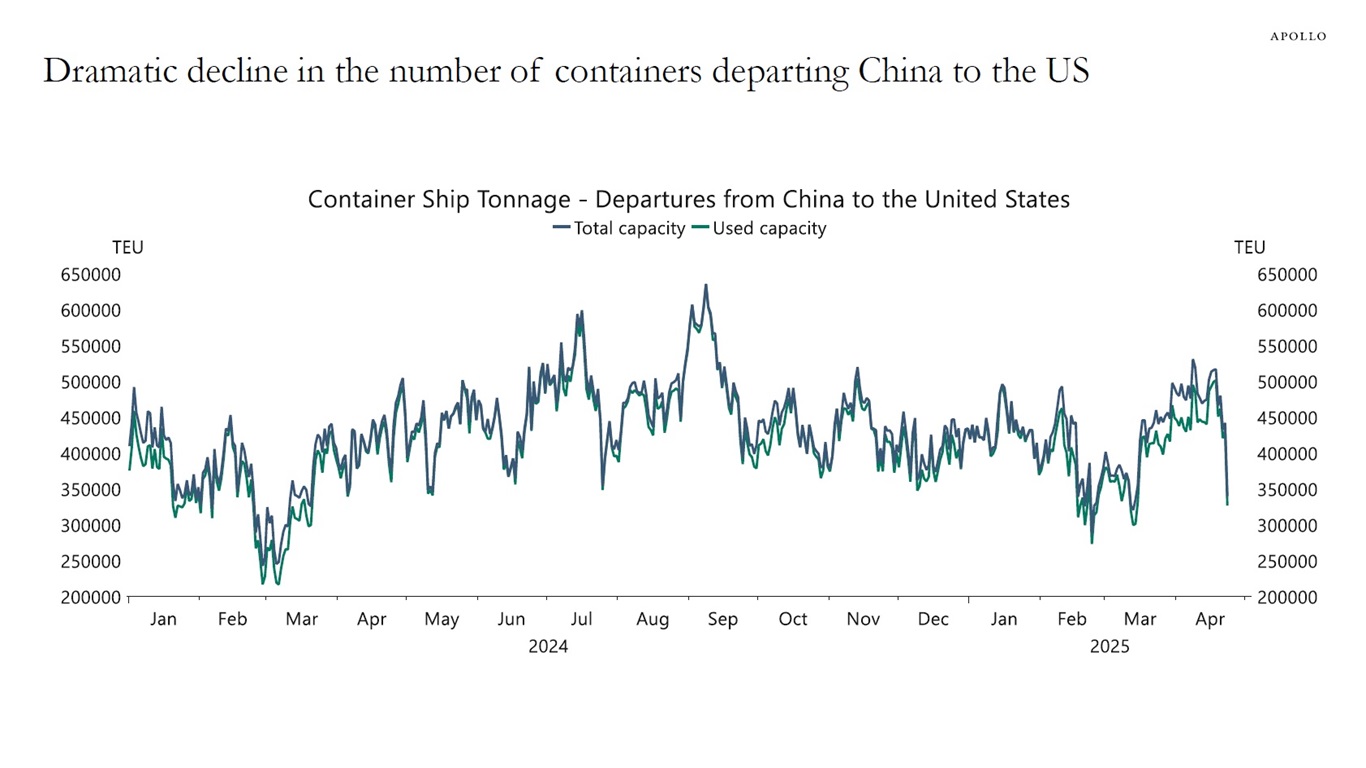
Note: Represents the aggregated container volume, measured in twenty-foot equivalent units (TEU), of vessels departing China for the United States over a 15-day rolling period. Accounts for the shipping capacity being utilized, irrespective of the number of vessels. Sources: Bloomberg, Macrobond, Apollo Chief Economist See important disclaimers at the bottom of the page.
-
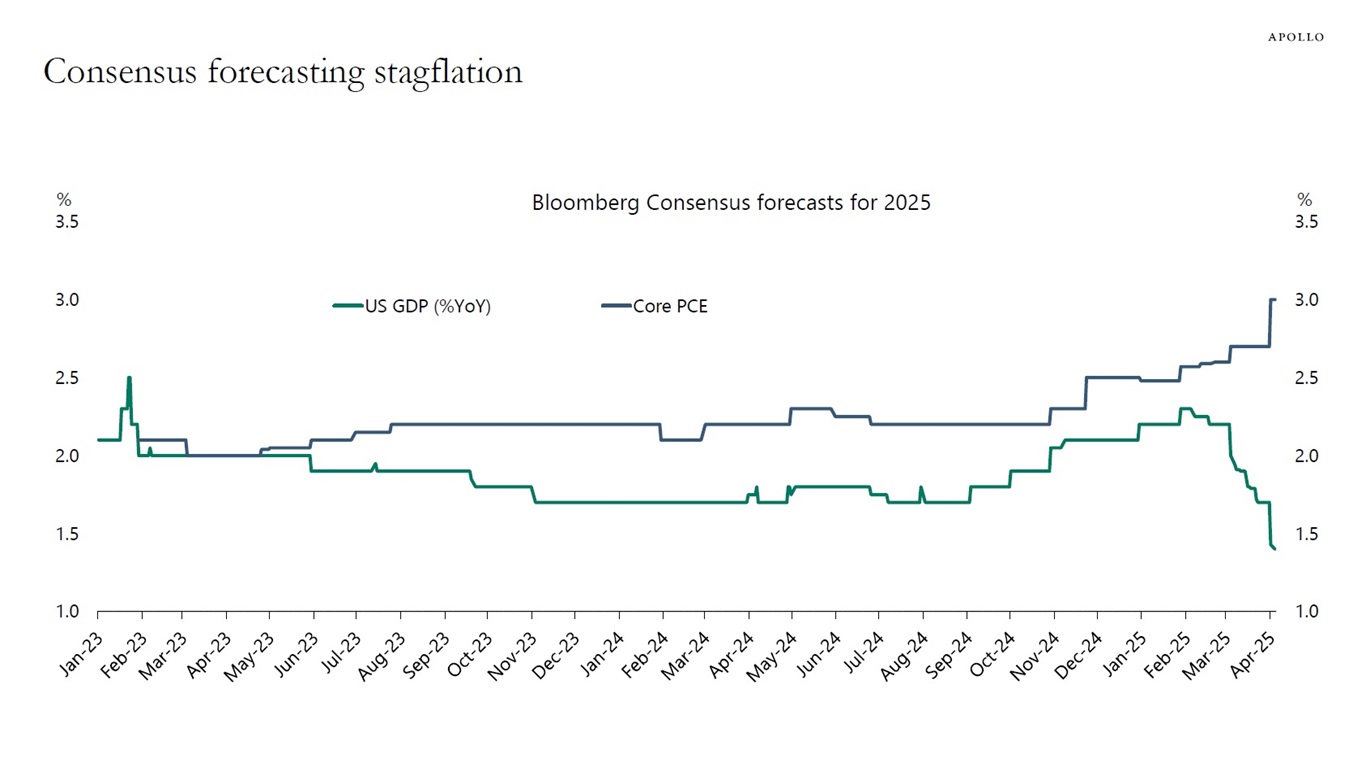
Since the trade war began in March, consensus expectations for growth have been revised down, and consensus expectations for inflation have been revised up, see the first chart below. This is the definition of stagflation: higher inflation and lower growth.
Under stagflation, with higher rates and slower growth, investors should stay away from growth equity and growth credit and be up in quality and invest in companies with earnings to protect against the downside risk of a recession, see the second chart.
This happens to also be how investors in public markets are positioned. Short interest in small-cap companies is at the highest level seen in many years, see the third chart. This is not surprising as 40% of companies in the Russell 2000 have negative earnings, and middle market and small-cap companies are hit by the triple whammy of higher tariffs, slower growth, and higher rates because of inflation staying higher for longer.
Sources: Bloomberg, Apollo Chief Economist 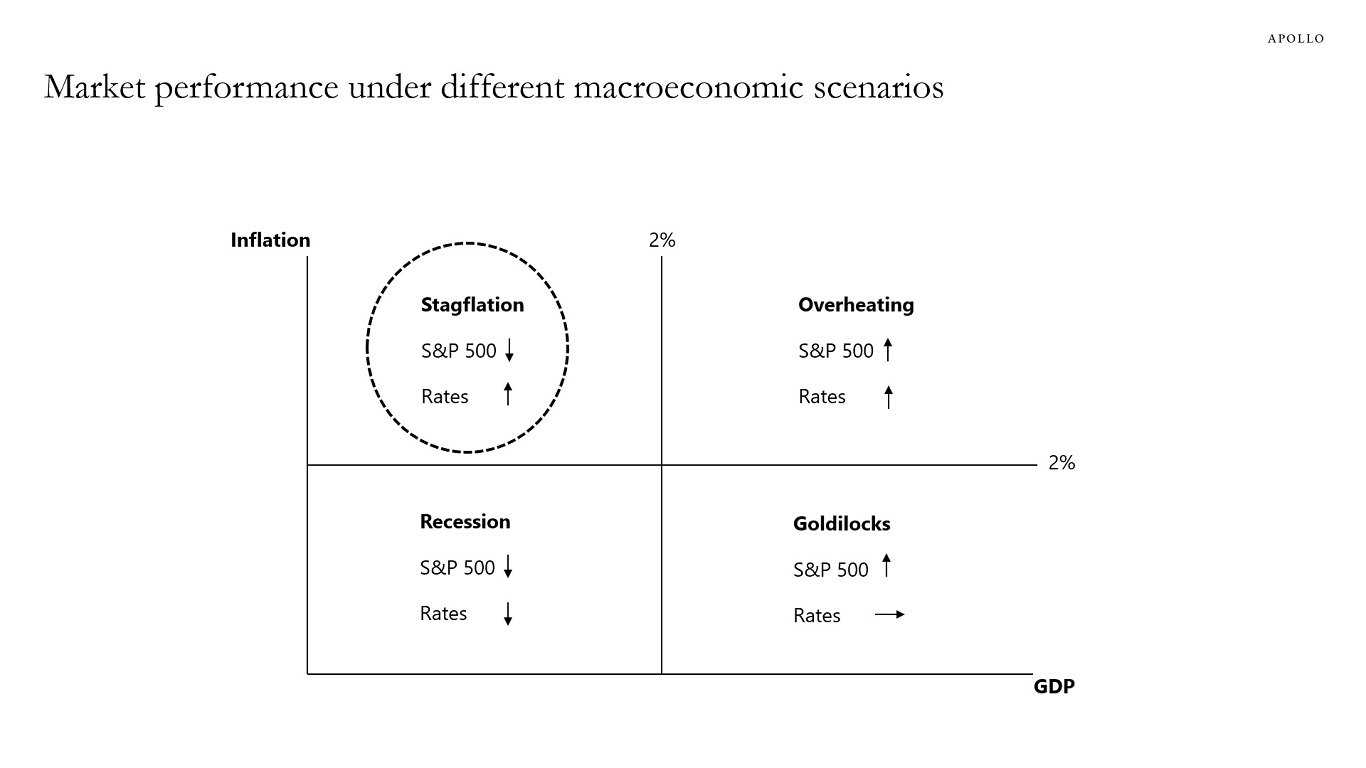
Source: Apollo Chief Economist 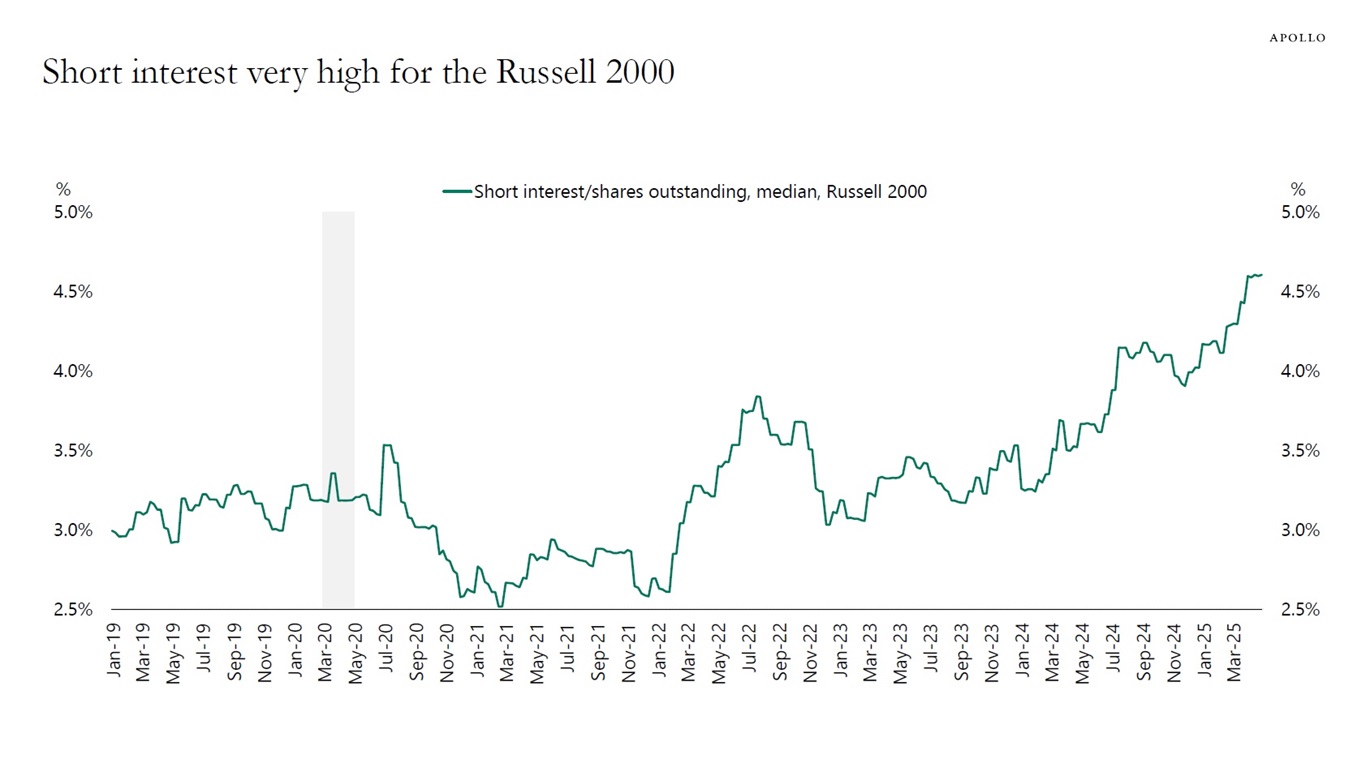
Sources: Bloomberg, Apollo Chief Economist See important disclaimers at the bottom of the page.
-
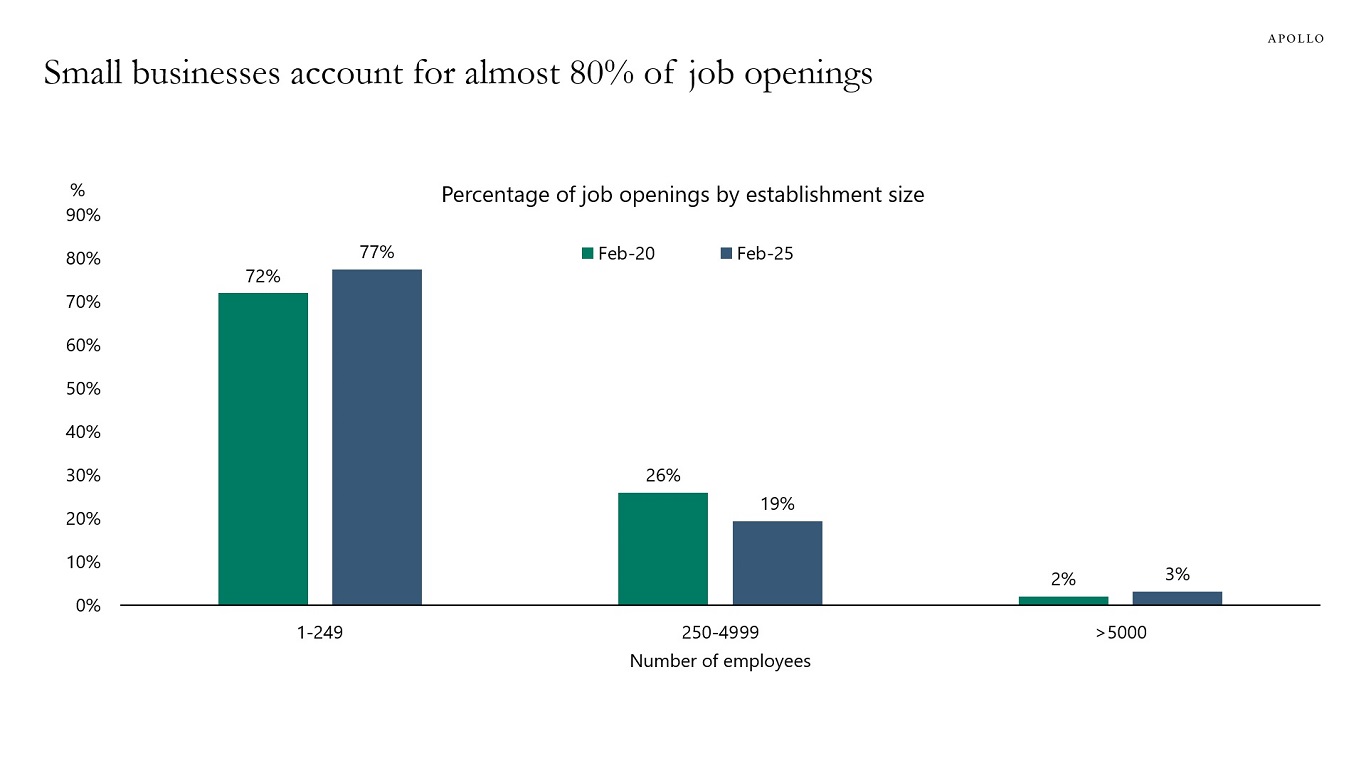
Almost 80% of job openings in the US economy are in businesses with less than 250 workers, and the share of job openings in small businesses has been growing over the past five years, see chart below.
Sources: JOLTS, BLS, Haver Analytics, Apollo Chief Economist See important disclaimers at the bottom of the page.

This presentation may not be distributed, transmitted or otherwise communicated to others in whole or in part without the express consent of Apollo Global Management, Inc. (together with its subsidiaries, “Apollo”).
Apollo makes no representation or warranty, expressed or implied, with respect to the accuracy, reasonableness, or completeness of any of the statements made during this presentation, including, but not limited to, statements obtained from third parties. Opinions, estimates and projections constitute the current judgment of the speaker as of the date indicated. They do not necessarily reflect the views and opinions of Apollo and are subject to change at any time without notice. Apollo does not have any responsibility to update this presentation to account for such changes. There can be no assurance that any trends discussed during this presentation will continue.
Statements made throughout this presentation are not intended to provide, and should not be relied upon for, accounting, legal or tax advice and do not constitute an investment recommendation or investment advice. Investors should make an independent investigation of the information discussed during this presentation, including consulting their tax, legal, accounting or other advisors about such information. Apollo does not act for you and is not responsible for providing you with the protections afforded to its clients. This presentation does not constitute an offer to sell, or the solicitation of an offer to buy, any security, product or service, including interest in any investment product or fund or account managed or advised by Apollo.
Certain statements made throughout this presentation may be “forward-looking” in nature. Due to various risks and uncertainties, actual events or results may differ materially from those reflected or contemplated in such forward-looking information. As such, undue reliance should not be placed on such statements. Forward-looking statements may be identified by the use of terminology including, but not limited to, “may”, “will”, “should”, “expect”, “anticipate”, “target”, “project”, “estimate”, “intend”, “continue” or “believe” or the negatives thereof or other variations thereon or comparable terminology.