• Apollo.com
  • Login
  • Register Now
light site-logo
  • The Academy
  • Upcoming Events
        • Upcoming Events

        • Hybrid Investments: Flexible Structures for Volatile TimesThursday, May 29, 2025 • 11:00AM ET
  • Learning Center
        • New & UpdatedAlternative Investing Course 2.0

        • Alternative Investing Essentials Part OnePrivate Equity, Venture Capital, Private Credit
        • Alternative Investing Essentials Part TwoReal Estate, Infrastructure, Digital Assets, Hedge Funds
        • Practical ConsiderationsAsset Allocation, Risk Considerations, Fund Structures, Fees
        • Introductory Videos

          View All Videos

        •  Recent Classes & Videos

        • • Private Credit Investing in Volatile Times
        • • Potential Implications of the Latest US Administration Policy Proposals
        • • Beyond 60/40: Private Assets in an Era of High Public Valuations
        • • Investment Grade Private Credit as a Core Fixed Income Allocation
        • • 2025 Economic Outlook: Firing on All Cylinders
        • • Building the Future: Understanding the Tailwinds Behind Infrastructure Investing
        • View All Classes

  • Alternative Perspectives
        • Investment Knowledge
        • The View from Apollo
          • Investment Knowledge White Papers

            Beyond 60/40: Private Assets in an Era of High Public Valuations

            March 21, 2025
          • The View From Apollo

            Private Credit Investing in Volatile Times

            May 9, 2025
          • Investment Knowledge

            Apollo Answers: What Is PIK?

            March 19, 2025
  • The Daily Spark
        • Read The Daily Spark Blog


        • Want it delivered daily to your inbox?
          • The Daily Spark

            The Negative Impact of Tariffs on Earnings

            May 22, 2025
          • The Daily Spark

            Significant Headwinds to Consumer Spending

            May 21, 2025
          • The Daily Spark

            10 Downside Risks to the US Economic Outlook

            May 20, 2025
  • Register for Apollo Academy: Alternative Investing Course
  • Login
  • About Apollo Academy
  • Upcoming Events
  • Learning Center
  • Alternative Perspectives
  • The Daily Spark
  • Register for Apollo Academy: Alternative Investing Course
  • Login
  • Private Credit Investing in Volatile Times
    Tuesday, April 29, 2025 • 11:00am ET
  • Alternative Investing Course 2.0
  • Potential Implications of the Latest US Administration Policy Proposals
  • Beyond 60/40: Private Assets in an Era of Soaring Public Valuations
  • Investment Grade Private Credit as a Core Fixed Income Allocation
  • 2025 Economic Outlook: Where’s the Slowdown?
  • Building the Future: Understanding the Tailwinds Behind Infrastructure Investing
  • Clean Transition Investing: Going Where the Opportunities Are
  • View All Classes
  • Introductory Videos
  • Alternative Investing Essentials Part One • Now Available On Demand
  • Alternative Investing Essentials Part Two • Now Available On Demand
  • Practical Considerations • Now Available On Demand
  • Investment Knowledge
  • The View from Apollo
Home January 2024

Upward Pressure on Goods Inflation

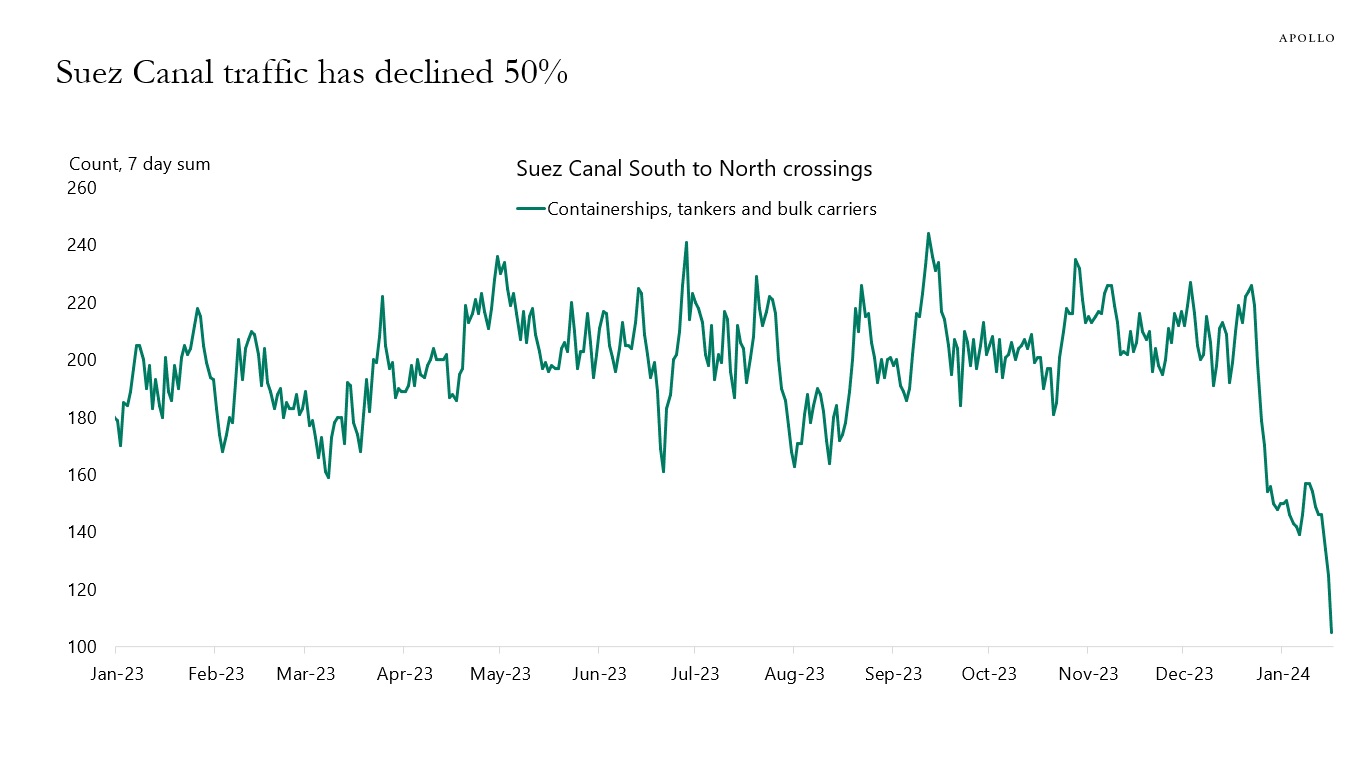
Normally, 200 ships travel through the Suez Canal from south to north over a week, but that number has recently declined to 100, see the first chart.

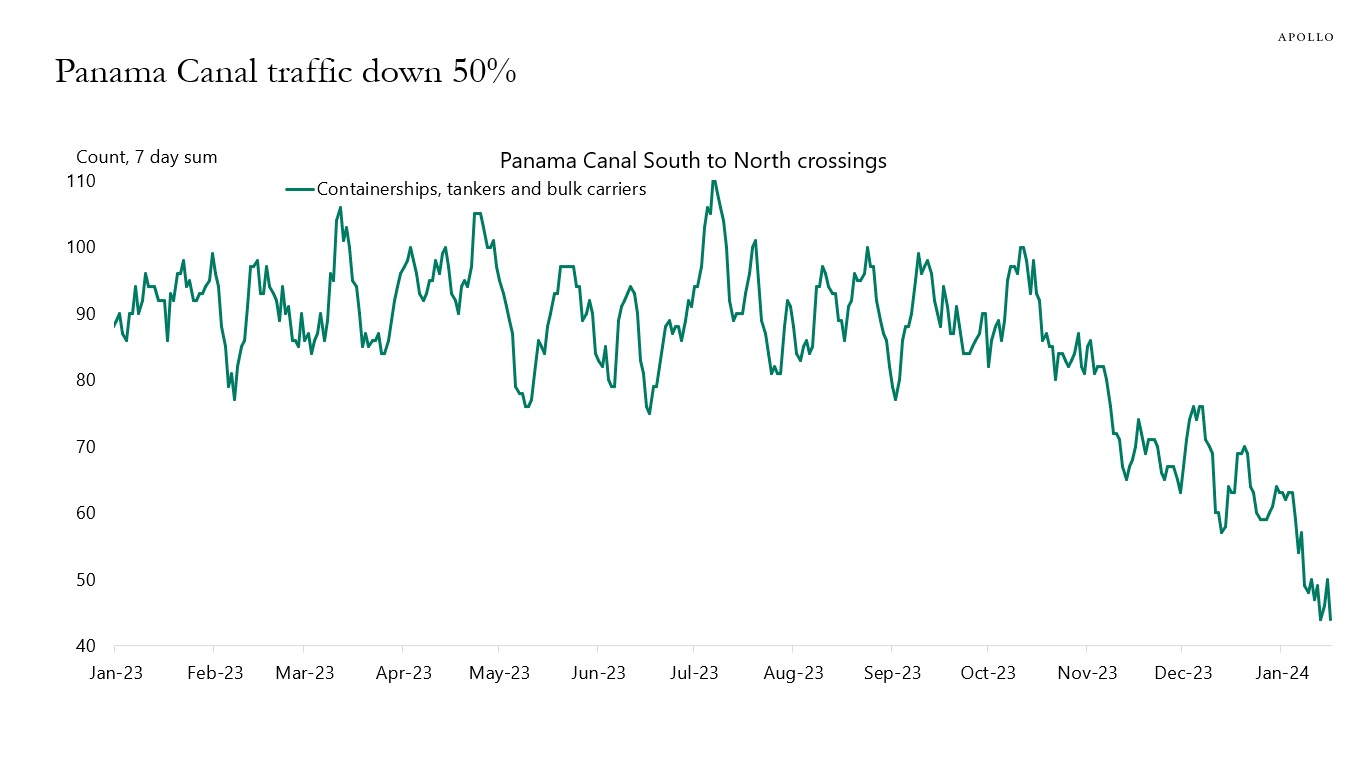
For the Panama Canal, northbound traffic has also declined 50%, from 90 ships per week to 45, see the second chart.

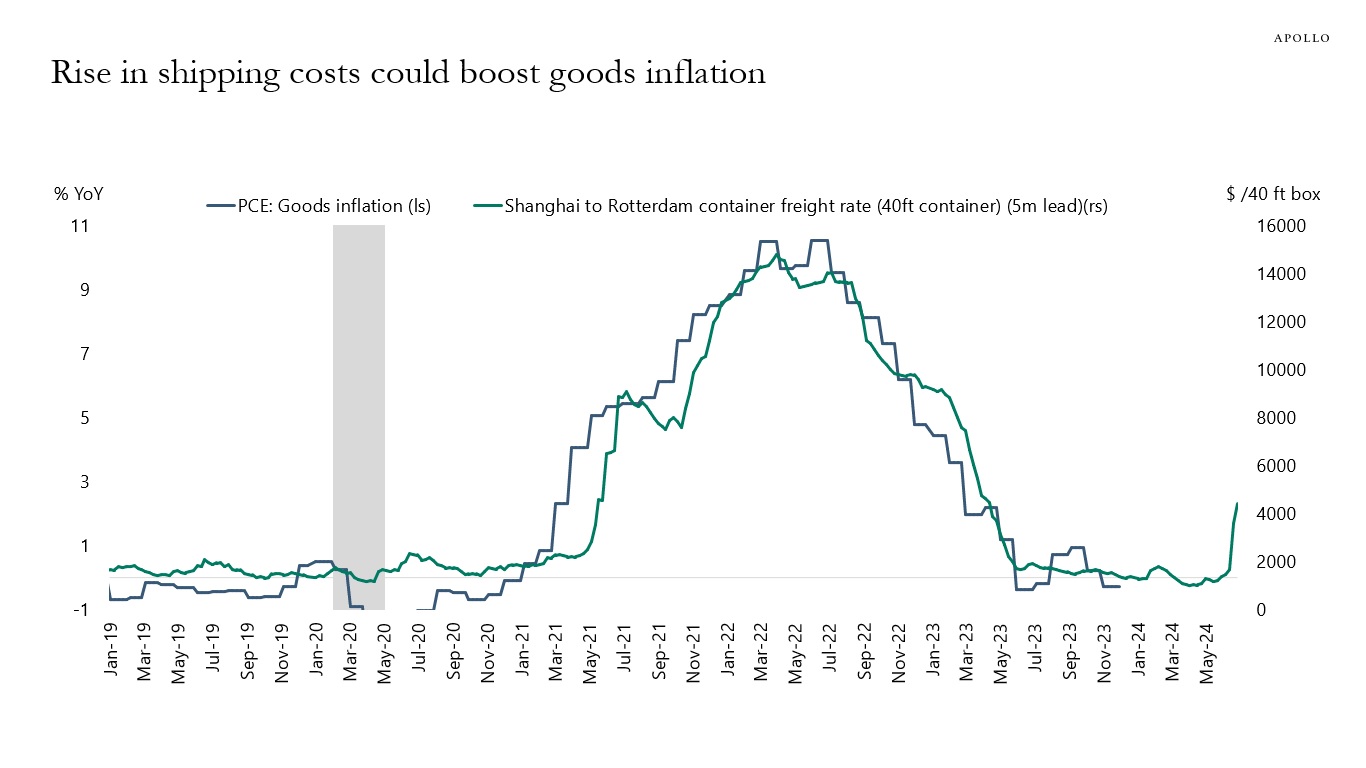
The third chart shows that the price of transporting a container from Shanghai to Rotterdam has tripled.

The bottom line is that higher transportation costs are putting upward pressure on goods inflation.

Suez Canal traffic has declined 50%
Source: Bloomberg, Apollo Chief Economist
Panama Canal traffic down 50%
Source: Bloomberg, Apollo Chief Economist
Rise in shipping costs could boost goods inflation
Source: BEA, Bloomberg, Apollo Chief Economist

Download high-res chart(s)

Recent Posts

  • The Negative Impact of Tariffs on Earnings
  • Significant Headwinds to Consumer Spending
  • 10 Downside Risks to the US Economic Outlook
  • Declining Foreign Participation in US Treasury 30-Year Auctions
  • The Coming Energy Transition

Recent Comments

No comments to show.

Archives

  • May 2025
  • April 2025
  • March 2025
  • February 2025
  • January 2025
  • December 2024
  • November 2024
  • October 2024
  • September 2024
  • August 2024
  • July 2024
  • June 2024
  • May 2024
  • April 2024
  • March 2024
  • February 2024
  • January 2024
  • December 2023
  • November 2023
  • October 2023
  • September 2023
  • August 2023
  • July 2023
  • June 2023
  • May 2023
  • April 2023
  • March 2023
  • February 2023
  • January 2023
  • December 2022
  • November 2022
  • October 2022
  • September 2022
  • August 2022
  • July 2022
  • June 2022
  • May 2022
  • April 2022
  • March 2022
  • February 2022
  • January 2022
  • December 2021
  • November 2021

Categories

  • Apollo Answers
  • Course Introductions
  • Economic Intelligence
  • Hide from Wordpress Search
  • Investment Knowledge
  • Perspectives
  • Redirecting
  • The Daily Spark
  • The View from Apollo
  • The Weekly Brief
  • Uncategorized
  • White Papers

Homebuyers Are Getting Older

The median age of repeat homebuyers has increased from 36 years old in 1980 to 58 years old in 2023, see chart below.

And the median age of first-time homebuyers has increased from 29 to 35 over the same period.

Homebuyers are getting older
Source: NAR, Apollo Chief Economist

Download hi-res chart(s)

Recent Posts

  • The Negative Impact of Tariffs on Earnings
  • Significant Headwinds to Consumer Spending
  • 10 Downside Risks to the US Economic Outlook
  • Declining Foreign Participation in US Treasury 30-Year Auctions
  • The Coming Energy Transition

Recent Comments

No comments to show.

Archives

  • May 2025
  • April 2025
  • March 2025
  • February 2025
  • January 2025
  • December 2024
  • November 2024
  • October 2024
  • September 2024
  • August 2024
  • July 2024
  • June 2024
  • May 2024
  • April 2024
  • March 2024
  • February 2024
  • January 2024
  • December 2023
  • November 2023
  • October 2023
  • September 2023
  • August 2023
  • July 2023
  • June 2023
  • May 2023
  • April 2023
  • March 2023
  • February 2023
  • January 2023
  • December 2022
  • November 2022
  • October 2022
  • September 2022
  • August 2022
  • July 2022
  • June 2022
  • May 2022
  • April 2022
  • March 2022
  • February 2022
  • January 2022
  • December 2021
  • November 2021

Categories

  • Apollo Answers
  • Course Introductions
  • Economic Intelligence
  • Hide from Wordpress Search
  • Investment Knowledge
  • Perspectives
  • Redirecting
  • The Daily Spark
  • The View from Apollo
  • The Weekly Brief
  • Uncategorized
  • White Papers

Fed Pivot Has Restarted the Hunt for Yield

The Fed pivot has restarted the hunt for yield, see chart below. The question for markets is whether the associated rebound in housing, hiring, and capital markets activity will trigger a rebound in inflation.

Fed pivot and Fed signaling lower rates is bringing back the hunt for yield
Source: Apollo Chief Economist

Download hi-res chart(s)

Recent Posts

  • The Negative Impact of Tariffs on Earnings
  • Significant Headwinds to Consumer Spending
  • 10 Downside Risks to the US Economic Outlook
  • Declining Foreign Participation in US Treasury 30-Year Auctions
  • The Coming Energy Transition

Recent Comments

No comments to show.

Archives

  • May 2025
  • April 2025
  • March 2025
  • February 2025
  • January 2025
  • December 2024
  • November 2024
  • October 2024
  • September 2024
  • August 2024
  • July 2024
  • June 2024
  • May 2024
  • April 2024
  • March 2024
  • February 2024
  • January 2024
  • December 2023
  • November 2023
  • October 2023
  • September 2023
  • August 2023
  • July 2023
  • June 2023
  • May 2023
  • April 2023
  • March 2023
  • February 2023
  • January 2023
  • December 2022
  • November 2022
  • October 2022
  • September 2022
  • August 2022
  • July 2022
  • June 2022
  • May 2022
  • April 2022
  • March 2022
  • February 2022
  • January 2022
  • December 2021
  • November 2021

Categories

  • Apollo Answers
  • Course Introductions
  • Economic Intelligence
  • Hide from Wordpress Search
  • Investment Knowledge
  • Perspectives
  • Redirecting
  • The Daily Spark
  • The View from Apollo
  • The Weekly Brief
  • Uncategorized
  • White Papers

Will 2024 Be a Repeat of 2023?

The story in markets in 2023 was that US growth expectations were first revised down and then revised up after the easing in financial conditions following SVB in March, see the first chart below.

With the significant easing in financial conditions since November, we are beginning to see the same pattern in 2024, see the second chart.

The performance has been different in Japan and Europe, where growth expectations have been steady in Japan and revised significantly lower in Europe.

In other words, the lack of a slowdown in 2023, which surprised the Fed, the consensus, and markets, was only a US story, and we are starting to see the same pattern play out again in 2024.

2023 consensus forecasts for US, EU, and Japan
Source: Bloomberg, Apollo Chief Economist
2024 consensus forecasts for US, EU, and Japan
Source: Bloomberg, Apollo Chief Economist

Download hi-res chart(s)

Recent Posts

  • The Negative Impact of Tariffs on Earnings
  • Significant Headwinds to Consumer Spending
  • 10 Downside Risks to the US Economic Outlook
  • Declining Foreign Participation in US Treasury 30-Year Auctions
  • The Coming Energy Transition

Recent Comments

No comments to show.

Archives

  • May 2025
  • April 2025
  • March 2025
  • February 2025
  • January 2025
  • December 2024
  • November 2024
  • October 2024
  • September 2024
  • August 2024
  • July 2024
  • June 2024
  • May 2024
  • April 2024
  • March 2024
  • February 2024
  • January 2024
  • December 2023
  • November 2023
  • October 2023
  • September 2023
  • August 2023
  • July 2023
  • June 2023
  • May 2023
  • April 2023
  • March 2023
  • February 2023
  • January 2023
  • December 2022
  • November 2022
  • October 2022
  • September 2022
  • August 2022
  • July 2022
  • June 2022
  • May 2022
  • April 2022
  • March 2022
  • February 2022
  • January 2022
  • December 2021
  • November 2021

Categories

  • Apollo Answers
  • Course Introductions
  • Economic Intelligence
  • Hide from Wordpress Search
  • Investment Knowledge
  • Perspectives
  • Redirecting
  • The Daily Spark
  • The View from Apollo
  • The Weekly Brief
  • Uncategorized
  • White Papers

Pivot Party Supporting Credit

The rally in rates and credit after the Fed pivot has pushed up the share of single-B and BB loans priced above par, see chart below.

Loans priced at par and above, by rating
Source: Pitchbook LCD, Apollo Chief Economist

Download hi-res chart(s)

Recent Posts

  • The Negative Impact of Tariffs on Earnings
  • Significant Headwinds to Consumer Spending
  • 10 Downside Risks to the US Economic Outlook
  • Declining Foreign Participation in US Treasury 30-Year Auctions
  • The Coming Energy Transition

Recent Comments

No comments to show.

Archives

  • May 2025
  • April 2025
  • March 2025
  • February 2025
  • January 2025
  • December 2024
  • November 2024
  • October 2024
  • September 2024
  • August 2024
  • July 2024
  • June 2024
  • May 2024
  • April 2024
  • March 2024
  • February 2024
  • January 2024
  • December 2023
  • November 2023
  • October 2023
  • September 2023
  • August 2023
  • July 2023
  • June 2023
  • May 2023
  • April 2023
  • March 2023
  • February 2023
  • January 2023
  • December 2022
  • November 2022
  • October 2022
  • September 2022
  • August 2022
  • July 2022
  • June 2022
  • May 2022
  • April 2022
  • March 2022
  • February 2022
  • January 2022
  • December 2021
  • November 2021

Categories

  • Apollo Answers
  • Course Introductions
  • Economic Intelligence
  • Hide from Wordpress Search
  • Investment Knowledge
  • Perspectives
  • Redirecting
  • The Daily Spark
  • The View from Apollo
  • The Weekly Brief
  • Uncategorized
  • White Papers

Pivot Party Continues

The ongoing easing of financial conditions continues to point to a reacceleration in growth over the coming months, see chart below.

Easier financial conditions point to a rebound in GDP growth
Source: BEA, Bloomberg, Apollo Chief Economist

Download hi-res chart(s)

Recent Posts

  • The Negative Impact of Tariffs on Earnings
  • Significant Headwinds to Consumer Spending
  • 10 Downside Risks to the US Economic Outlook
  • Declining Foreign Participation in US Treasury 30-Year Auctions
  • The Coming Energy Transition

Recent Comments

No comments to show.

Archives

  • May 2025
  • April 2025
  • March 2025
  • February 2025
  • January 2025
  • December 2024
  • November 2024
  • October 2024
  • September 2024
  • August 2024
  • July 2024
  • June 2024
  • May 2024
  • April 2024
  • March 2024
  • February 2024
  • January 2024
  • December 2023
  • November 2023
  • October 2023
  • September 2023
  • August 2023
  • July 2023
  • June 2023
  • May 2023
  • April 2023
  • March 2023
  • February 2023
  • January 2023
  • December 2022
  • November 2022
  • October 2022
  • September 2022
  • August 2022
  • July 2022
  • June 2022
  • May 2022
  • April 2022
  • March 2022
  • February 2022
  • January 2022
  • December 2021
  • November 2021

Categories

  • Apollo Answers
  • Course Introductions
  • Economic Intelligence
  • Hide from Wordpress Search
  • Investment Knowledge
  • Perspectives
  • Redirecting
  • The Daily Spark
  • The View from Apollo
  • The Weekly Brief
  • Uncategorized
  • White Papers

S&P 500 Very Expensive Relative to International Equities

Comparing the P/E ratio of the S&P 500 with the P/E ratio of the rest of the world shows a record difference, see chart below.

In other words, US equities have never been more expensive relative to international equities.

S&P 500 is very expensive compared to international stocks
Source: Bloomberg, Apollo Chief Economist (Note: BEst PE ratio using 12-month forward earnings; BEst = Bloomberg estimates)

Download hi-res chart(s)

Recent Posts

  • The Negative Impact of Tariffs on Earnings
  • Significant Headwinds to Consumer Spending
  • 10 Downside Risks to the US Economic Outlook
  • Declining Foreign Participation in US Treasury 30-Year Auctions
  • The Coming Energy Transition

Recent Comments

No comments to show.

Archives

  • May 2025
  • April 2025
  • March 2025
  • February 2025
  • January 2025
  • December 2024
  • November 2024
  • October 2024
  • September 2024
  • August 2024
  • July 2024
  • June 2024
  • May 2024
  • April 2024
  • March 2024
  • February 2024
  • January 2024
  • December 2023
  • November 2023
  • October 2023
  • September 2023
  • August 2023
  • July 2023
  • June 2023
  • May 2023
  • April 2023
  • March 2023
  • February 2023
  • January 2023
  • December 2022
  • November 2022
  • October 2022
  • September 2022
  • August 2022
  • July 2022
  • June 2022
  • May 2022
  • April 2022
  • March 2022
  • February 2022
  • January 2022
  • December 2021
  • November 2021

Categories

  • Apollo Answers
  • Course Introductions
  • Economic Intelligence
  • Hide from Wordpress Search
  • Investment Knowledge
  • Perspectives
  • Redirecting
  • The Daily Spark
  • The View from Apollo
  • The Weekly Brief
  • Uncategorized
  • White Papers

$6 Trillion on the Sidelines in Money Market Funds

Since the Fed started raising rates in March 2022, the amount of money in money market funds has increased from $4.5 trillion to $6 trillion, see chart below.

With the Fed cutting rates over the coming quarters, we will likely see some of the $6 trillion leave overnight risk-free fixed income and flow into other asset classes such as equities, credit, and duration.

The record-high $6 trillion in money market accounts is likely a tailwind to equities, credit, and rates, and ultimately the economy—in particular hiring, housing, and inflation.

There is a record-high $6 trillion on the sidelines in money market funds
Source: Bloomberg, Apollo Chief Economist

Download hi-res chart(s)

Recent Posts

  • The Negative Impact of Tariffs on Earnings
  • Significant Headwinds to Consumer Spending
  • 10 Downside Risks to the US Economic Outlook
  • Declining Foreign Participation in US Treasury 30-Year Auctions
  • The Coming Energy Transition

Recent Comments

No comments to show.

Archives

  • May 2025
  • April 2025
  • March 2025
  • February 2025
  • January 2025
  • December 2024
  • November 2024
  • October 2024
  • September 2024
  • August 2024
  • July 2024
  • June 2024
  • May 2024
  • April 2024
  • March 2024
  • February 2024
  • January 2024
  • December 2023
  • November 2023
  • October 2023
  • September 2023
  • August 2023
  • July 2023
  • June 2023
  • May 2023
  • April 2023
  • March 2023
  • February 2023
  • January 2023
  • December 2022
  • November 2022
  • October 2022
  • September 2022
  • August 2022
  • July 2022
  • June 2022
  • May 2022
  • April 2022
  • March 2022
  • February 2022
  • January 2022
  • December 2021
  • November 2021

Categories

  • Apollo Answers
  • Course Introductions
  • Economic Intelligence
  • Hide from Wordpress Search
  • Investment Knowledge
  • Perspectives
  • Redirecting
  • The Daily Spark
  • The View from Apollo
  • The Weekly Brief
  • Uncategorized
  • White Papers

Why Is the Labor Market so Tight?

Foreign-born employment in the US is back at the pre-pandemic trend, and native-born employment is still 6 million jobs below the pre-pandemic trend, see the first two charts below. 

In other words, the post-Covid normalization in the labor force participation rate has mainly been driven by immigration.

At the same time, the number of retired individuals has remained on trend, see the third chart.

The bottom line is that even taking into account that about 1 million died from Covid, there are still around 5 million native-born workers missing.

These 5 million missing workers are the reason why the labor market is tight and why wage inflation is likely to remain elevated.

Put differently, there is still plenty of room for job growth.

Foreign-born employment back at pre-pandemic trend
Source: BLS, Haver Analytics, Apollo Chief Economist
Native-born employment 6 million jobs below pre-pandemic trend
Source: BLS, Haver Analytics, Apollo Chief Economist
US retired population relative to trend
Source: Kansas City Fed, CPS IPUMS, Haver Analytics, Apollo Chief Economist

Download high-res chart(s)

Recent Posts

  • The Negative Impact of Tariffs on Earnings
  • Significant Headwinds to Consumer Spending
  • 10 Downside Risks to the US Economic Outlook
  • Declining Foreign Participation in US Treasury 30-Year Auctions
  • The Coming Energy Transition

Recent Comments

No comments to show.

Archives

  • May 2025
  • April 2025
  • March 2025
  • February 2025
  • January 2025
  • December 2024
  • November 2024
  • October 2024
  • September 2024
  • August 2024
  • July 2024
  • June 2024
  • May 2024
  • April 2024
  • March 2024
  • February 2024
  • January 2024
  • December 2023
  • November 2023
  • October 2023
  • September 2023
  • August 2023
  • July 2023
  • June 2023
  • May 2023
  • April 2023
  • March 2023
  • February 2023
  • January 2023
  • December 2022
  • November 2022
  • October 2022
  • September 2022
  • August 2022
  • July 2022
  • June 2022
  • May 2022
  • April 2022
  • March 2022
  • February 2022
  • January 2022
  • December 2021
  • November 2021

Categories

  • Apollo Answers
  • Course Introductions
  • Economic Intelligence
  • Hide from Wordpress Search
  • Investment Knowledge
  • Perspectives
  • Redirecting
  • The Daily Spark
  • The View from Apollo
  • The Weekly Brief
  • Uncategorized
  • White Papers

Soft Landing in Goods. No Landing in Services.

Looking at job growth since the Fed began to hike raises questions about whether the labor market is undergoing a soft landing or reacceleration, see the first chart below.

The split between the goods sector and the private service sector shows what looks like a soft landing in the goods sector and a reacceleration in the private service sector, see the second and third charts.

The no landing in services is consistent with ongoing strong demand for airlines, hotels, restaurants, concerts, and sporting events.

With the service sector making up 72% of total employment and generally less sensitive to Fed hikes, and with jobless claims still at very low levels, the upside risks to employment over the coming months are significant.

Labor market: Soft landing or reacceleration?
Source: BLS, Haver Analytics, Apollo Chief Economist
Soft landing in goods employment
Source: BLS, Haver Analytics, Apollo Chief Economist
Reacceleration in private service sector employment
Source: BLS, Haver Analytics, Apollo Chief Economist

Download high-res chart(s)

Recent Posts

  • The Negative Impact of Tariffs on Earnings
  • Significant Headwinds to Consumer Spending
  • 10 Downside Risks to the US Economic Outlook
  • Declining Foreign Participation in US Treasury 30-Year Auctions
  • The Coming Energy Transition

Recent Comments

No comments to show.

Archives

  • May 2025
  • April 2025
  • March 2025
  • February 2025
  • January 2025
  • December 2024
  • November 2024
  • October 2024
  • September 2024
  • August 2024
  • July 2024
  • June 2024
  • May 2024
  • April 2024
  • March 2024
  • February 2024
  • January 2024
  • December 2023
  • November 2023
  • October 2023
  • September 2023
  • August 2023
  • July 2023
  • June 2023
  • May 2023
  • April 2023
  • March 2023
  • February 2023
  • January 2023
  • December 2022
  • November 2022
  • October 2022
  • September 2022
  • August 2022
  • July 2022
  • June 2022
  • May 2022
  • April 2022
  • March 2022
  • February 2022
  • January 2022
  • December 2021
  • November 2021

Categories

  • Apollo Answers
  • Course Introductions
  • Economic Intelligence
  • Hide from Wordpress Search
  • Investment Knowledge
  • Perspectives
  • Redirecting
  • The Daily Spark
  • The View from Apollo
  • The Weekly Brief
  • Uncategorized
  • White Papers

Posts navigation

←Previous page Page 1 Page 2 Page 3 Page 4 Next page→
  • Privacy Notice
  • Terms of Use
  • Forward-Looking Statements
Apollo
© Apollo Global Management, Inc. All Rights Reserved.

The Apollo Academy is for informational and educational purposes only and nothing contained herein should be taken as investment advice or a recommendation to enter into any transaction. They are not an invitation by or on behalf of Apollo to any person to buy or sell any security or to adopt any investment strategy, and shall not form the basis of, nor may it accompany nor form part of, any right or contract to buy or sell any security or to adopt any investment strategy. There is no guarantee that the views and opinions expressed in this website will come to pass. For additional information, please see the disclaimers included in each piece of content or the legal page of our website here.