• Apollo.com
  • Login
  • Register Now
light site-logo
  • The Academy
  • Upcoming Events
        • Upcoming Events

        • Mid-Year Outlook: At the Crossroads of Stagflation — What’s Next?Tuesday, June 24, 2025 • 11:00am ET
  • Learning Center
        • New & UpdatedAlternative Investing Course 2.0

        • Alternative Investing Essentials Part OnePrivate Equity, Venture Capital, Private Credit
        • Alternative Investing Essentials Part TwoReal Estate, Infrastructure, Digital Assets, Hedge Funds
        • Practical ConsiderationsAsset Allocation, Risk Considerations, Fund Structures, Fees
        • Introductory Videos

          View All Videos

        •  Recent Classes & Videos

        • • Hybrid Investments: Flexible Structures for Volatile Times
        • • Private Credit Investing in Volatile Times
        • • Potential Implications of the Latest US Administration Policy Proposals
        • • Beyond 60/40: Private Assets in an Era of High Public Valuations
        • • Investment Grade Private Credit as a Core Fixed Income Allocation
        • • 2025 Economic Outlook: Firing on All Cylinders
        • View All Classes

  • Alternative Perspectives
        • Investment Knowledge
        • The View from Apollo
          • Investment Knowledge White Papers

            The Continental Shift: Europe’s Private Credit Moment

            June 20, 2025
          • The View From Apollo

            Credit Investing Amid Post “Liberation Day” Uncertainty

            May 10, 2025
          • Investment Knowledge White Papers

            Private Credit Investing in Volatile Times

            May 28, 2025
  • The Daily Spark
        • Read The Daily Spark Blog


        • Want it delivered daily to your inbox?
          • The Daily Spark

            Has Trump Outsmarted Everyone on Tariffs?

            June 21, 2025
          • The Daily Spark

            CPI Data Quality Declining

            June 20, 2025
          • The Daily Spark

            Fixed Income Replacement as a Generator of Alpha

            June 19, 2025
  • Register for Apollo Academy: Alternative Investing Course
  • Login
  • About Apollo Academy
  • Upcoming Events
  • Learning Center
  • Alternative Perspectives
  • The Daily Spark
  • Register for Apollo Academy: Alternative Investing Course
  • Login
  • Alternative Investing Course 2.0
  • Hybrid Investments: Flexible Structures for Volatile Times
  • Private Credit Investing in Volatile Times
  • Potential Implications of the Latest US Administration Policy Proposals
  • Beyond 60/40: Private Assets in an Era of High Public Valuations
  • Investment Grade Private Credit as a Core Fixed Income Allocation
  • 2025 Economic Outlook: Where’s the Slowdown?
  • View All Classes
  • Introductory Videos
  • Alternative Investing Essentials Part One • Now Available On Demand
  • Alternative Investing Essentials Part Two • Now Available On Demand
  • Practical Considerations • Now Available On Demand
  • Investment Knowledge
  • The View from Apollo
Home May 2024

A Puzzle in Markets

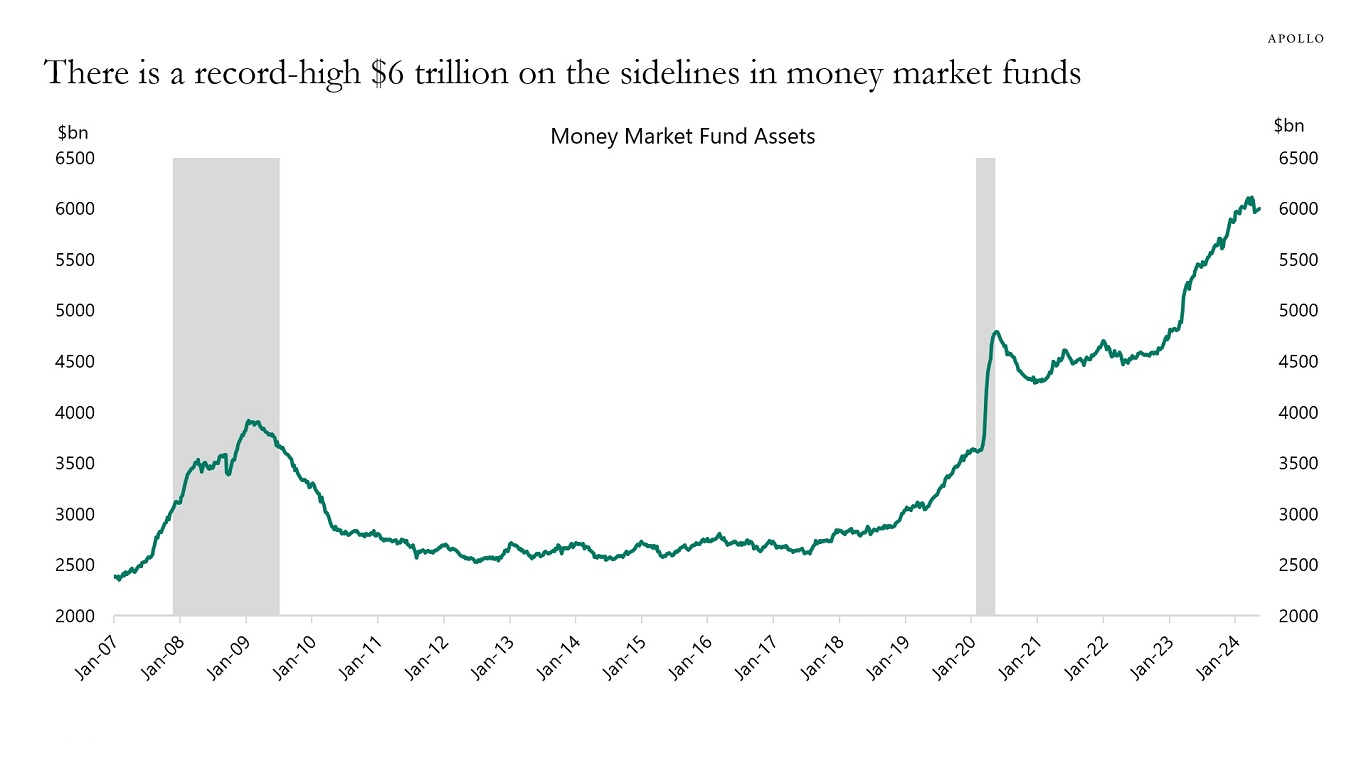
There is a puzzle in financial markets at the moment. How can the amount of money in money market accounts go up while the stock market goes up at the same time?

The finance textbook would have predicted that the Fed raising interest rates should increase the amount of money in money market funds and put downward pressure on equities and credit.

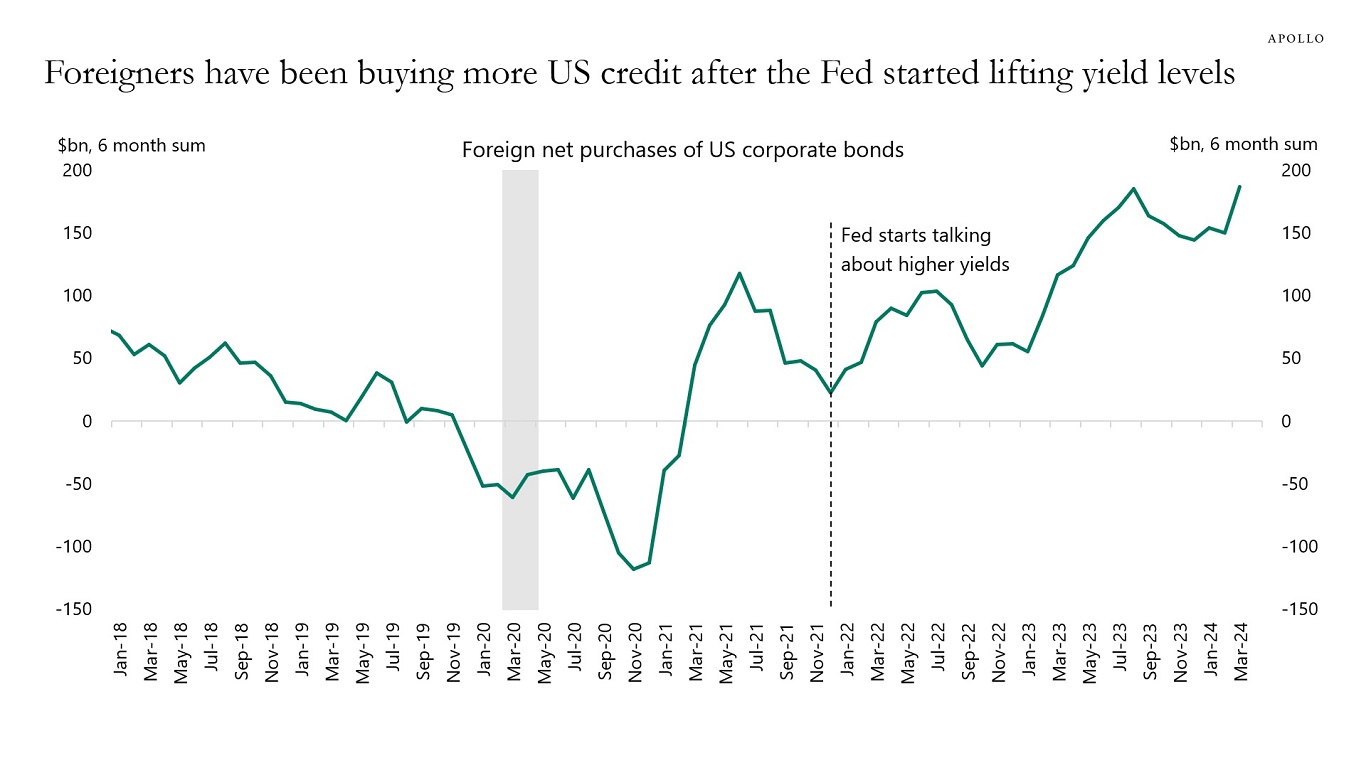
Maybe the answer is foreigners, who are aggressively buying risky assets such as credit because of higher yields and a better US economic outlook relative to the outlook for Europe, Japan, China, and EM. These portfolio flows would also put upward pressure on the US dollar.

Another explanation is that the AI story is boosting equities and credit no matter what interest rates are on money market accounts.

The bottom line is that there is still a lot of money on the sidelines, with $6 trillion in money market funds that can be used to purchase public and private credit and public and private equity.

There is a record-high $6 trillion on the sidelines in money market funds
Source: Bloomberg, Apollo Chief Economist

Download high-res chart(s)

Recent Posts

  • Has Trump Outsmarted Everyone on Tariffs?
  • The Continental Shift: Europe’s Private Credit Moment
  • CPI Data Quality Declining
  • Fixed Income Replacement as a Generator of Alpha
  • Record-High Foreign Ownership of the US Equity Market

Recent Comments

No comments to show.

Archives

  • June 2025
  • May 2025
  • April 2025
  • March 2025
  • February 2025
  • January 2025
  • December 2024
  • November 2024
  • October 2024
  • September 2024
  • August 2024
  • July 2024
  • June 2024
  • May 2024
  • April 2024
  • March 2024
  • February 2024
  • January 2024
  • December 2023
  • November 2023
  • October 2023
  • September 2023
  • August 2023
  • July 2023
  • June 2023
  • May 2023
  • April 2023
  • March 2023
  • February 2023
  • January 2023
  • December 2022
  • November 2022
  • October 2022
  • September 2022
  • August 2022
  • July 2022
  • June 2022
  • May 2022
  • April 2022
  • March 2022
  • February 2022
  • January 2022
  • December 2021
  • November 2021

Categories

  • Apollo Answers
  • Course Introductions
  • Economic Intelligence
  • Hide from Wordpress Search
  • Investment Knowledge
  • Perspectives
  • Redirecting
  • The Daily Spark
  • The View from Apollo
  • The Weekly Brief
  • Uncategorized
  • White Papers

Quantifying Fed Sentiment

The Bloomberg natural language processing model analyzes Fed speeches and currently shows FOMC members moving toward a tightening bias, see chart below.

Note how the model never predicted rate cuts in 2024. Instead, Fed sentiment has simply been less hawkish in 2024 than in 2022 and 2023.

The bottom line is that this Fed sentiment model using data back to 2009 shows that Fed communication continues to favor Fed hikes rather than Fed cuts.

The Bloomberg natural language Fedspeak model shows Fedspeak turning more hawkish recently
Source: Bloomberg, Apollo Chief Economist. Note: Fedspeak: NLP model of Fed sentiment. The index is underpinned by an NLP algorithm trained on Bloomberg News headlines, covering about 6,200 speaking engagements by Fed officials since 2009. A reading below zero implies rate cuts, while above zero indicates a tightening basis.

Download high-res chart(s)

Recent Posts

  • Has Trump Outsmarted Everyone on Tariffs?
  • The Continental Shift: Europe’s Private Credit Moment
  • CPI Data Quality Declining
  • Fixed Income Replacement as a Generator of Alpha
  • Record-High Foreign Ownership of the US Equity Market

Recent Comments

No comments to show.

Archives

  • June 2025
  • May 2025
  • April 2025
  • March 2025
  • February 2025
  • January 2025
  • December 2024
  • November 2024
  • October 2024
  • September 2024
  • August 2024
  • July 2024
  • June 2024
  • May 2024
  • April 2024
  • March 2024
  • February 2024
  • January 2024
  • December 2023
  • November 2023
  • October 2023
  • September 2023
  • August 2023
  • July 2023
  • June 2023
  • May 2023
  • April 2023
  • March 2023
  • February 2023
  • January 2023
  • December 2022
  • November 2022
  • October 2022
  • September 2022
  • August 2022
  • July 2022
  • June 2022
  • May 2022
  • April 2022
  • March 2022
  • February 2022
  • January 2022
  • December 2021
  • November 2021

Categories

  • Apollo Answers
  • Course Introductions
  • Economic Intelligence
  • Hide from Wordpress Search
  • Investment Knowledge
  • Perspectives
  • Redirecting
  • The Daily Spark
  • The View from Apollo
  • The Weekly Brief
  • Uncategorized
  • White Papers

The Fed Cut Reflexivity Paradox

Financial conditions are significantly easier than when the Fed started raising interest rates in March 2022, see chart below.

The strength in the stock market is partly driven by strong earnings, including from NVIDIA. But the stock market is being boosted by more than strong earnings and the prospects of AI lifting future GDP growth.

Since the Fed pivot in November 2023, when the FOMC started talking about cuts instead of hikes, the S&P 500 market cap is up $9 trillion. For comparison, consumer spending in 2023 was $19 trillion. In other words, in a few months, the household sector has experienced a windfall gain corresponding to about 50% of last year’s consumer spending!

Combined with continued easy fiscal policy via the Chips Act, the Inflation Reduction Act, and the Infrastructure Act, it is not surprising that employment growth and inflation have been reaccelerating in 2024.

In short, why is the economy still so strong? Because fiscal policy is still a significant tailwind to the economy, and easy financial conditions have been offsetting Fed hikes.

Looking ahead, with the stock market hitting fresh all-time highs and fiscal policy still supportive, the expectation in markets should be that the economy will continue to accelerate over the coming quarters.

You can call this the Fed Cut Reflexivity Paradox: The more the Fed insists that the next move in interest rates is a cut, the more financial conditions will ease, making it more difficult for the Fed to cut.

Financial conditions are significantly easier than when the Fed started tightening in March 2022
Source: Bloomberg, Apollo Chief Economist

Download high-res chart(s)

Recent Posts

  • Has Trump Outsmarted Everyone on Tariffs?
  • The Continental Shift: Europe’s Private Credit Moment
  • CPI Data Quality Declining
  • Fixed Income Replacement as a Generator of Alpha
  • Record-High Foreign Ownership of the US Equity Market

Recent Comments

No comments to show.

Archives

  • June 2025
  • May 2025
  • April 2025
  • March 2025
  • February 2025
  • January 2025
  • December 2024
  • November 2024
  • October 2024
  • September 2024
  • August 2024
  • July 2024
  • June 2024
  • May 2024
  • April 2024
  • March 2024
  • February 2024
  • January 2024
  • December 2023
  • November 2023
  • October 2023
  • September 2023
  • August 2023
  • July 2023
  • June 2023
  • May 2023
  • April 2023
  • March 2023
  • February 2023
  • January 2023
  • December 2022
  • November 2022
  • October 2022
  • September 2022
  • August 2022
  • July 2022
  • June 2022
  • May 2022
  • April 2022
  • March 2022
  • February 2022
  • January 2022
  • December 2021
  • November 2021

Categories

  • Apollo Answers
  • Course Introductions
  • Economic Intelligence
  • Hide from Wordpress Search
  • Investment Knowledge
  • Perspectives
  • Redirecting
  • The Daily Spark
  • The View from Apollo
  • The Weekly Brief
  • Uncategorized
  • White Papers

This Economy Is Not Slowing Down

Earnings growth is a three-quarter leading indicator for capex spending, and the continued strength in earnings suggests that we will see a strong rebound in business fixed investment over the coming quarters, see chart below.

Continued strong earnings growth points to higher capex spending ahead
Source: BEA, S&P, Haver Analytics, Apollo Chief Economist

Download high-res chart(s)

Recent Posts

  • Has Trump Outsmarted Everyone on Tariffs?
  • The Continental Shift: Europe’s Private Credit Moment
  • CPI Data Quality Declining
  • Fixed Income Replacement as a Generator of Alpha
  • Record-High Foreign Ownership of the US Equity Market

Recent Comments

No comments to show.

Archives

  • June 2025
  • May 2025
  • April 2025
  • March 2025
  • February 2025
  • January 2025
  • December 2024
  • November 2024
  • October 2024
  • September 2024
  • August 2024
  • July 2024
  • June 2024
  • May 2024
  • April 2024
  • March 2024
  • February 2024
  • January 2024
  • December 2023
  • November 2023
  • October 2023
  • September 2023
  • August 2023
  • July 2023
  • June 2023
  • May 2023
  • April 2023
  • March 2023
  • February 2023
  • January 2023
  • December 2022
  • November 2022
  • October 2022
  • September 2022
  • August 2022
  • July 2022
  • June 2022
  • May 2022
  • April 2022
  • March 2022
  • February 2022
  • January 2022
  • December 2021
  • November 2021

Categories

  • Apollo Answers
  • Course Introductions
  • Economic Intelligence
  • Hide from Wordpress Search
  • Investment Knowledge
  • Perspectives
  • Redirecting
  • The Daily Spark
  • The View from Apollo
  • The Weekly Brief
  • Uncategorized
  • White Papers

Market Gradually Removing Central Bank Rate Cuts

At the beginning of the year, the market was pricing six Fed cuts this year, six ECB cuts, and five BoE cuts, see chart below.

Today, the market is pricing two-and-a-half cuts by the ECB and the BoC, one-and-a-half cuts by the Fed and the BoE, and only half a cut by the RBA.

With inflation still a problem and continued strong tailwinds to the US economy from easy financial conditions and expansive fiscal policy, we continue to expect zero Fed cuts this year.

Market is expecting fewer rate cuts
Source: Bloomberg, Apollo Chief Economist

Download high-res chart(s)

Recent Posts

  • Has Trump Outsmarted Everyone on Tariffs?
  • The Continental Shift: Europe’s Private Credit Moment
  • CPI Data Quality Declining
  • Fixed Income Replacement as a Generator of Alpha
  • Record-High Foreign Ownership of the US Equity Market

Recent Comments

No comments to show.

Archives

  • June 2025
  • May 2025
  • April 2025
  • March 2025
  • February 2025
  • January 2025
  • December 2024
  • November 2024
  • October 2024
  • September 2024
  • August 2024
  • July 2024
  • June 2024
  • May 2024
  • April 2024
  • March 2024
  • February 2024
  • January 2024
  • December 2023
  • November 2023
  • October 2023
  • September 2023
  • August 2023
  • July 2023
  • June 2023
  • May 2023
  • April 2023
  • March 2023
  • February 2023
  • January 2023
  • December 2022
  • November 2022
  • October 2022
  • September 2022
  • August 2022
  • July 2022
  • June 2022
  • May 2022
  • April 2022
  • March 2022
  • February 2022
  • January 2022
  • December 2021
  • November 2021

Categories

  • Apollo Answers
  • Course Introductions
  • Economic Intelligence
  • Hide from Wordpress Search
  • Investment Knowledge
  • Perspectives
  • Redirecting
  • The Daily Spark
  • The View from Apollo
  • The Weekly Brief
  • Uncategorized
  • White Papers

Foreigners Prefer Higher All-in Yields

Net foreign purchases of US credit have increased dramatically since the Fed started raising yield levels, see chart below.

Foreigners have been buying more US credit after the Fed started lifting yield levels
Source: US Treasury, Haver Analytics, Apollo Chief Economist

Download high-res chart(s)

Recent Posts

  • Has Trump Outsmarted Everyone on Tariffs?
  • The Continental Shift: Europe’s Private Credit Moment
  • CPI Data Quality Declining
  • Fixed Income Replacement as a Generator of Alpha
  • Record-High Foreign Ownership of the US Equity Market

Recent Comments

No comments to show.

Archives

  • June 2025
  • May 2025
  • April 2025
  • March 2025
  • February 2025
  • January 2025
  • December 2024
  • November 2024
  • October 2024
  • September 2024
  • August 2024
  • July 2024
  • June 2024
  • May 2024
  • April 2024
  • March 2024
  • February 2024
  • January 2024
  • December 2023
  • November 2023
  • October 2023
  • September 2023
  • August 2023
  • July 2023
  • June 2023
  • May 2023
  • April 2023
  • March 2023
  • February 2023
  • January 2023
  • December 2022
  • November 2022
  • October 2022
  • September 2022
  • August 2022
  • July 2022
  • June 2022
  • May 2022
  • April 2022
  • March 2022
  • February 2022
  • January 2022
  • December 2021
  • November 2021

Categories

  • Apollo Answers
  • Course Introductions
  • Economic Intelligence
  • Hide from Wordpress Search
  • Investment Knowledge
  • Perspectives
  • Redirecting
  • The Daily Spark
  • The View from Apollo
  • The Weekly Brief
  • Uncategorized
  • White Papers

US Housing Outlook: Recovery Continues

Ten reasons to be bullish on US housing:

1) Household formation is 2.3 million below its long-run trend, i.e., there is pent-up demand for 2.3 million homes in the US, see the first chart.

2) The share of homes without a mortgage is rising, and now at about 40%, see the second chart.

3) 30% of homes are selling above their list price, see the third chart.

4) The inventory of homes for sale remains very low, see the fourth chart.

5) The share of people planning to move to a new address has started to increase, see the fifth chart.

6) The share of homes built for rent is going up, see the sixth chart.

7) Employment in construction is rebounding, see the seventh chart.

8) The number of new foreclosures remains very low, see the eighth chart.

9) About half of mortgages have an interest rate below 4%, see the ninth chart.

10) After the Fed pivot in November 2023, asking rents have started to increase, see the tenth chart.

Our updated US housing chart book is available here.

US has an estimated deficit of 2.3mn homes
Source: Census, Haver Analytics, Apollo Chief Economist
Almost 40% of US homes don’t have a mortgage
Source: US Census Bureau, Bloomberg, Apollo Chief Economist
Despite high mortgage rates, 30% of homes selling above their list price
Source: Redfin, Apollo Chief Economist
Total housing inventory per person very low
Source: Census Bureau, FRED, Apollo Chief Economist
Share of households planning to move starting to recover
Source: FRB of NY, Haver Analytics, Apollo Chief Economist
Share of homes built for rent going up
Source: Census Bureau, Haver Analytics, Apollo Chief Economist
Employment in residential construction rebounding
Source: BLS, Haver Analytics, Apollo Chief Economist
New foreclosures, by age of homeowner
Source: FRBNY Consumer Credit Panel, Equifax, Haver Analytics, Apollo Chief Economist
About half of all mortgages outstanding have an interest rate below 4%
Source: FHFA, Apollo Chief Economist
Asking rents rising across regions
Source: Rent.com, Apollo Chief Economist

Download high-res chart(s)

Recent Posts

  • Has Trump Outsmarted Everyone on Tariffs?
  • The Continental Shift: Europe’s Private Credit Moment
  • CPI Data Quality Declining
  • Fixed Income Replacement as a Generator of Alpha
  • Record-High Foreign Ownership of the US Equity Market

Recent Comments

No comments to show.

Archives

  • June 2025
  • May 2025
  • April 2025
  • March 2025
  • February 2025
  • January 2025
  • December 2024
  • November 2024
  • October 2024
  • September 2024
  • August 2024
  • July 2024
  • June 2024
  • May 2024
  • April 2024
  • March 2024
  • February 2024
  • January 2024
  • December 2023
  • November 2023
  • October 2023
  • September 2023
  • August 2023
  • July 2023
  • June 2023
  • May 2023
  • April 2023
  • March 2023
  • February 2023
  • January 2023
  • December 2022
  • November 2022
  • October 2022
  • September 2022
  • August 2022
  • July 2022
  • June 2022
  • May 2022
  • April 2022
  • March 2022
  • February 2022
  • January 2022
  • December 2021
  • November 2021

Categories

  • Apollo Answers
  • Course Introductions
  • Economic Intelligence
  • Hide from Wordpress Search
  • Investment Knowledge
  • Perspectives
  • Redirecting
  • The Daily Spark
  • The View from Apollo
  • The Weekly Brief
  • Uncategorized
  • White Papers

The Outlook for Inflation

Demographic trends will weigh on inflation over the coming decades, but the secular stagnation forces pulling inflation down are currently being offset by upward pressures on inflation coming from deglobalization, energy transition, defense spending, restrictions on immigration, easy financial conditions, and easy fiscal policy.

Put differently, the structural forces pushing inflation down are currently being offset by cyclical forces putting upward pressure on inflation.

That’s the reason why interest rates will not only be higher for longer in the short term but also in the longer term, see also the second chart, which shows that the market is currently pricing that the Fed funds rate will be between 4% and 5% over the coming years.

Secular stagnation driving interest rates lower over the coming decades
Source: UN Population statistics, Haver Analytics, Apollo Chief Economist
Interest rates will remain permanently higher
Source: Bloomberg, Apollo Chief Economist

Download high-res chart(s)

Recent Posts

  • Has Trump Outsmarted Everyone on Tariffs?
  • The Continental Shift: Europe’s Private Credit Moment
  • CPI Data Quality Declining
  • Fixed Income Replacement as a Generator of Alpha
  • Record-High Foreign Ownership of the US Equity Market

Recent Comments

No comments to show.

Archives

  • June 2025
  • May 2025
  • April 2025
  • March 2025
  • February 2025
  • January 2025
  • December 2024
  • November 2024
  • October 2024
  • September 2024
  • August 2024
  • July 2024
  • June 2024
  • May 2024
  • April 2024
  • March 2024
  • February 2024
  • January 2024
  • December 2023
  • November 2023
  • October 2023
  • September 2023
  • August 2023
  • July 2023
  • June 2023
  • May 2023
  • April 2023
  • March 2023
  • February 2023
  • January 2023
  • December 2022
  • November 2022
  • October 2022
  • September 2022
  • August 2022
  • July 2022
  • June 2022
  • May 2022
  • April 2022
  • March 2022
  • February 2022
  • January 2022
  • December 2021
  • November 2021

Categories

  • Apollo Answers
  • Course Introductions
  • Economic Intelligence
  • Hide from Wordpress Search
  • Investment Knowledge
  • Perspectives
  • Redirecting
  • The Daily Spark
  • The View from Apollo
  • The Weekly Brief
  • Uncategorized
  • White Papers

Real Estate: Opportunities and Risks in an Unprecedented Market

Listen to Apollo Chief Economist Torsten Sløk speak with Randy Anderson, a partner in the Real Assets Group at Apollo, about how surging interest rates have contributed to unprecedented conditions in the US real estate market, and how opportunities can be found as rates stay higher for longer.

Recent Posts

  • Has Trump Outsmarted Everyone on Tariffs?
  • The Continental Shift: Europe’s Private Credit Moment
  • CPI Data Quality Declining
  • Fixed Income Replacement as a Generator of Alpha
  • Record-High Foreign Ownership of the US Equity Market

Recent Comments

No comments to show.

Archives

  • June 2025
  • May 2025
  • April 2025
  • March 2025
  • February 2025
  • January 2025
  • December 2024
  • November 2024
  • October 2024
  • September 2024
  • August 2024
  • July 2024
  • June 2024
  • May 2024
  • April 2024
  • March 2024
  • February 2024
  • January 2024
  • December 2023
  • November 2023
  • October 2023
  • September 2023
  • August 2023
  • July 2023
  • June 2023
  • May 2023
  • April 2023
  • March 2023
  • February 2023
  • January 2023
  • December 2022
  • November 2022
  • October 2022
  • September 2022
  • August 2022
  • July 2022
  • June 2022
  • May 2022
  • April 2022
  • March 2022
  • February 2022
  • January 2022
  • December 2021
  • November 2021

Categories

  • Apollo Answers
  • Course Introductions
  • Economic Intelligence
  • Hide from Wordpress Search
  • Investment Knowledge
  • Perspectives
  • Redirecting
  • The Daily Spark
  • The View from Apollo
  • The Weekly Brief
  • Uncategorized
  • White Papers

Supercore Inflation Trending Higher

The key reasons why supercore inflation remains high are auto insurance and hospital services, and it is a legitimate question to ask whether the Fed keeping interest rates higher for longer will slow down inflation in those two categories, see chart below.

The problem with that logic is that housing inflation is also high, and if the Fed were to lower interest rates, it would put new upward pressure on the demand-driven components of CPI, including housing inflation, airfares, hotel prices, restaurant prices, etc.

The bottom line is that if the Fed, instead of focusing on the overall CPI index, decides to put less weight on housing inflation, auto insurance, and hospital services, it runs the risk that Fed communication about what is important and what is not important becomes very difficult. This challenge is particularly difficult when the Fed is already being asked why it puts no weight on inflation in food and energy.

Supercore inflation trending higher
Source: BLS, Bloomberg, Apollo Chief Economist

Download high-res chart(s)

Recent Posts

  • Has Trump Outsmarted Everyone on Tariffs?
  • The Continental Shift: Europe’s Private Credit Moment
  • CPI Data Quality Declining
  • Fixed Income Replacement as a Generator of Alpha
  • Record-High Foreign Ownership of the US Equity Market

Recent Comments

No comments to show.

Archives

  • June 2025
  • May 2025
  • April 2025
  • March 2025
  • February 2025
  • January 2025
  • December 2024
  • November 2024
  • October 2024
  • September 2024
  • August 2024
  • July 2024
  • June 2024
  • May 2024
  • April 2024
  • March 2024
  • February 2024
  • January 2024
  • December 2023
  • November 2023
  • October 2023
  • September 2023
  • August 2023
  • July 2023
  • June 2023
  • May 2023
  • April 2023
  • March 2023
  • February 2023
  • January 2023
  • December 2022
  • November 2022
  • October 2022
  • September 2022
  • August 2022
  • July 2022
  • June 2022
  • May 2022
  • April 2022
  • March 2022
  • February 2022
  • January 2022
  • December 2021
  • November 2021

Categories

  • Apollo Answers
  • Course Introductions
  • Economic Intelligence
  • Hide from Wordpress Search
  • Investment Knowledge
  • Perspectives
  • Redirecting
  • The Daily Spark
  • The View from Apollo
  • The Weekly Brief
  • Uncategorized
  • White Papers

Posts navigation

Page 1 Page 2 … Page 4 Next page→
  • Privacy Notice
  • Terms of Use
  • Forward-Looking Statements
Apollo
© Apollo Global Management, Inc. All Rights Reserved.

The Apollo Academy is for informational and educational purposes only and nothing contained herein should be taken as investment advice or a recommendation to enter into any transaction. They are not an invitation by or on behalf of Apollo to any person to buy or sell any security or to adopt any investment strategy, and shall not form the basis of, nor may it accompany nor form part of, any right or contract to buy or sell any security or to adopt any investment strategy. There is no guarantee that the views and opinions expressed in this website will come to pass. For additional information, please see the disclaimers included in each piece of content or the legal page of our website here.