Most of the time in financial markets goes with talking about the S&P 500.
But public markets and public companies are only a small part of the economy.
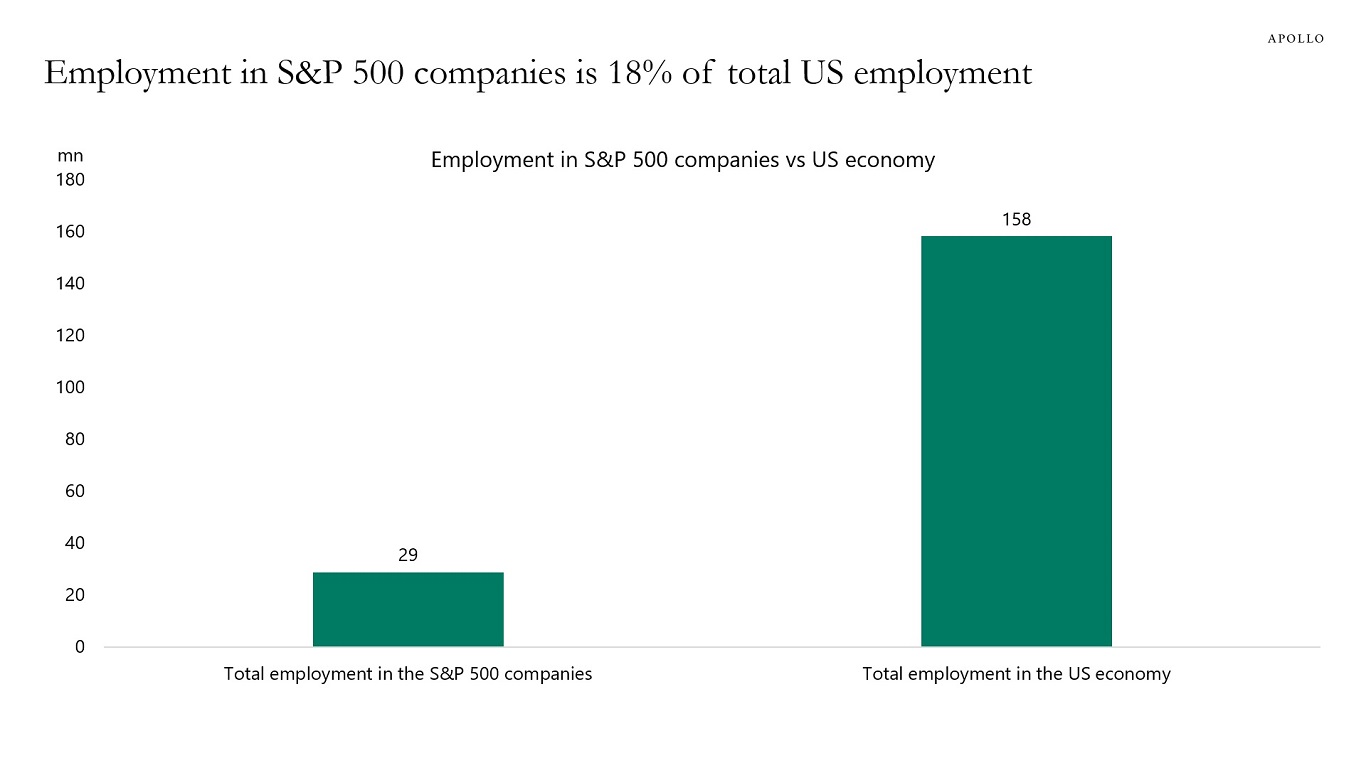
Total global employment in the S&P 500 companies is 29 million, and total employment in the US economy is 158 million, see chart below.
Put differently, more than 80% of total employment in the US economy is outside the S&P 500 companies.
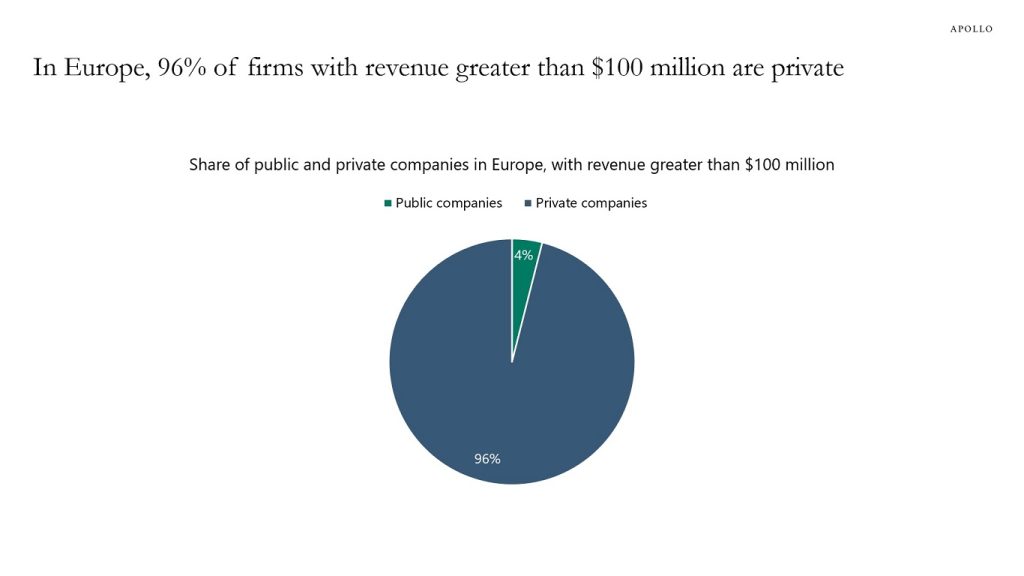
This is consistent with our recent Daily Spark, in which we showed that 87% of firms in the US with revenue greater than $100 million are private.
The bottom line is that the vast majority of the US economy is in private markets.