• Apollo.com
  • Login
  • Register Now
light site-logo
  • The Academy
  • Upcoming Events
        • Upcoming Events

  • Learning Center
        • New & UpdatedAlternative Investing Course 2.0

        • Alternative Investing Essentials Part OnePrivate Equity, Venture Capital, Private Credit
        • Alternative Investing Essentials Part TwoReal Estate, Infrastructure, Digital Assets, Hedge Funds
        • Practical ConsiderationsAsset Allocation, Risk Considerations, Fund Structures, Fees
        • Introductory Videos

          View All Videos

        •  Recent Classes & Videos

        • • Mid-Year Outlook: At the Crossroads of Stagflation — What’s Next?
        • • Hybrid Investments: Flexible Structures for Volatile Times
        • • Private Credit Investing in Volatile Times
        • • Potential Implications of the Latest US Administration Policy Proposals
        • • Beyond 60/40: Private Assets in an Era of High Public Valuations
        • • Investment Grade Private Credit as a Core Fixed Income Allocation
        • View All Classes

  • Alternative Perspectives
        • Investment Knowledge
        • The View from Apollo
          • Investment Knowledge White Papers

            Mid-Year Outlook: At the Crossroads of Stagflation—What’s Next?

            June 23, 2025
          • The View From Apollo

            Another Chance to Position Portfolios for Tariff Turmoil?

            July 17, 2025
          • Investment Knowledge White Papers

            The Continental Shift: Europe’s Private Credit Moment

            June 20, 2025
  • The Daily Spark
        • Read The Daily Spark Blog


        • Want it delivered daily to your inbox?
          • The Daily Spark

            Comparing Wage Growth for Job Stayers and Job Switchers

            July 18, 2025
          • The Daily Spark

            Different Retirement Systems in Europe

            July 17, 2025
          • The Daily Spark

            AI Bubble Today Is Bigger Than the IT Bubble in the 1990s

            July 16, 2025
  • Register for Apollo Academy: Alternative Investing Course
  • Login
  • About Apollo Academy
  • Upcoming Events
  • Learning Center
  • Alternative Perspectives
  • The Daily Spark
  • Register for Apollo Academy: Alternative Investing Course
  • Login
  • Alternative Investing Course 2.0
  • Mid-Year Outlook: At the Crossroads of Stagflation — What’s Next?
  • Hybrid Investments: Flexible Structures for Volatile Times
  • Private Credit Investing in Volatile Times
  • Potential Implications of the Latest US Administration Policy Proposals
  • Beyond 60/40: Private Assets in an Era of High Public Valuations
  • Investment Grade Private Credit as a Core Fixed Income Allocation
  • View All Classes
  • Introductory Videos
  • Alternative Investing Essentials Part One • Now Available On Demand
  • Alternative Investing Essentials Part Two • Now Available On Demand
  • Practical Considerations • Now Available On Demand
  • Investment Knowledge
  • The View from Apollo
Home June 2025

Fed Worried About Stagflation

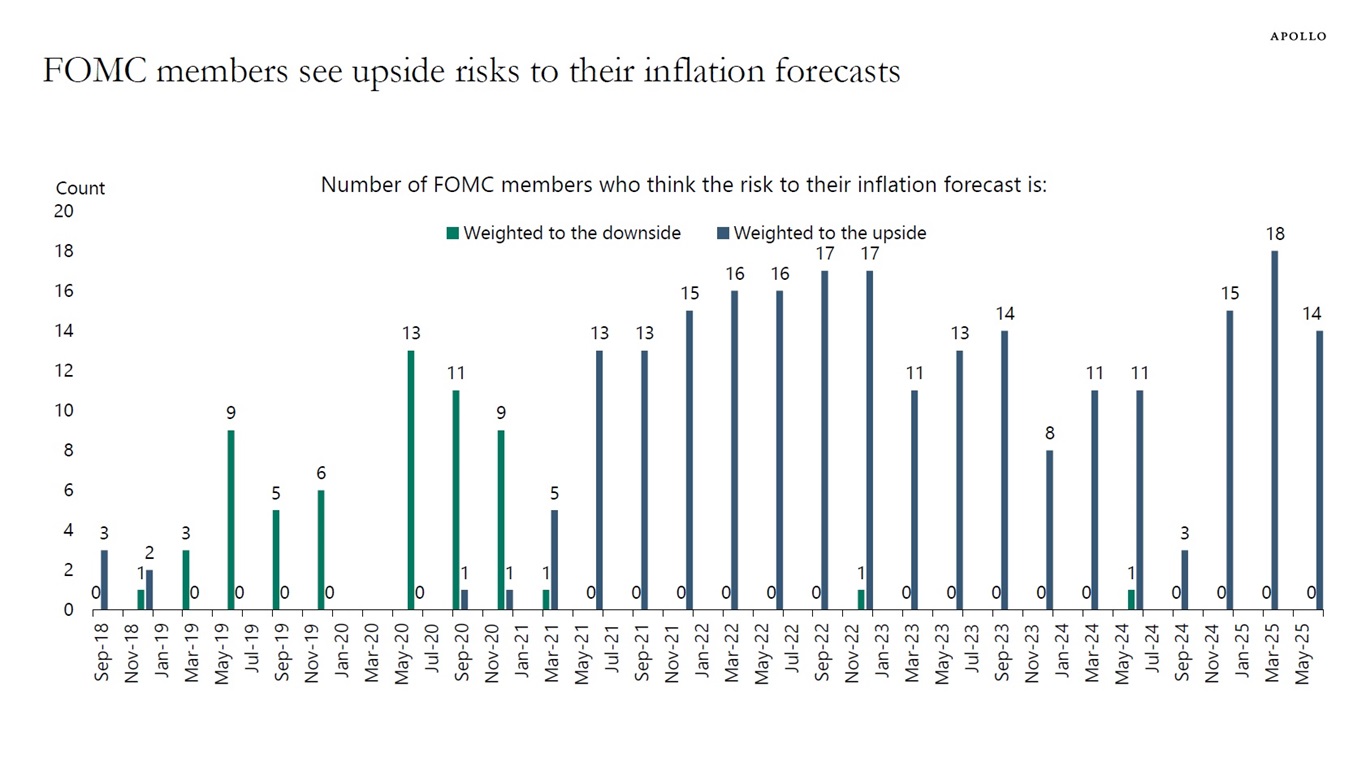
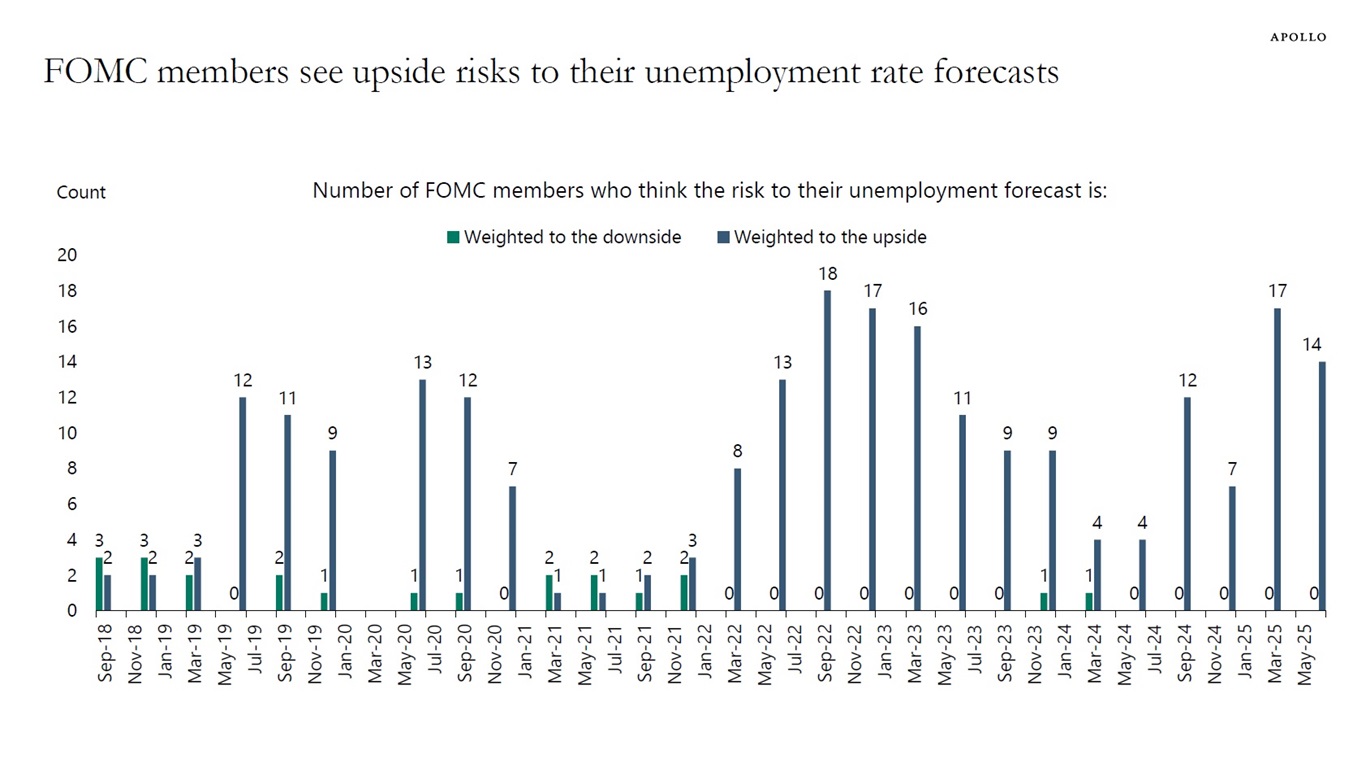
When FOMC members produce their forecasts ahead of Fed meetings, they are also asked how they view the risks to inflation and unemployment.

Currently, there are no FOMC members who foresee downside risks to the unemployment rate or inflation, see charts below.

In other words, the Fed continues to forecast stagflation and is concerned that we may experience rising inflation and rising unemployment at the same time.

These worries are likely driven by higher oil prices, tariffs, and immigration restrictions, all of which are putting upward pressure on inflation and unemployment simultaneously.

FOMC members see upside risks to their inflation forecasts
Sources: Federal Reserve Board, Bloomberg, Apollo Chief Economist
FOMC members see upside risks to their unemployment rate forecasts
Sources: Federal Reserve Board, Bloomberg, Apollo Chief Economist

Download high-res charts

Recent Posts

  • Comparing Wage Growth for Job Stayers and Job Switchers
  • Another Chance to Position Portfolios for Tariff Turmoil?
  • Different Retirement Systems in Europe
  • AI Bubble Today Is Bigger Than the IT Bubble in the 1990s
  • 75% of Restaurant Orders Are Delivery Orders

Recent Comments

No comments to show.

Archives

  • July 2025
  • June 2025
  • May 2025
  • April 2025
  • March 2025
  • February 2025
  • January 2025
  • December 2024
  • November 2024
  • October 2024
  • September 2024
  • August 2024
  • July 2024
  • June 2024
  • May 2024
  • April 2024
  • March 2024
  • February 2024
  • January 2024
  • December 2023
  • November 2023
  • October 2023
  • September 2023
  • August 2023
  • July 2023
  • June 2023
  • May 2023
  • April 2023
  • March 2023
  • February 2023
  • January 2023
  • December 2022
  • November 2022
  • October 2022
  • September 2022
  • August 2022
  • July 2022
  • June 2022
  • May 2022
  • April 2022
  • March 2022
  • February 2022
  • January 2022
  • December 2021
  • November 2021

Categories

  • Apollo Answers
  • Course Introductions
  • Economic Intelligence
  • Hide from Wordpress Search
  • Investment Knowledge
  • Perspectives
  • Redirecting
  • The Daily Spark
  • The View from Apollo
  • The Weekly Brief
  • Uncategorized
  • White Papers

Difficult for First-Time Home Buyers to Enter the Housing Market

In 2010, 50% of all homes sold were purchased by first-time home buyers.

Today, the share is 24%, see chart below.

The share of first-time home buyers has declined from 50% to currently 24%
Sources: National Association of Realtors, Apollo Chief Economist

Download high-res chart

Recent Posts

  • Comparing Wage Growth for Job Stayers and Job Switchers
  • Another Chance to Position Portfolios for Tariff Turmoil?
  • Different Retirement Systems in Europe
  • AI Bubble Today Is Bigger Than the IT Bubble in the 1990s
  • 75% of Restaurant Orders Are Delivery Orders

Recent Comments

No comments to show.

Archives

  • July 2025
  • June 2025
  • May 2025
  • April 2025
  • March 2025
  • February 2025
  • January 2025
  • December 2024
  • November 2024
  • October 2024
  • September 2024
  • August 2024
  • July 2024
  • June 2024
  • May 2024
  • April 2024
  • March 2024
  • February 2024
  • January 2024
  • December 2023
  • November 2023
  • October 2023
  • September 2023
  • August 2023
  • July 2023
  • June 2023
  • May 2023
  • April 2023
  • March 2023
  • February 2023
  • January 2023
  • December 2022
  • November 2022
  • October 2022
  • September 2022
  • August 2022
  • July 2022
  • June 2022
  • May 2022
  • April 2022
  • March 2022
  • February 2022
  • January 2022
  • December 2021
  • November 2021

Categories

  • Apollo Answers
  • Course Introductions
  • Economic Intelligence
  • Hide from Wordpress Search
  • Investment Knowledge
  • Perspectives
  • Redirecting
  • The Daily Spark
  • The View from Apollo
  • The Weekly Brief
  • Uncategorized
  • White Papers

Treasury Issuance Growing

Examining Treasury auction metrics across the curve reveals no signs of weakness in demand for US Treasuries at present. Bid-to-cover ratios are stable, and there is no evidence of auctions systematically tailing, see the first four charts below.

These charts, however, offer little comfort when considering the rising trend in debt-to-GDP, the increasing term premium, the falling dollar, and the $9 trillion that the US government needs to refinance over the next 12 months, see the following four charts below.

In particular, debt-servicing costs are rising rapidly, and the US government currently pays a record-high $3.3 billion in interest payments every day, and for every dollar the US government collects in tax revenue, about 20 cents go to paying interest on debt.

With debt levels growing much faster than GDP, the bottom line is that Treasury issuance will continue to grow faster than the economy, and the most likely outcome is that investors will demand compensation in the form of higher long-term interest rates.

In sum, there is upside pressure on short rates from higher oil prices, higher tariffs, and restrictions on immigration, and there is upside pressure on long rates because of fiscal challenges.

This is obviously very important for investors in both public and private markets.

Our updated chart book looking at demand and supply for US Treasuries is available here.

Auction sizes growing in 2025
Sources: Bureau of Public Debt, Haver Analytics, Apollo Chief Economist
Rising Treasury supply increases downside risks to bid-to-cover ratios
Sources: US Department of Treasury, Macrobond, Apollo Chief Economist
Rising Treasury supply increases downside risks to bid-to-cover ratios
Sources: US Department of Treasury, Macrobond, Apollo Chief Economist
10-year bond auction tails
Note: Bloomberg ticker USN10YTL Index. Sources: Bloomberg, Macrobond, Apollo Chief Economist
CBO: Under current policies, government debt outstanding will grow from 100% to 150% of GDP
Sources: US Congressional Budget Office (CBO), Macrobond, Apollo Chief Economist
Term premium in a longer perspective
Note: The NY Fed measure for the term premium is based on a five-factor, no arbitrage structure model. Sources: Federal Reserve Bank of New York, Macrobond, Apollo Chief Economist
Since the trade war started, EURUSD has been driven by other factors than interest rate differentials
Note: 1-year yield differential = 1-year German government bill minus 1-year US T-bill. pp = percentage points. Sources: Bloomberg, Macrobond, Apollo Chief Economist
$9 trillion of government debt will mature over the next year
Sources: US Department of Treasury, Macrobond, Apollo Chief Economist
Average federal net interest expense per day: $3.3 billion
Sources: US Treasury, Bloomberg, Macrobond, Apollo Chief Economist
Net interest payments make up 18% of government revenues
Sources: US Congressional Budget Office (CBO), Macrobond, Apollo Chief Economist

Download high-res chart book

Recent Posts

  • Comparing Wage Growth for Job Stayers and Job Switchers
  • Another Chance to Position Portfolios for Tariff Turmoil?
  • Different Retirement Systems in Europe
  • AI Bubble Today Is Bigger Than the IT Bubble in the 1990s
  • 75% of Restaurant Orders Are Delivery Orders

Recent Comments

No comments to show.

Archives

  • July 2025
  • June 2025
  • May 2025
  • April 2025
  • March 2025
  • February 2025
  • January 2025
  • December 2024
  • November 2024
  • October 2024
  • September 2024
  • August 2024
  • July 2024
  • June 2024
  • May 2024
  • April 2024
  • March 2024
  • February 2024
  • January 2024
  • December 2023
  • November 2023
  • October 2023
  • September 2023
  • August 2023
  • July 2023
  • June 2023
  • May 2023
  • April 2023
  • March 2023
  • February 2023
  • January 2023
  • December 2022
  • November 2022
  • October 2022
  • September 2022
  • August 2022
  • July 2022
  • June 2022
  • May 2022
  • April 2022
  • March 2022
  • February 2022
  • January 2022
  • December 2021
  • November 2021

Categories

  • Apollo Answers
  • Course Introductions
  • Economic Intelligence
  • Hide from Wordpress Search
  • Investment Knowledge
  • Perspectives
  • Redirecting
  • The Daily Spark
  • The View from Apollo
  • The Weekly Brief
  • Uncategorized
  • White Papers

Mid-Year Outlook: At the Crossroads of Stagflation—What’s Next?

Listen to Apollo Chief Economist Torsten Sløk and Global Head of Content Strategy J.P. Vicente discuss the growing list of headwinds facing the economy, including tariffs, trade deal uncertainty, and geopolitical conflict. Torsten also explores potential implications for capital markets and much more.

Recent Posts

  • Comparing Wage Growth for Job Stayers and Job Switchers
  • Another Chance to Position Portfolios for Tariff Turmoil?
  • Different Retirement Systems in Europe
  • AI Bubble Today Is Bigger Than the IT Bubble in the 1990s
  • 75% of Restaurant Orders Are Delivery Orders

Recent Comments

No comments to show.

Archives

  • July 2025
  • June 2025
  • May 2025
  • April 2025
  • March 2025
  • February 2025
  • January 2025
  • December 2024
  • November 2024
  • October 2024
  • September 2024
  • August 2024
  • July 2024
  • June 2024
  • May 2024
  • April 2024
  • March 2024
  • February 2024
  • January 2024
  • December 2023
  • November 2023
  • October 2023
  • September 2023
  • August 2023
  • July 2023
  • June 2023
  • May 2023
  • April 2023
  • March 2023
  • February 2023
  • January 2023
  • December 2022
  • November 2022
  • October 2022
  • September 2022
  • August 2022
  • July 2022
  • June 2022
  • May 2022
  • April 2022
  • March 2022
  • February 2022
  • January 2022
  • December 2021
  • November 2021

Categories

  • Apollo Answers
  • Course Introductions
  • Economic Intelligence
  • Hide from Wordpress Search
  • Investment Knowledge
  • Perspectives
  • Redirecting
  • The Daily Spark
  • The View from Apollo
  • The Weekly Brief
  • Uncategorized
  • White Papers

Outlook for Real Assets

Our outlook for real assets for the second half of 2025 is available here.

The CRE maturity wall is steep especially for residential and office
Source: MBA, Apollo Chief Economist
Prices on commercial real estate not going up, and downward pressure on industrial
Source: RCA, Bloomberg, Macrobond, Apollo Chief Economist

Download high-res chart book

Recent Posts

  • Comparing Wage Growth for Job Stayers and Job Switchers
  • Another Chance to Position Portfolios for Tariff Turmoil?
  • Different Retirement Systems in Europe
  • AI Bubble Today Is Bigger Than the IT Bubble in the 1990s
  • 75% of Restaurant Orders Are Delivery Orders

Recent Comments

No comments to show.

Archives

  • July 2025
  • June 2025
  • May 2025
  • April 2025
  • March 2025
  • February 2025
  • January 2025
  • December 2024
  • November 2024
  • October 2024
  • September 2024
  • August 2024
  • July 2024
  • June 2024
  • May 2024
  • April 2024
  • March 2024
  • February 2024
  • January 2024
  • December 2023
  • November 2023
  • October 2023
  • September 2023
  • August 2023
  • July 2023
  • June 2023
  • May 2023
  • April 2023
  • March 2023
  • February 2023
  • January 2023
  • December 2022
  • November 2022
  • October 2022
  • September 2022
  • August 2022
  • July 2022
  • June 2022
  • May 2022
  • April 2022
  • March 2022
  • February 2022
  • January 2022
  • December 2021
  • November 2021

Categories

  • Apollo Answers
  • Course Introductions
  • Economic Intelligence
  • Hide from Wordpress Search
  • Investment Knowledge
  • Perspectives
  • Redirecting
  • The Daily Spark
  • The View from Apollo
  • The Weekly Brief
  • Uncategorized
  • White Papers

Outlook for PE

Our outlook for private equity for the second half of 2025 is available here.

Private equity and private credit outperforming the S&P 500 at all horizons
Note: The calculation takes 5-year annualized and 10-year annualized returns for every 5-and 10-year window with sample starting in 2000 to 2024 and averaging returns over time. Sources: Preqin, Apollo Chief Economist

Download high-res chart book

Recent Posts

  • Comparing Wage Growth for Job Stayers and Job Switchers
  • Another Chance to Position Portfolios for Tariff Turmoil?
  • Different Retirement Systems in Europe
  • AI Bubble Today Is Bigger Than the IT Bubble in the 1990s
  • 75% of Restaurant Orders Are Delivery Orders

Recent Comments

No comments to show.

Archives

  • July 2025
  • June 2025
  • May 2025
  • April 2025
  • March 2025
  • February 2025
  • January 2025
  • December 2024
  • November 2024
  • October 2024
  • September 2024
  • August 2024
  • July 2024
  • June 2024
  • May 2024
  • April 2024
  • March 2024
  • February 2024
  • January 2024
  • December 2023
  • November 2023
  • October 2023
  • September 2023
  • August 2023
  • July 2023
  • June 2023
  • May 2023
  • April 2023
  • March 2023
  • February 2023
  • January 2023
  • December 2022
  • November 2022
  • October 2022
  • September 2022
  • August 2022
  • July 2022
  • June 2022
  • May 2022
  • April 2022
  • March 2022
  • February 2022
  • January 2022
  • December 2021
  • November 2021

Categories

  • Apollo Answers
  • Course Introductions
  • Economic Intelligence
  • Hide from Wordpress Search
  • Investment Knowledge
  • Perspectives
  • Redirecting
  • The Daily Spark
  • The View from Apollo
  • The Weekly Brief
  • Uncategorized
  • White Papers

Energy Price Outlook

Our chart book, available here, examines energy demand and supply, as well as the significance of the Strait of Hormuz.

The Strait of Hormuz is important
Source: U.S. Energy Information Administration (EIA) analysis, based on Vortexa tanker tracking and Panama Canal, Apollo Chief Economist
Volume of crude oil through the Strait of Hormuz, by destination
Source: U.S. Energy Information Administration (EIA) analysis based on Vortexa, Apollo Chief Economist
Volume of crude oil and petroleum products through the Strait of Hormuz,  by country of origin
Source: U.S. Energy Information Administration (EIA) analysis based on Vortexa, Apollo Chief Economist
Ship crossings in the Strait of Hormuz: East to West
Source: Bloomberg, Macrobond, Apollo Chief Economist
Ship crossings in the Strait of Hormuz: West to East
Source: Bloomberg, Macrobond, Apollo Chief Economist
China buys 89% of Iran’s oil exports
Data as of 2023. Source: U.S. Energy Information Administration (EIA) analysis based on Vortexa, Apollo Chief Economist
Energy Price Outlook

Download high-res chart book

Recent Posts

  • Comparing Wage Growth for Job Stayers and Job Switchers
  • Another Chance to Position Portfolios for Tariff Turmoil?
  • Different Retirement Systems in Europe
  • AI Bubble Today Is Bigger Than the IT Bubble in the 1990s
  • 75% of Restaurant Orders Are Delivery Orders

Recent Comments

No comments to show.

Archives

  • July 2025
  • June 2025
  • May 2025
  • April 2025
  • March 2025
  • February 2025
  • January 2025
  • December 2024
  • November 2024
  • October 2024
  • September 2024
  • August 2024
  • July 2024
  • June 2024
  • May 2024
  • April 2024
  • March 2024
  • February 2024
  • January 2024
  • December 2023
  • November 2023
  • October 2023
  • September 2023
  • August 2023
  • July 2023
  • June 2023
  • May 2023
  • April 2023
  • March 2023
  • February 2023
  • January 2023
  • December 2022
  • November 2022
  • October 2022
  • September 2022
  • August 2022
  • July 2022
  • June 2022
  • May 2022
  • April 2022
  • March 2022
  • February 2022
  • January 2022
  • December 2021
  • November 2021

Categories

  • Apollo Answers
  • Course Introductions
  • Economic Intelligence
  • Hide from Wordpress Search
  • Investment Knowledge
  • Perspectives
  • Redirecting
  • The Daily Spark
  • The View from Apollo
  • The Weekly Brief
  • Uncategorized
  • White Papers

New White Paper—Mid-Year Outlook: At the Crossroads of Stagflation

Higher oil prices, higher tariffs, and restrictions on immigration are putting downward pressure on GDP growth and upward pressure on inflation. Lower GDP growth and higher inflation is the definition of stagflation.

The upward pressure on inflation is limiting how much the Fed can cut interest rates later this year. As a result, all-in yields will stay higher for longer, which will continue to support fixed income assets, including private credit.

We have published our consolidated views in my newest white paper, Mid-Year Outlook: At the Crossroads of Stagflation—What’s Next? You can download it here.

I will also be discussing the contents of the paper and my views in detail in an Apollo Academy class today at 11:00 ET (eligible for a CE credit). Register here. The class will be available on demand afterward.

Mid-Year Outlook

Recent Posts

  • Comparing Wage Growth for Job Stayers and Job Switchers
  • Another Chance to Position Portfolios for Tariff Turmoil?
  • Different Retirement Systems in Europe
  • AI Bubble Today Is Bigger Than the IT Bubble in the 1990s
  • 75% of Restaurant Orders Are Delivery Orders

Recent Comments

No comments to show.

Archives

  • July 2025
  • June 2025
  • May 2025
  • April 2025
  • March 2025
  • February 2025
  • January 2025
  • December 2024
  • November 2024
  • October 2024
  • September 2024
  • August 2024
  • July 2024
  • June 2024
  • May 2024
  • April 2024
  • March 2024
  • February 2024
  • January 2024
  • December 2023
  • November 2023
  • October 2023
  • September 2023
  • August 2023
  • July 2023
  • June 2023
  • May 2023
  • April 2023
  • March 2023
  • February 2023
  • January 2023
  • December 2022
  • November 2022
  • October 2022
  • September 2022
  • August 2022
  • July 2022
  • June 2022
  • May 2022
  • April 2022
  • March 2022
  • February 2022
  • January 2022
  • December 2021
  • November 2021

Categories

  • Apollo Answers
  • Course Introductions
  • Economic Intelligence
  • Hide from Wordpress Search
  • Investment Knowledge
  • Perspectives
  • Redirecting
  • The Daily Spark
  • The View from Apollo
  • The Weekly Brief
  • Uncategorized
  • White Papers

Mid-Year Outlook: At the Crossroads of Stagflation—What’s Next?

US tariffs have climbed to their highest level in nearly 90 years, fueling market volatility and creating uncertainty for corporations. The result? We see slower growth, higher inflation, and rates staying higher for longer. While we don’t foresee a recession, we expect headwinds on both supply and demand fronts.

DOWNLOAD THE PAPER
WATCH THE CLASS
LISTEN TO THE PODCAST

Key Takeaways

  • While below initial expectations, this is still the highest level of tariffs the US has had in nearly nine decades and, if kept, will have substantial impact on the US and global economies.
  • Tariff hikes are typically stagflationary shocks—they simultaneously increase the probability of an economic slowdown while putting upward pressure on prices. In our view, the current tariff regime increases the chance of a US recession to 25% over the next 12 months.
  • As a result, we continue to expect interest rates higher for longer. As of this writing, we see the Federal Reserve cutting rates only once in 2025, with a year-end fed funds-rate target range of 4.00% to 4.25%. We believe that Fed Chairman Jerome Powell will likely take a conservative approach to easing policy to safeguard against fears of runaway inflation.
  • Economic data have mirrored the volatility in the markets and trade policy. Soft indicators (e.g., confidence surveys) have fluctuated in tandem with news of on-again, off-again tariffs, while hard data (i.e., employment and inflation) have shown more resilience. This discrepancy has added to uncertainty and continues to fog the economic outlook.
DOWNLOAD THE PAPER
WATCH THE CLASS
LISTEN TO THE PODCAST

The information herein is provided for educational purposes only and should not be construed as financial or investment advice, nor should any information in this document be relied on when making an investment decision. Opinions and views expressed reflect the current opinions and views of the authors and Apollo Analysts as of the date hereof and are subject to change. Please see the end of this document for important disclosure information.


Important Disclosure Information

This presentation is for educational purposes only and should not be treated as research. This presentation may not be distributed, transmitted or otherwise communicated to others, in whole or in part, without the express written consent of Apollo Global Management, Inc. (together with its subsidiaries, “Apollo”).

The views and opinions expressed in this presentation are the views and opinions of the author(s) of the White Paper. They do not necessarily reflect the views and opinions of Apollo and are subject to change at any time without notice. Further, Apollo and its affiliates may have positions (long or short) or engage in securities transactions that are not consistent with the information and views expressed in this presentation. There can be no assurance that an investment strategy will be successful. Historic market trends are not reliable indicators of actual future market behavior or future performance of any particular investment which may differ materially, and should not be relied upon as such. Target allocations contained herein are subject to change. There is no assurance that the target allocations will be achieved, and actual allocations may be significantly different than that shown here. This presentation does not constitute an offer of any service or product of Apollo. It is not an invitation by or on behalf of Apollo to any person to buy or sell any security or to adopt any investment strategy, and shall not form the basis of, nor may it accompany nor form part of, any right or contract to buy or sell any security or to adopt any investment strategy. Nothing herein should be taken as investment advice or a recommendation to enter into any transaction.

Hyperlinks to third-party websites in this presentation are provided for reader convenience only. There can be no assurance that any trends discussed herein will continue. Unless otherwise noted, information included herein is presented as of the dates indicated. This presentation is not complete and the information contained herein may change at any time without notice. Apollo does not have any responsibility to update the presentation to account for such changes. Apollo has not made any representation or warranty, expressed or implied, with respect to fairness, correctness, accuracy, reasonableness, or completeness of any of the information contained herein, and expressly disclaims any responsibility or liability therefore. The information contained herein is not intended to provide, and should not be relied upon for, accounting, legal or tax advice or investment recommendations. Investors should make an independent investigation of the information contained herein, including consulting their tax, legal, accounting or other advisors about such information. Apollo does not act for you and is not responsible for providing you with the protections afforded to its clients.

Certain information contained herein may be “forward-looking” in nature. Due to various risks and uncertainties, actual events or results may differ materially from those reflected or contemplated in such forward-looking information. As such, undue reliance should not be placed on such information. Forward-looking statements may be identified by the use of terminology including, but not limited to, “may”, “will”, “should”, “expect”, “anticipate”, “target”, “project”, “estimate”, “intend”, “continue” or “believe” or the negatives thereof or other variations thereon or comparable terminology.

The Standard & Poor’s 500 (“S&P 500”) Index is a market-capitalization-weighted index of the 500 largest U.S. publicly traded companies by market value.

Additional information may be available upon request.

Recent Posts

  • Comparing Wage Growth for Job Stayers and Job Switchers
  • Another Chance to Position Portfolios for Tariff Turmoil?
  • Different Retirement Systems in Europe
  • AI Bubble Today Is Bigger Than the IT Bubble in the 1990s
  • 75% of Restaurant Orders Are Delivery Orders

Recent Comments

No comments to show.

Archives

  • July 2025
  • June 2025
  • May 2025
  • April 2025
  • March 2025
  • February 2025
  • January 2025
  • December 2024
  • November 2024
  • October 2024
  • September 2024
  • August 2024
  • July 2024
  • June 2024
  • May 2024
  • April 2024
  • March 2024
  • February 2024
  • January 2024
  • December 2023
  • November 2023
  • October 2023
  • September 2023
  • August 2023
  • July 2023
  • June 2023
  • May 2023
  • April 2023
  • March 2023
  • February 2023
  • January 2023
  • December 2022
  • November 2022
  • October 2022
  • September 2022
  • August 2022
  • July 2022
  • June 2022
  • May 2022
  • April 2022
  • March 2022
  • February 2022
  • January 2022
  • December 2021
  • November 2021

Categories

  • Apollo Answers
  • Course Introductions
  • Economic Intelligence
  • Hide from Wordpress Search
  • Investment Knowledge
  • Perspectives
  • Redirecting
  • The Daily Spark
  • The View from Apollo
  • The Weekly Brief
  • Uncategorized
  • White Papers

Productivity Gains Are Coming

The Census conducts a biweekly survey of 1.2 million firms, and one question is whether a business has used AI tools such as machine learning, natural language processing, virtual agents, or voice recognition to help produce goods or services in the past two weeks, see chart below. Nine percent of firms reported using AI, and the rising trend in AI adoption increases the likelihood of a rise in productivity over the coming quarters.

More companies are using AI: Productivity gains are coming
Note: AI adoption rate answers the question: In the last two weeks, did this business use Artificial Intelligence (AI) in producing goods or services? Examples of AI: machine learning, natural language processing, virtual agents, voice recognition, etc. Sources: US Census Bureau Business Trends and Outlook Survey, Apollo Chief Economist

Download high-res chart

Recent Posts

  • Comparing Wage Growth for Job Stayers and Job Switchers
  • Another Chance to Position Portfolios for Tariff Turmoil?
  • Different Retirement Systems in Europe
  • AI Bubble Today Is Bigger Than the IT Bubble in the 1990s
  • 75% of Restaurant Orders Are Delivery Orders

Recent Comments

No comments to show.

Archives

  • July 2025
  • June 2025
  • May 2025
  • April 2025
  • March 2025
  • February 2025
  • January 2025
  • December 2024
  • November 2024
  • October 2024
  • September 2024
  • August 2024
  • July 2024
  • June 2024
  • May 2024
  • April 2024
  • March 2024
  • February 2024
  • January 2024
  • December 2023
  • November 2023
  • October 2023
  • September 2023
  • August 2023
  • July 2023
  • June 2023
  • May 2023
  • April 2023
  • March 2023
  • February 2023
  • January 2023
  • December 2022
  • November 2022
  • October 2022
  • September 2022
  • August 2022
  • July 2022
  • June 2022
  • May 2022
  • April 2022
  • March 2022
  • February 2022
  • January 2022
  • December 2021
  • November 2021

Categories

  • Apollo Answers
  • Course Introductions
  • Economic Intelligence
  • Hide from Wordpress Search
  • Investment Knowledge
  • Perspectives
  • Redirecting
  • The Daily Spark
  • The View from Apollo
  • The Weekly Brief
  • Uncategorized
  • White Papers

Posts navigation

Page 1 Page 2 … Page 4 Next page→
  • Privacy Notice
  • Terms of Use
  • Forward-Looking Statements
Apollo
© Apollo Global Management, Inc. All Rights Reserved.

The Apollo Academy is for informational and educational purposes only and nothing contained herein should be taken as investment advice or a recommendation to enter into any transaction. They are not an invitation by or on behalf of Apollo to any person to buy or sell any security or to adopt any investment strategy, and shall not form the basis of, nor may it accompany nor form part of, any right or contract to buy or sell any security or to adopt any investment strategy. There is no guarantee that the views and opinions expressed in this website will come to pass. For additional information, please see the disclaimers included in each piece of content or the legal page of our website here.