• Apollo.com
  • Login
  • Register Now
light site-logo
  • The Academy
  • Upcoming Events
        • Upcoming Events

  • Learning Center
        • New & UpdatedAlternative Investing Course 2.0

        • Alternative Investing Essentials Part OnePrivate Equity, Venture Capital, Private Credit
        • Alternative Investing Essentials Part TwoReal Estate, Infrastructure, Digital Assets, Hedge Funds
        • Practical ConsiderationsAsset Allocation, Risk Considerations, Fund Structures, Fees
        • Introductory Videos

          View All Videos

        •  Recent Classes & Videos

        • • Mid-Year Outlook: At the Crossroads of Stagflation — What’s Next?
        • • Hybrid Investments: Flexible Structures for Volatile Times
        • • Private Credit Investing in Volatile Times
        • • Potential Implications of the Latest US Administration Policy Proposals
        • • Beyond 60/40: Private Assets in an Era of High Public Valuations
        • • Investment Grade Private Credit as a Core Fixed Income Allocation
        • View All Classes

  • Alternative Perspectives
        • Investment Knowledge
        • The View from Apollo
          • Investment Knowledge White Papers

            Mid-Year Outlook: At the Crossroads of Stagflation—What’s Next?

            June 23, 2025
          • The View From Apollo

            Another Chance to Position Portfolios for Tariff Turmoil?

            July 17, 2025
          • Investment Knowledge White Papers

            The Continental Shift: Europe’s Private Credit Moment

            June 20, 2025
  • The Daily Spark
        • Read The Daily Spark Blog


        • Want it delivered daily to your inbox?
          • The Daily Spark

            90% of US Power Capacity Installations Are Renewables

            July 19, 2025
          • The Daily Spark

            Comparing Wage Growth for Job Stayers and Job Switchers

            July 18, 2025
          • The Daily Spark

            Different Retirement Systems in Europe

            July 17, 2025
  • Register for Apollo Academy: Alternative Investing Course
  • Login
  • About Apollo Academy
  • Upcoming Events
  • Learning Center
  • Alternative Perspectives
  • The Daily Spark
  • Register for Apollo Academy: Alternative Investing Course
  • Login
  • Alternative Investing Course 2.0
  • Mid-Year Outlook: At the Crossroads of Stagflation — What’s Next?
  • Hybrid Investments: Flexible Structures for Volatile Times
  • Private Credit Investing in Volatile Times
  • Potential Implications of the Latest US Administration Policy Proposals
  • Beyond 60/40: Private Assets in an Era of High Public Valuations
  • Investment Grade Private Credit as a Core Fixed Income Allocation
  • View All Classes
  • Introductory Videos
  • Alternative Investing Essentials Part One • Now Available On Demand
  • Alternative Investing Essentials Part Two • Now Available On Demand
  • Practical Considerations • Now Available On Demand
  • Investment Knowledge
  • The View from Apollo
Home December 2024

Term Premium Up 75 Basis Points in Three Months

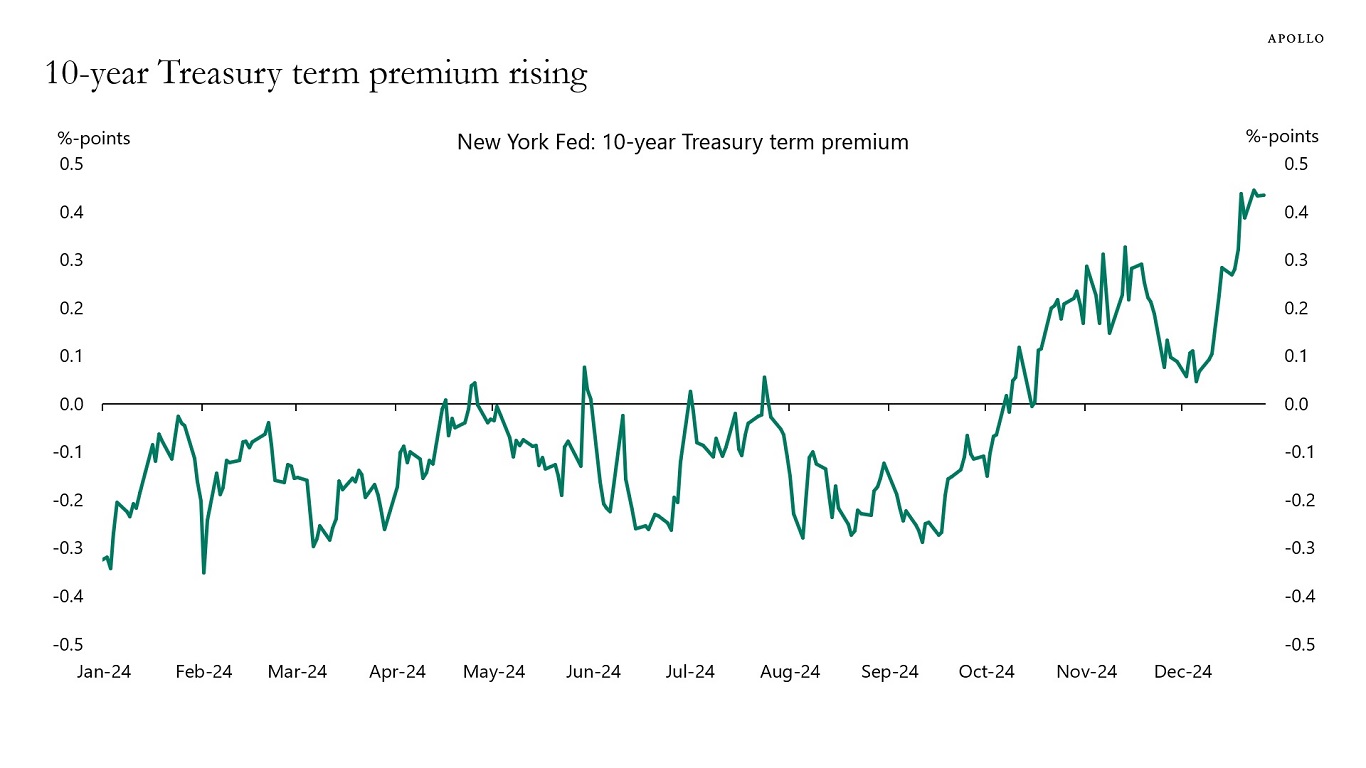
The term premium for 10-year Treasuries has increased 75 basis points (bps) over the past three months, see chart below.

In other words, 10-year rates have increased an additional 75 bps more than what can be justified by changing Fed expectations, which is likely a reflection of emerging fears in markets about US fiscal sustainability.

Combined with the significant decline in the Fed’s Reverse Repo Facility (RRP) usage and the dramatic increase in T-bill issuance in 2024 (which needs to be rolled over into longer duration), the risks are rising that rates markets will be more volatile in 2025.

10-year Treasury term premium rising
Note: The NY Fed measure for the term premium is based on a five-factor, no-arbitrage term structure model. Source: New York Fed, Bloomberg, Apollo Chief Economist

Download high-res chart

Recent Posts

  • 90% of US Power Capacity Installations Are Renewables
  • Comparing Wage Growth for Job Stayers and Job Switchers
  • Another Chance to Position Portfolios for Tariff Turmoil?
  • Different Retirement Systems in Europe
  • AI Bubble Today Is Bigger Than the IT Bubble in the 1990s

Recent Comments

No comments to show.

Archives

  • July 2025
  • June 2025
  • May 2025
  • April 2025
  • March 2025
  • February 2025
  • January 2025
  • December 2024
  • November 2024
  • October 2024
  • September 2024
  • August 2024
  • July 2024
  • June 2024
  • May 2024
  • April 2024
  • March 2024
  • February 2024
  • January 2024
  • December 2023
  • November 2023
  • October 2023
  • September 2023
  • August 2023
  • July 2023
  • June 2023
  • May 2023
  • April 2023
  • March 2023
  • February 2023
  • January 2023
  • December 2022
  • November 2022
  • October 2022
  • September 2022
  • August 2022
  • July 2022
  • June 2022
  • May 2022
  • April 2022
  • March 2022
  • February 2022
  • January 2022
  • December 2021
  • November 2021

Categories

  • Apollo Answers
  • Course Introductions
  • Economic Intelligence
  • Hide from Wordpress Search
  • Investment Knowledge
  • Perspectives
  • Redirecting
  • The Daily Spark
  • The View from Apollo
  • The Weekly Brief
  • Uncategorized
  • White Papers

$417 for a Hotel Room in New York

The average daily rate for a hotel in New York is at a record-high of $417, see chart below.

The average daily rate for New York hotels: $417
Source: CoStar, Apollo Chief Economist

Download high-res chart

Recent Posts

  • 90% of US Power Capacity Installations Are Renewables
  • Comparing Wage Growth for Job Stayers and Job Switchers
  • Another Chance to Position Portfolios for Tariff Turmoil?
  • Different Retirement Systems in Europe
  • AI Bubble Today Is Bigger Than the IT Bubble in the 1990s

Recent Comments

No comments to show.

Archives

  • July 2025
  • June 2025
  • May 2025
  • April 2025
  • March 2025
  • February 2025
  • January 2025
  • December 2024
  • November 2024
  • October 2024
  • September 2024
  • August 2024
  • July 2024
  • June 2024
  • May 2024
  • April 2024
  • March 2024
  • February 2024
  • January 2024
  • December 2023
  • November 2023
  • October 2023
  • September 2023
  • August 2023
  • July 2023
  • June 2023
  • May 2023
  • April 2023
  • March 2023
  • February 2023
  • January 2023
  • December 2022
  • November 2022
  • October 2022
  • September 2022
  • August 2022
  • July 2022
  • June 2022
  • May 2022
  • April 2022
  • March 2022
  • February 2022
  • January 2022
  • December 2021
  • November 2021

Categories

  • Apollo Answers
  • Course Introductions
  • Economic Intelligence
  • Hide from Wordpress Search
  • Investment Knowledge
  • Perspectives
  • Redirecting
  • The Daily Spark
  • The View from Apollo
  • The Weekly Brief
  • Uncategorized
  • White Papers

US and Europe Decoupling

The US and European business cycles are decoupling, it is highly unusual, see chart below.

Strong divergence between the US outlook and the outlook for Europe
Source: Bloomberg, Apollo Chief Economist

Download high-res chart

Recent Posts

  • 90% of US Power Capacity Installations Are Renewables
  • Comparing Wage Growth for Job Stayers and Job Switchers
  • Another Chance to Position Portfolios for Tariff Turmoil?
  • Different Retirement Systems in Europe
  • AI Bubble Today Is Bigger Than the IT Bubble in the 1990s

Recent Comments

No comments to show.

Archives

  • July 2025
  • June 2025
  • May 2025
  • April 2025
  • March 2025
  • February 2025
  • January 2025
  • December 2024
  • November 2024
  • October 2024
  • September 2024
  • August 2024
  • July 2024
  • June 2024
  • May 2024
  • April 2024
  • March 2024
  • February 2024
  • January 2024
  • December 2023
  • November 2023
  • October 2023
  • September 2023
  • August 2023
  • July 2023
  • June 2023
  • May 2023
  • April 2023
  • March 2023
  • February 2023
  • January 2023
  • December 2022
  • November 2022
  • October 2022
  • September 2022
  • August 2022
  • July 2022
  • June 2022
  • May 2022
  • April 2022
  • March 2022
  • February 2022
  • January 2022
  • December 2021
  • November 2021

Categories

  • Apollo Answers
  • Course Introductions
  • Economic Intelligence
  • Hide from Wordpress Search
  • Investment Knowledge
  • Perspectives
  • Redirecting
  • The Daily Spark
  • The View from Apollo
  • The Weekly Brief
  • Uncategorized
  • White Papers

The Median US Home Is 40 Years Old

The housing stock in the US is getting older, and the median age of a home is now 40 years, up from 31 years in 2005, see chart below.

The median age of a home in the United States is 40 years
Source: 2005-2019, 2021-2022 American Community Survey Estimates, Apollo Chief Economist

Download high-res chart

Recent Posts

  • 90% of US Power Capacity Installations Are Renewables
  • Comparing Wage Growth for Job Stayers and Job Switchers
  • Another Chance to Position Portfolios for Tariff Turmoil?
  • Different Retirement Systems in Europe
  • AI Bubble Today Is Bigger Than the IT Bubble in the 1990s

Recent Comments

No comments to show.

Archives

  • July 2025
  • June 2025
  • May 2025
  • April 2025
  • March 2025
  • February 2025
  • January 2025
  • December 2024
  • November 2024
  • October 2024
  • September 2024
  • August 2024
  • July 2024
  • June 2024
  • May 2024
  • April 2024
  • March 2024
  • February 2024
  • January 2024
  • December 2023
  • November 2023
  • October 2023
  • September 2023
  • August 2023
  • July 2023
  • June 2023
  • May 2023
  • April 2023
  • March 2023
  • February 2023
  • January 2023
  • December 2022
  • November 2022
  • October 2022
  • September 2022
  • August 2022
  • July 2022
  • June 2022
  • May 2022
  • April 2022
  • March 2022
  • February 2022
  • January 2022
  • December 2021
  • November 2021

Categories

  • Apollo Answers
  • Course Introductions
  • Economic Intelligence
  • Hide from Wordpress Search
  • Investment Knowledge
  • Perspectives
  • Redirecting
  • The Daily Spark
  • The View from Apollo
  • The Weekly Brief
  • Uncategorized
  • White Papers

Corporate CFOs More Optimistic

The latest CFO survey by Duke University and the Federal Reserve Banks of Richmond and Atlanta shows rising optimism regarding the economy and their own company, see chart below.

CFO optimism rising
Source: Duke University, FRB Richmond, FRB Atlanta, Haver Analytics, Apollo Chief Economist

Download high-res chart

Recent Posts

  • 90% of US Power Capacity Installations Are Renewables
  • Comparing Wage Growth for Job Stayers and Job Switchers
  • Another Chance to Position Portfolios for Tariff Turmoil?
  • Different Retirement Systems in Europe
  • AI Bubble Today Is Bigger Than the IT Bubble in the 1990s

Recent Comments

No comments to show.

Archives

  • July 2025
  • June 2025
  • May 2025
  • April 2025
  • March 2025
  • February 2025
  • January 2025
  • December 2024
  • November 2024
  • October 2024
  • September 2024
  • August 2024
  • July 2024
  • June 2024
  • May 2024
  • April 2024
  • March 2024
  • February 2024
  • January 2024
  • December 2023
  • November 2023
  • October 2023
  • September 2023
  • August 2023
  • July 2023
  • June 2023
  • May 2023
  • April 2023
  • March 2023
  • February 2023
  • January 2023
  • December 2022
  • November 2022
  • October 2022
  • September 2022
  • August 2022
  • July 2022
  • June 2022
  • May 2022
  • April 2022
  • March 2022
  • February 2022
  • January 2022
  • December 2021
  • November 2021

Categories

  • Apollo Answers
  • Course Introductions
  • Economic Intelligence
  • Hide from Wordpress Search
  • Investment Knowledge
  • Perspectives
  • Redirecting
  • The Daily Spark
  • The View from Apollo
  • The Weekly Brief
  • Uncategorized
  • White Papers

The S&P 500 Diversification Illusion

The finance textbook says that investors should diversify their investments. But there is little diversification today when buying the S&P 500. The combined weight of stocks with a weight of 3% or more in the S&P 500 index is at an all-time high and continues to rise, see chart below.

The bottom line is that buying the S&P 500 gives the impression that you are buying 500 different stocks and diversifying your investments. But the reality is that the high and growing concentration in the S&P 500 continues to be a major problem.

In short, investors should ensure that their portfolio is not all levered to Nvidia earnings.

S&P 500: High concentration continues to be a problem
Sources: Bloomberg, Apollo Chief Economist

Download high-res chart

Recent Posts

  • 90% of US Power Capacity Installations Are Renewables
  • Comparing Wage Growth for Job Stayers and Job Switchers
  • Another Chance to Position Portfolios for Tariff Turmoil?
  • Different Retirement Systems in Europe
  • AI Bubble Today Is Bigger Than the IT Bubble in the 1990s

Recent Comments

No comments to show.

Archives

  • July 2025
  • June 2025
  • May 2025
  • April 2025
  • March 2025
  • February 2025
  • January 2025
  • December 2024
  • November 2024
  • October 2024
  • September 2024
  • August 2024
  • July 2024
  • June 2024
  • May 2024
  • April 2024
  • March 2024
  • February 2024
  • January 2024
  • December 2023
  • November 2023
  • October 2023
  • September 2023
  • August 2023
  • July 2023
  • June 2023
  • May 2023
  • April 2023
  • March 2023
  • February 2023
  • January 2023
  • December 2022
  • November 2022
  • October 2022
  • September 2022
  • August 2022
  • July 2022
  • June 2022
  • May 2022
  • April 2022
  • March 2022
  • February 2022
  • January 2022
  • December 2021
  • November 2021

Categories

  • Apollo Answers
  • Course Introductions
  • Economic Intelligence
  • Hide from Wordpress Search
  • Investment Knowledge
  • Perspectives
  • Redirecting
  • The Daily Spark
  • The View from Apollo
  • The Weekly Brief
  • Uncategorized
  • White Papers

Why Did Car Sales Not Decline When the Fed Raised Interest Rates?

Autos are usually one of the most interest-rate-sensitive sectors in the economy. When the Fed raises interest rates, you would expect car sales to decline.

But that is not what has happened during this cycle.

Instead, car sales have been going up despite the Fed raising interest rates from zero to 5.5% over a short period.

The source of strong demand for cars has been robust income growth, low unemployment, households having excess savings after the pandemic, and significant increases in stock prices and home prices, leading to a higher share of cars purchased with cash.

Combined with the Fed now cutting interest rates, the outlook for car sales continues to be strong, see also the steady increase in car sales since the Fed began to cut interest rates in September.

When interest rates go up, car sales should go down. But that is not what has happened.
Source: WARD’s Automotive Group, Bloomberg, Apollo Chief Economist

Download high res chart

Recent Posts

  • 90% of US Power Capacity Installations Are Renewables
  • Comparing Wage Growth for Job Stayers and Job Switchers
  • Another Chance to Position Portfolios for Tariff Turmoil?
  • Different Retirement Systems in Europe
  • AI Bubble Today Is Bigger Than the IT Bubble in the 1990s

Recent Comments

No comments to show.

Archives

  • July 2025
  • June 2025
  • May 2025
  • April 2025
  • March 2025
  • February 2025
  • January 2025
  • December 2024
  • November 2024
  • October 2024
  • September 2024
  • August 2024
  • July 2024
  • June 2024
  • May 2024
  • April 2024
  • March 2024
  • February 2024
  • January 2024
  • December 2023
  • November 2023
  • October 2023
  • September 2023
  • August 2023
  • July 2023
  • June 2023
  • May 2023
  • April 2023
  • March 2023
  • February 2023
  • January 2023
  • December 2022
  • November 2022
  • October 2022
  • September 2022
  • August 2022
  • July 2022
  • June 2022
  • May 2022
  • April 2022
  • March 2022
  • February 2022
  • January 2022
  • December 2021
  • November 2021

Categories

  • Apollo Answers
  • Course Introductions
  • Economic Intelligence
  • Hide from Wordpress Search
  • Investment Knowledge
  • Perspectives
  • Redirecting
  • The Daily Spark
  • The View from Apollo
  • The Weekly Brief
  • Uncategorized
  • White Papers

Risks in 2025

Below is a list of risks to markets in 2025, including the probability that each risk materializes.

Risks to global markets in 2025
Note: Probabilities do not add up to 100%. Several risks can materialize at the same time. Source: Apollo Chief Economist

Download high-res chart

Recent Posts

  • 90% of US Power Capacity Installations Are Renewables
  • Comparing Wage Growth for Job Stayers and Job Switchers
  • Another Chance to Position Portfolios for Tariff Turmoil?
  • Different Retirement Systems in Europe
  • AI Bubble Today Is Bigger Than the IT Bubble in the 1990s

Recent Comments

No comments to show.

Archives

  • July 2025
  • June 2025
  • May 2025
  • April 2025
  • March 2025
  • February 2025
  • January 2025
  • December 2024
  • November 2024
  • October 2024
  • September 2024
  • August 2024
  • July 2024
  • June 2024
  • May 2024
  • April 2024
  • March 2024
  • February 2024
  • January 2024
  • December 2023
  • November 2023
  • October 2023
  • September 2023
  • August 2023
  • July 2023
  • June 2023
  • May 2023
  • April 2023
  • March 2023
  • February 2023
  • January 2023
  • December 2022
  • November 2022
  • October 2022
  • September 2022
  • August 2022
  • July 2022
  • June 2022
  • May 2022
  • April 2022
  • March 2022
  • February 2022
  • January 2022
  • December 2021
  • November 2021

Categories

  • Apollo Answers
  • Course Introductions
  • Economic Intelligence
  • Hide from Wordpress Search
  • Investment Knowledge
  • Perspectives
  • Redirecting
  • The Daily Spark
  • The View from Apollo
  • The Weekly Brief
  • Uncategorized
  • White Papers

2.7 Million People Work in the Federal Government

Total employment in the federal government is 2.7 million, and the total cost of wages and salaries is roughly $400 billion.

The chart below shows that most federal government workers are in the US Postal Service, Veterans Affairs, Homeland Security, and the Army, Navy, Air Force, and Department of Defense.

2.7 million people work in the federal government
Source: US Office of Personnel Management, BLS, Haver Analytics, Apollo Chief Economist

Download high-res chart

Recent Posts

  • 90% of US Power Capacity Installations Are Renewables
  • Comparing Wage Growth for Job Stayers and Job Switchers
  • Another Chance to Position Portfolios for Tariff Turmoil?
  • Different Retirement Systems in Europe
  • AI Bubble Today Is Bigger Than the IT Bubble in the 1990s

Recent Comments

No comments to show.

Archives

  • July 2025
  • June 2025
  • May 2025
  • April 2025
  • March 2025
  • February 2025
  • January 2025
  • December 2024
  • November 2024
  • October 2024
  • September 2024
  • August 2024
  • July 2024
  • June 2024
  • May 2024
  • April 2024
  • March 2024
  • February 2024
  • January 2024
  • December 2023
  • November 2023
  • October 2023
  • September 2023
  • August 2023
  • July 2023
  • June 2023
  • May 2023
  • April 2023
  • March 2023
  • February 2023
  • January 2023
  • December 2022
  • November 2022
  • October 2022
  • September 2022
  • August 2022
  • July 2022
  • June 2022
  • May 2022
  • April 2022
  • March 2022
  • February 2022
  • January 2022
  • December 2021
  • November 2021

Categories

  • Apollo Answers
  • Course Introductions
  • Economic Intelligence
  • Hide from Wordpress Search
  • Investment Knowledge
  • Perspectives
  • Redirecting
  • The Daily Spark
  • The View from Apollo
  • The Weekly Brief
  • Uncategorized
  • White Papers

The Number One Theme for Markets in 2025

The first chart below shows that the FOMC continues to revise higher where they think the Fed funds rate will be by the end of 2026.

The second chart shows that the Fed continues to revise higher where they think the Fed funds rate will be in the long run.

The third chart shows that the market continues to revise higher where it thinks the Fed funds rate is going.

The entire purpose of the Fed in keeping interest rates higher for longer is to slow down consumer spending, capex spending, and corporate earnings so that inflation begins to move lower toward the Fed’s 2% inflation target. 

The bottom line is that interest rates staying higher for longer is the number one theme in markets as we enter 2025.

This has significant implications for asset allocation and portfolio construction because the most important variable in the finance textbook is the risk-free interest rate. When the risk-free rate goes up, it raises the bar for returns on equities, particularly in a situation where returns in equities have been driven entirely by a handful of tech stocks. In short, higher for longer has important implications for how investors should think about debt versus equity in 2025.

FOMC expectations to where the Fed funds rate will be by the end of 2026
Sources: Bloomberg, Apollo Chief Economist
The Fed continues to revise higher its estimate of where the Fed funds rate will be in the long run
Sources: Federal Reserve Board, Apollo Chief Economist
Markets have been revising higher their estimates of where rates are going
Sources: Federal Reserve Board, Bloomberg, Apollo Chief Economist

Download high-res charts

Recent Posts

  • 90% of US Power Capacity Installations Are Renewables
  • Comparing Wage Growth for Job Stayers and Job Switchers
  • Another Chance to Position Portfolios for Tariff Turmoil?
  • Different Retirement Systems in Europe
  • AI Bubble Today Is Bigger Than the IT Bubble in the 1990s

Recent Comments

No comments to show.

Archives

  • July 2025
  • June 2025
  • May 2025
  • April 2025
  • March 2025
  • February 2025
  • January 2025
  • December 2024
  • November 2024
  • October 2024
  • September 2024
  • August 2024
  • July 2024
  • June 2024
  • May 2024
  • April 2024
  • March 2024
  • February 2024
  • January 2024
  • December 2023
  • November 2023
  • October 2023
  • September 2023
  • August 2023
  • July 2023
  • June 2023
  • May 2023
  • April 2023
  • March 2023
  • February 2023
  • January 2023
  • December 2022
  • November 2022
  • October 2022
  • September 2022
  • August 2022
  • July 2022
  • June 2022
  • May 2022
  • April 2022
  • March 2022
  • February 2022
  • January 2022
  • December 2021
  • November 2021

Categories

  • Apollo Answers
  • Course Introductions
  • Economic Intelligence
  • Hide from Wordpress Search
  • Investment Knowledge
  • Perspectives
  • Redirecting
  • The Daily Spark
  • The View from Apollo
  • The Weekly Brief
  • Uncategorized
  • White Papers

Posts navigation

Page 1 Page 2 … Page 4 Next page→
  • Privacy Notice
  • Terms of Use
  • Forward-Looking Statements
Apollo
© Apollo Global Management, Inc. All Rights Reserved.

The Apollo Academy is for informational and educational purposes only and nothing contained herein should be taken as investment advice or a recommendation to enter into any transaction. They are not an invitation by or on behalf of Apollo to any person to buy or sell any security or to adopt any investment strategy, and shall not form the basis of, nor may it accompany nor form part of, any right or contract to buy or sell any security or to adopt any investment strategy. There is no guarantee that the views and opinions expressed in this website will come to pass. For additional information, please see the disclaimers included in each piece of content or the legal page of our website here.