• Apollo.com
  • Login
  • Register Now
light site-logo
  • The Academy
  • Upcoming Events
        • Upcoming Events

  • Learning Center
        • New & UpdatedAlternative Investing Course 2.0

        • Alternative Investing Essentials Part OnePrivate Equity, Venture Capital, Private Credit
        • Alternative Investing Essentials Part TwoReal Estate, Infrastructure, Digital Assets, Hedge Funds
        • Practical ConsiderationsAsset Allocation, Risk Considerations, Fund Structures, Fees
        • Introductory Videos

          View All Videos

        •  Recent Classes & Videos

        • • Mid-Year Outlook: At the Crossroads of Stagflation — What’s Next?
        • • Hybrid Investments: Flexible Structures for Volatile Times
        • • Private Credit Investing in Volatile Times
        • • Potential Implications of the Latest US Administration Policy Proposals
        • • Beyond 60/40: Private Assets in an Era of High Public Valuations
        • • Investment Grade Private Credit as a Core Fixed Income Allocation
        • View All Classes

  • Alternative Perspectives
        • Investment Knowledge
        • The View from Apollo
          • Investment Knowledge White Papers

            Mid-Year Outlook: At the Crossroads of Stagflation—What’s Next?

            June 23, 2025
          • The View From Apollo

            Mid-Year Outlook: At the Crossroads of Stagflation—What’s Next?

            June 27, 2025
          • Investment Knowledge White Papers

            The Continental Shift: Europe’s Private Credit Moment

            June 20, 2025
  • The Daily Spark
        • Read The Daily Spark Blog


        • Want it delivered daily to your inbox?
          • The Daily Spark

            China Selling Less to the US and More to Europe, Asia, and Latin America

            July 7, 2025
          • The Daily Spark

            The 10% Depreciation in the Dollar Will Boost Inflation by 0.3 Percentage Points

            July 6, 2025
          • The Daily Spark

            Outlook for the Dollar After Section 899

            July 5, 2025
  • Register for Apollo Academy: Alternative Investing Course
  • Login
  • About Apollo Academy
  • Upcoming Events
  • Learning Center
  • Alternative Perspectives
  • The Daily Spark
  • Register for Apollo Academy: Alternative Investing Course
  • Login
  • Alternative Investing Course 2.0
  • Mid-Year Outlook: At the Crossroads of Stagflation — What’s Next?
  • Hybrid Investments: Flexible Structures for Volatile Times
  • Private Credit Investing in Volatile Times
  • Potential Implications of the Latest US Administration Policy Proposals
  • Beyond 60/40: Private Assets in an Era of High Public Valuations
  • Investment Grade Private Credit as a Core Fixed Income Allocation
  • View All Classes
  • Introductory Videos
  • Alternative Investing Essentials Part One • Now Available On Demand
  • Alternative Investing Essentials Part Two • Now Available On Demand
  • Practical Considerations • Now Available On Demand
  • Investment Knowledge
  • The View from Apollo
Home February 2025

Recession Probability Rising

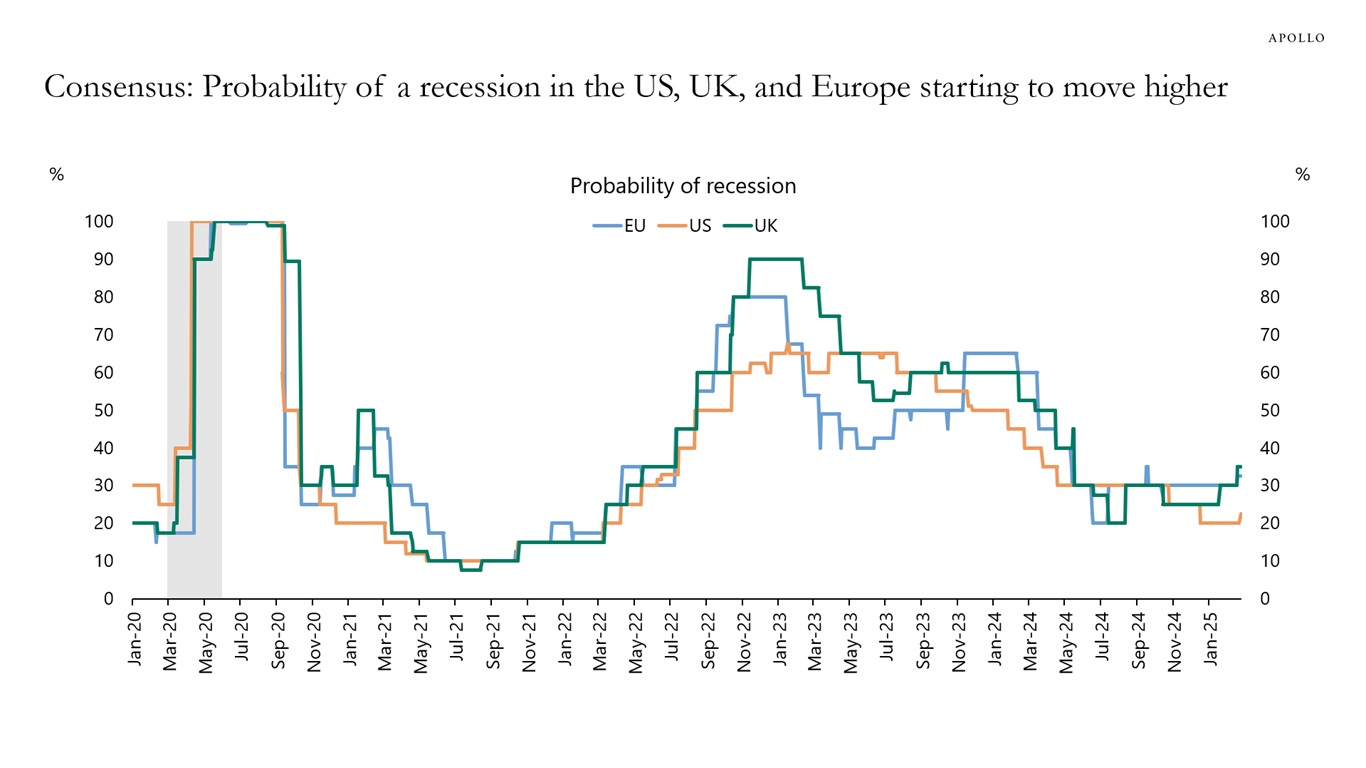
Since 2023, the likelihood of a recession has declined steadily. But in recent weeks, the probability of a recession over the next 12 months has ticked higher in the US, UK, and Europe, see chart below.

Consensus: Probability of a recession in the US, UK, and Europe starting to move higher
Source: Bloomberg, Apollo Chief Economist

Download high-res chart

Recent Posts

  • China Selling Less to the US and More to Europe, Asia, and Latin America
  • The 10% Depreciation in the Dollar Will Boost Inflation by 0.3 Percentage Points
  • Outlook for the Dollar After Section 899
  • 45 Million People Have a Student Loan, 24% Are Delinquent
  • Unemployment Rate Expected to Move Higher

Recent Comments

No comments to show.

Archives

  • July 2025
  • June 2025
  • May 2025
  • April 2025
  • March 2025
  • February 2025
  • January 2025
  • December 2024
  • November 2024
  • October 2024
  • September 2024
  • August 2024
  • July 2024
  • June 2024
  • May 2024
  • April 2024
  • March 2024
  • February 2024
  • January 2024
  • December 2023
  • November 2023
  • October 2023
  • September 2023
  • August 2023
  • July 2023
  • June 2023
  • May 2023
  • April 2023
  • March 2023
  • February 2023
  • January 2023
  • December 2022
  • November 2022
  • October 2022
  • September 2022
  • August 2022
  • July 2022
  • June 2022
  • May 2022
  • April 2022
  • March 2022
  • February 2022
  • January 2022
  • December 2021
  • November 2021

Categories

  • Apollo Answers
  • Course Introductions
  • Economic Intelligence
  • Hide from Wordpress Search
  • Investment Knowledge
  • Perspectives
  • Redirecting
  • The Daily Spark
  • The View from Apollo
  • The Weekly Brief
  • Uncategorized
  • White Papers

Sentiment Bad, Hard Data Good: How Long Can It Continue?

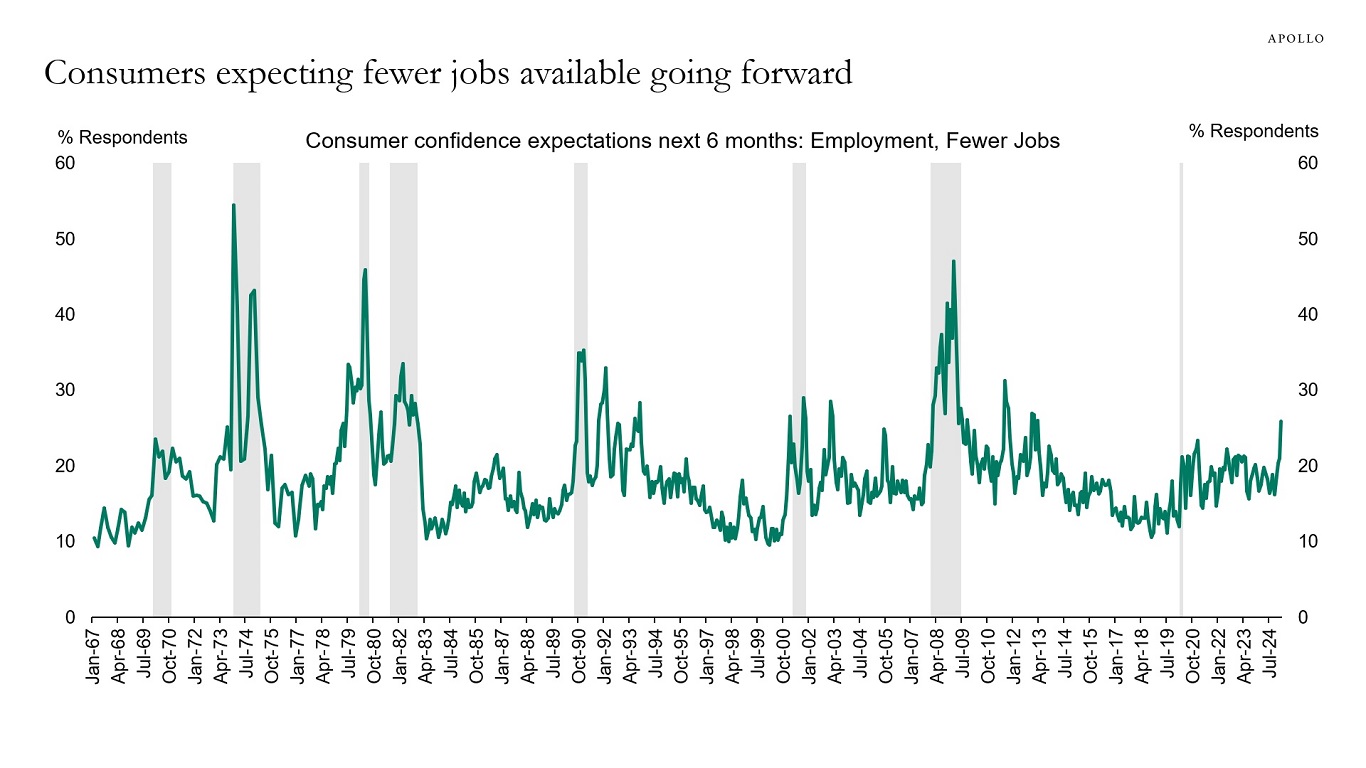
The Conference Board consumer confidence survey for February shows a big jump in the share of consumers who are worried about fewer jobs being available, see the first chart below.

Total employment in the US economy is about 160 million. With 3 million federal employees potentially worrying about their jobs and 6 million federal contractors worrying about their jobs, the risks are rising that households may begin to hold back purchases of cars, computers, washers, dryers, vacation travel plans, etc.

We remain bullish on the economic outlook, but we are very carefully watching the incoming data for signs if this is an inflection point for the business cycle.

On Saturday, we will be publishing our usual daily and weekly indicators for the US economy to monitor if the weakness in sentiment seen in the charts below is starting to show up in actual spending decisions for consumers and firms.

Consumers expecting fewer jobs available going forward
Source: Conference Board, Haver Analytics, Apollo Chief Economist
IG spreads are disconnected from the economic policy uncertainty index
Source: Bloomberg, Apollo Chief Economist

Download high-res charts

Recent Posts

  • China Selling Less to the US and More to Europe, Asia, and Latin America
  • The 10% Depreciation in the Dollar Will Boost Inflation by 0.3 Percentage Points
  • Outlook for the Dollar After Section 899
  • 45 Million People Have a Student Loan, 24% Are Delinquent
  • Unemployment Rate Expected to Move Higher

Recent Comments

No comments to show.

Archives

  • July 2025
  • June 2025
  • May 2025
  • April 2025
  • March 2025
  • February 2025
  • January 2025
  • December 2024
  • November 2024
  • October 2024
  • September 2024
  • August 2024
  • July 2024
  • June 2024
  • May 2024
  • April 2024
  • March 2024
  • February 2024
  • January 2024
  • December 2023
  • November 2023
  • October 2023
  • September 2023
  • August 2023
  • July 2023
  • June 2023
  • May 2023
  • April 2023
  • March 2023
  • February 2023
  • January 2023
  • December 2022
  • November 2022
  • October 2022
  • September 2022
  • August 2022
  • July 2022
  • June 2022
  • May 2022
  • April 2022
  • March 2022
  • February 2022
  • January 2022
  • December 2021
  • November 2021

Categories

  • Apollo Answers
  • Course Introductions
  • Economic Intelligence
  • Hide from Wordpress Search
  • Investment Knowledge
  • Perspectives
  • Redirecting
  • The Daily Spark
  • The View from Apollo
  • The Weekly Brief
  • Uncategorized
  • White Papers

From Globalization to Segmentation

The world has moved from globalization to segmentation.

Specifically, we have gone from a world of globalization where goods were flowing over borders, people were moving across borders, and the rules for businesses were predictable and harmonized across countries.

In the new world, economies, markets, and policies are more segmented. Tariffs and geopolitical considerations limit the flow of goods. There are more restrictions on immigration. Countries have different industrial policies, which have made the rules for businesses more unpredictable and idiosyncratic.

The consequence of moving from a global economy to a segmented economy consisting of many separate “islands” is permanently higher inflation everywhere. Imported goods are more expensive, domestically produced goods are more expensive, less immigration makes domestic labor more expensive, and different industrial policies in different countries reduce competition.

The bottom line is that globalization was putting downward pressure on inflation. Segmentation, or deglobalization, is putting upward pressure on inflation.

For markets, the conclusion is straightforward. An increasingly segmented global economy is putting structural upward pressure on inflation in goods markets and labor markets, which will keep interest rates structurally higher for longer.

Recent Posts

  • China Selling Less to the US and More to Europe, Asia, and Latin America
  • The 10% Depreciation in the Dollar Will Boost Inflation by 0.3 Percentage Points
  • Outlook for the Dollar After Section 899
  • 45 Million People Have a Student Loan, 24% Are Delinquent
  • Unemployment Rate Expected to Move Higher

Recent Comments

No comments to show.

Archives

  • July 2025
  • June 2025
  • May 2025
  • April 2025
  • March 2025
  • February 2025
  • January 2025
  • December 2024
  • November 2024
  • October 2024
  • September 2024
  • August 2024
  • July 2024
  • June 2024
  • May 2024
  • April 2024
  • March 2024
  • February 2024
  • January 2024
  • December 2023
  • November 2023
  • October 2023
  • September 2023
  • August 2023
  • July 2023
  • June 2023
  • May 2023
  • April 2023
  • March 2023
  • February 2023
  • January 2023
  • December 2022
  • November 2022
  • October 2022
  • September 2022
  • August 2022
  • July 2022
  • June 2022
  • May 2022
  • April 2022
  • March 2022
  • February 2022
  • January 2022
  • December 2021
  • November 2021

Categories

  • Apollo Answers
  • Course Introductions
  • Economic Intelligence
  • Hide from Wordpress Search
  • Investment Knowledge
  • Perspectives
  • Redirecting
  • The Daily Spark
  • The View from Apollo
  • The Weekly Brief
  • Uncategorized
  • White Papers

US Inflation Outlook

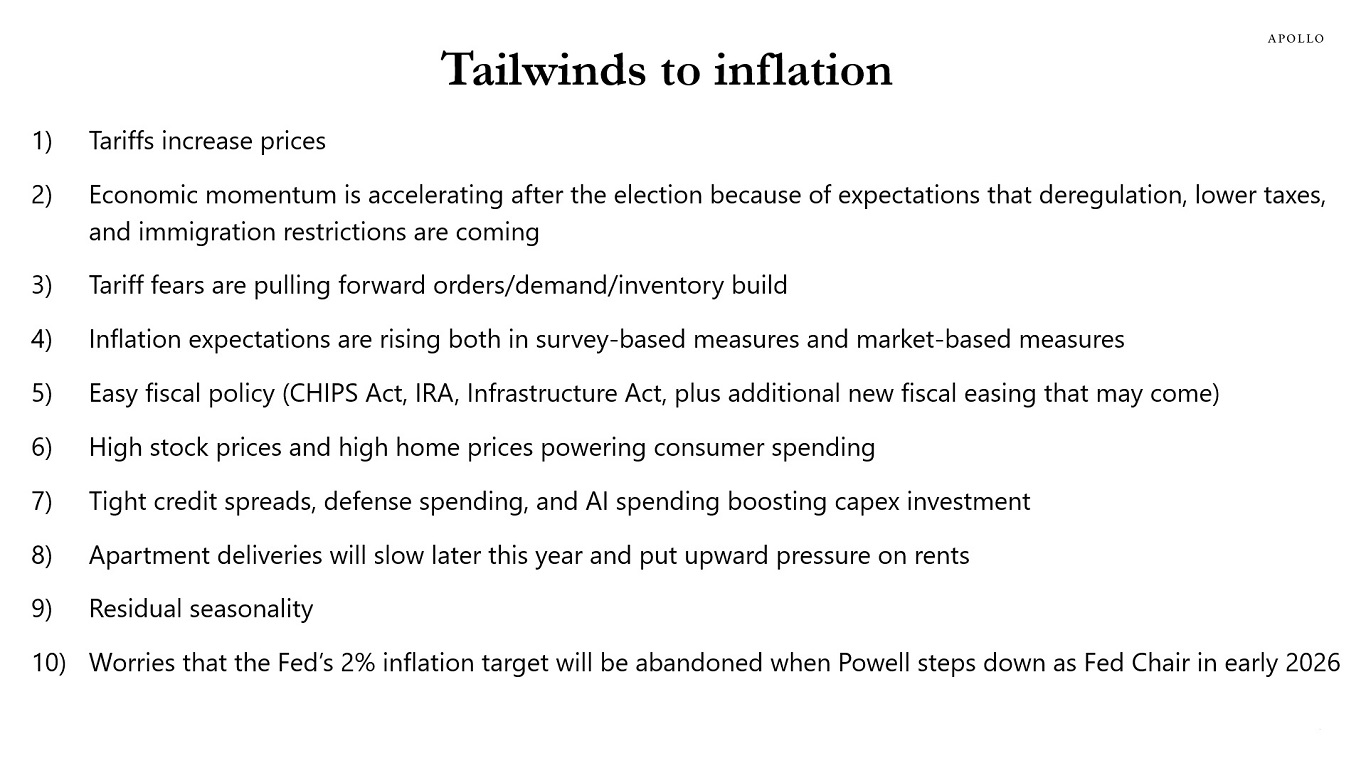
There is a long list of forces pushing inflation higher, including tariffs, rising wage growth, higher inflation expectations, easy fiscal policy, easy financial conditions, residual seasonality, and a slowdown in apartment deliveries putting upward pressure on rents later this year, see complete list below. Our latest inflation outlook is available here.

Tailwinds to inflation
Source: Apollo Chief Economist

Download inflation outlook

Recent Posts

  • China Selling Less to the US and More to Europe, Asia, and Latin America
  • The 10% Depreciation in the Dollar Will Boost Inflation by 0.3 Percentage Points
  • Outlook for the Dollar After Section 899
  • 45 Million People Have a Student Loan, 24% Are Delinquent
  • Unemployment Rate Expected to Move Higher

Recent Comments

No comments to show.

Archives

  • July 2025
  • June 2025
  • May 2025
  • April 2025
  • March 2025
  • February 2025
  • January 2025
  • December 2024
  • November 2024
  • October 2024
  • September 2024
  • August 2024
  • July 2024
  • June 2024
  • May 2024
  • April 2024
  • March 2024
  • February 2024
  • January 2024
  • December 2023
  • November 2023
  • October 2023
  • September 2023
  • August 2023
  • July 2023
  • June 2023
  • May 2023
  • April 2023
  • March 2023
  • February 2023
  • January 2023
  • December 2022
  • November 2022
  • October 2022
  • September 2022
  • August 2022
  • July 2022
  • June 2022
  • May 2022
  • April 2022
  • March 2022
  • February 2022
  • January 2022
  • December 2021
  • November 2021

Categories

  • Apollo Answers
  • Course Introductions
  • Economic Intelligence
  • Hide from Wordpress Search
  • Investment Knowledge
  • Perspectives
  • Redirecting
  • The Daily Spark
  • The View from Apollo
  • The Weekly Brief
  • Uncategorized
  • White Papers

Concentration Keeps Growing in Equity Markets

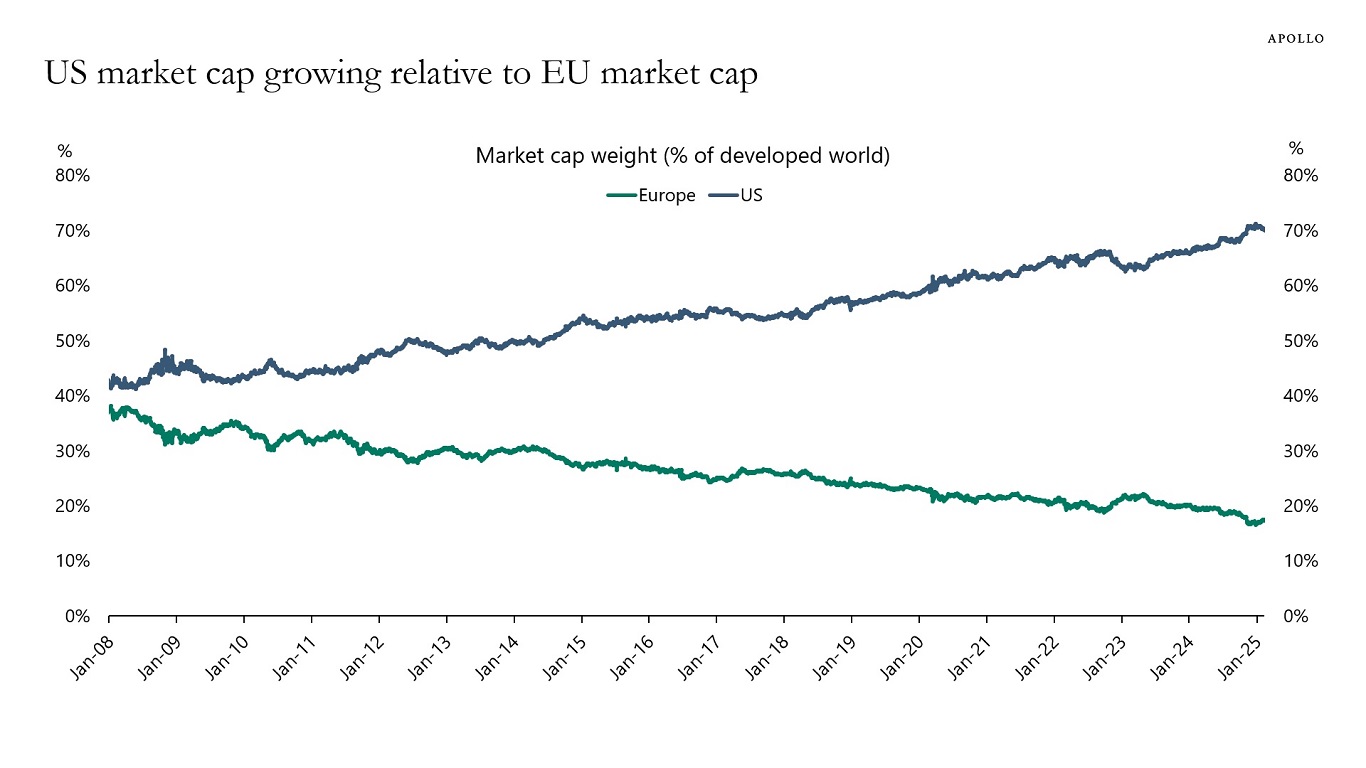
Global equity investors are not only highly concentrated in tech stocks, they are also highly concentrated in US stocks, see chart below. It goes against page one in the finance textbook, which says that investors should be diversified.

US market cap growing relative to EU market cap
Source: MSCI, Bloomberg, Apollo Chief Economist

Download high-res chart

Recent Posts

  • China Selling Less to the US and More to Europe, Asia, and Latin America
  • The 10% Depreciation in the Dollar Will Boost Inflation by 0.3 Percentage Points
  • Outlook for the Dollar After Section 899
  • 45 Million People Have a Student Loan, 24% Are Delinquent
  • Unemployment Rate Expected to Move Higher

Recent Comments

No comments to show.

Archives

  • July 2025
  • June 2025
  • May 2025
  • April 2025
  • March 2025
  • February 2025
  • January 2025
  • December 2024
  • November 2024
  • October 2024
  • September 2024
  • August 2024
  • July 2024
  • June 2024
  • May 2024
  • April 2024
  • March 2024
  • February 2024
  • January 2024
  • December 2023
  • November 2023
  • October 2023
  • September 2023
  • August 2023
  • July 2023
  • June 2023
  • May 2023
  • April 2023
  • March 2023
  • February 2023
  • January 2023
  • December 2022
  • November 2022
  • October 2022
  • September 2022
  • August 2022
  • July 2022
  • June 2022
  • May 2022
  • April 2022
  • March 2022
  • February 2022
  • January 2022
  • December 2021
  • November 2021

Categories

  • Apollo Answers
  • Course Introductions
  • Economic Intelligence
  • Hide from Wordpress Search
  • Investment Knowledge
  • Perspectives
  • Redirecting
  • The Daily Spark
  • The View from Apollo
  • The Weekly Brief
  • Uncategorized
  • White Papers

Steep Maturity Wall for CRE for the Next Three Years

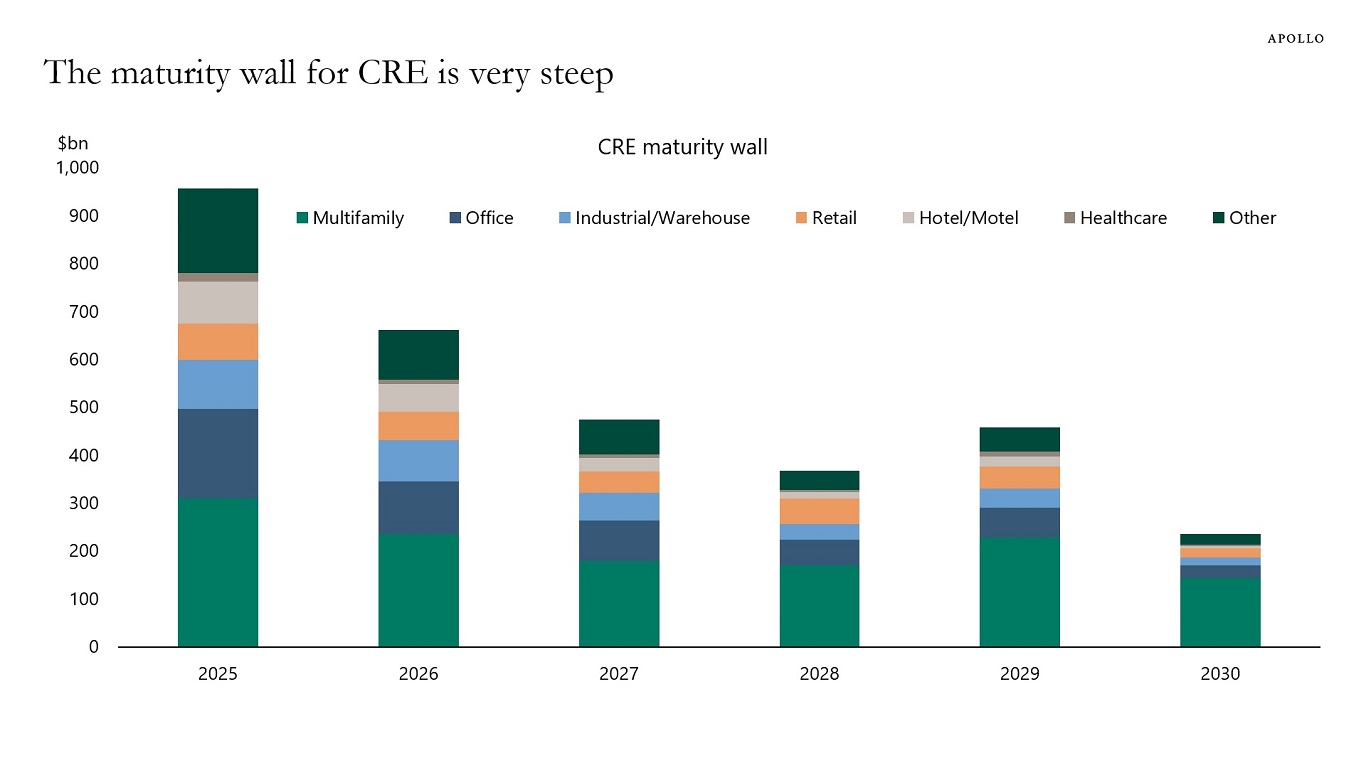
Rates higher for longer continues to be a headwind to the outlook for CRE, see chart below.

The maturity wall for CRE is very steep
Source: Mortgage Bankers Association, Apollo Chief Economist

Download high-res chart

Recent Posts

  • China Selling Less to the US and More to Europe, Asia, and Latin America
  • The 10% Depreciation in the Dollar Will Boost Inflation by 0.3 Percentage Points
  • Outlook for the Dollar After Section 899
  • 45 Million People Have a Student Loan, 24% Are Delinquent
  • Unemployment Rate Expected to Move Higher

Recent Comments

No comments to show.

Archives

  • July 2025
  • June 2025
  • May 2025
  • April 2025
  • March 2025
  • February 2025
  • January 2025
  • December 2024
  • November 2024
  • October 2024
  • September 2024
  • August 2024
  • July 2024
  • June 2024
  • May 2024
  • April 2024
  • March 2024
  • February 2024
  • January 2024
  • December 2023
  • November 2023
  • October 2023
  • September 2023
  • August 2023
  • July 2023
  • June 2023
  • May 2023
  • April 2023
  • March 2023
  • February 2023
  • January 2023
  • December 2022
  • November 2022
  • October 2022
  • September 2022
  • August 2022
  • July 2022
  • June 2022
  • May 2022
  • April 2022
  • March 2022
  • February 2022
  • January 2022
  • December 2021
  • November 2021

Categories

  • Apollo Answers
  • Course Introductions
  • Economic Intelligence
  • Hide from Wordpress Search
  • Investment Knowledge
  • Perspectives
  • Redirecting
  • The Daily Spark
  • The View from Apollo
  • The Weekly Brief
  • Uncategorized
  • White Papers

Downside Risks Intensifying

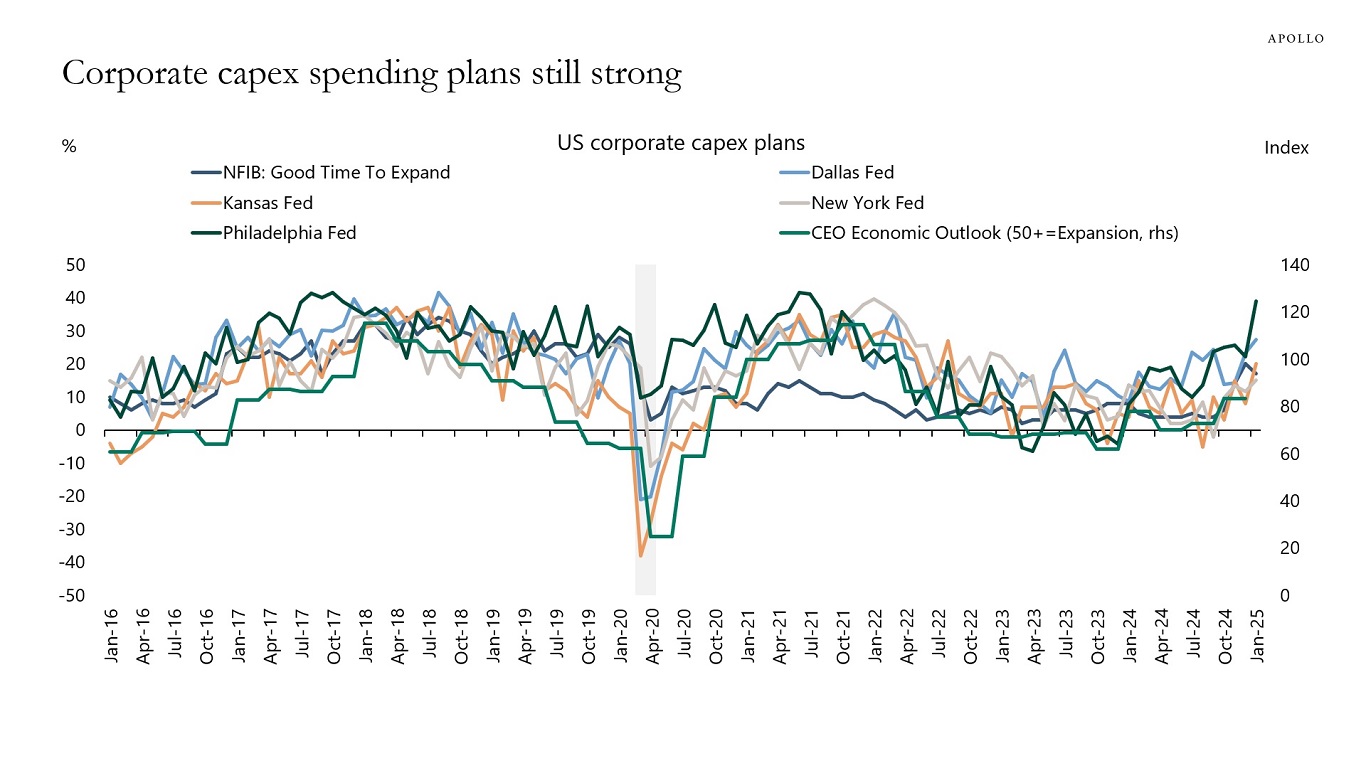
The incoming economic data remains strong. But we are starting to worry about the downside risks to the economy and markets from: 1) the impact of DOGE layoffs and contract cuts on jobless claims and 2) persistently elevated policy uncertainty weighing on capex spending decisions and hiring decisions.

Specifically:

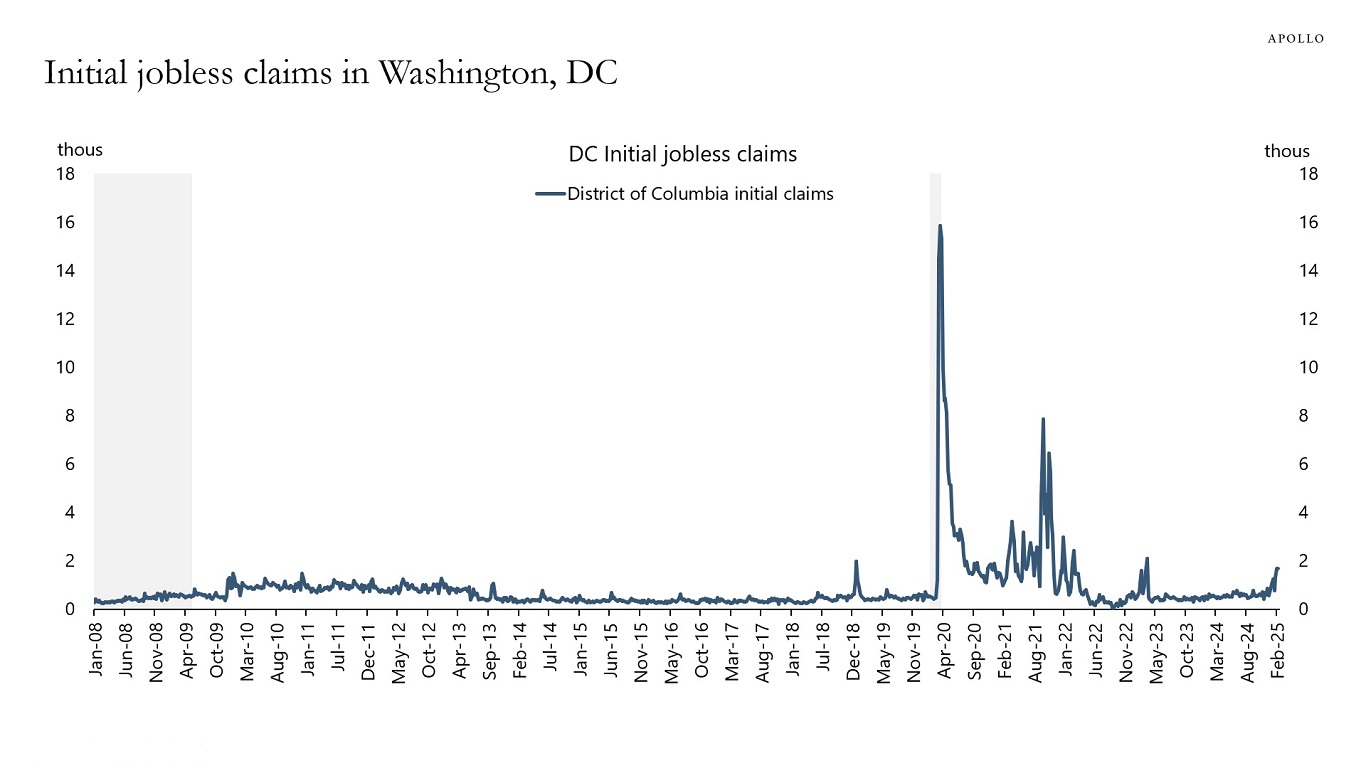
1) The consensus expects total DOGE-related job cuts to be 300,000, and the number of people filing for unemployment benefits has been rising in Washington, DC, but not in Virginia, Maryland, and Washington, DC combined, see the first two charts. Total employment in the United States is 160 million, with 7 million unemployed. Also, about 5 million people change jobs every month. In that context, 300,000 federal jobs lost is not much. However, studies show that for every federal employee, there are two contractors. As a result, layoffs could potentially be closer to 1 million. Any increase in layoffs will push jobless claims higher over the coming weeks, and such a rise in the unemployment rate is likely to have consequences for rates, equities, and credit.

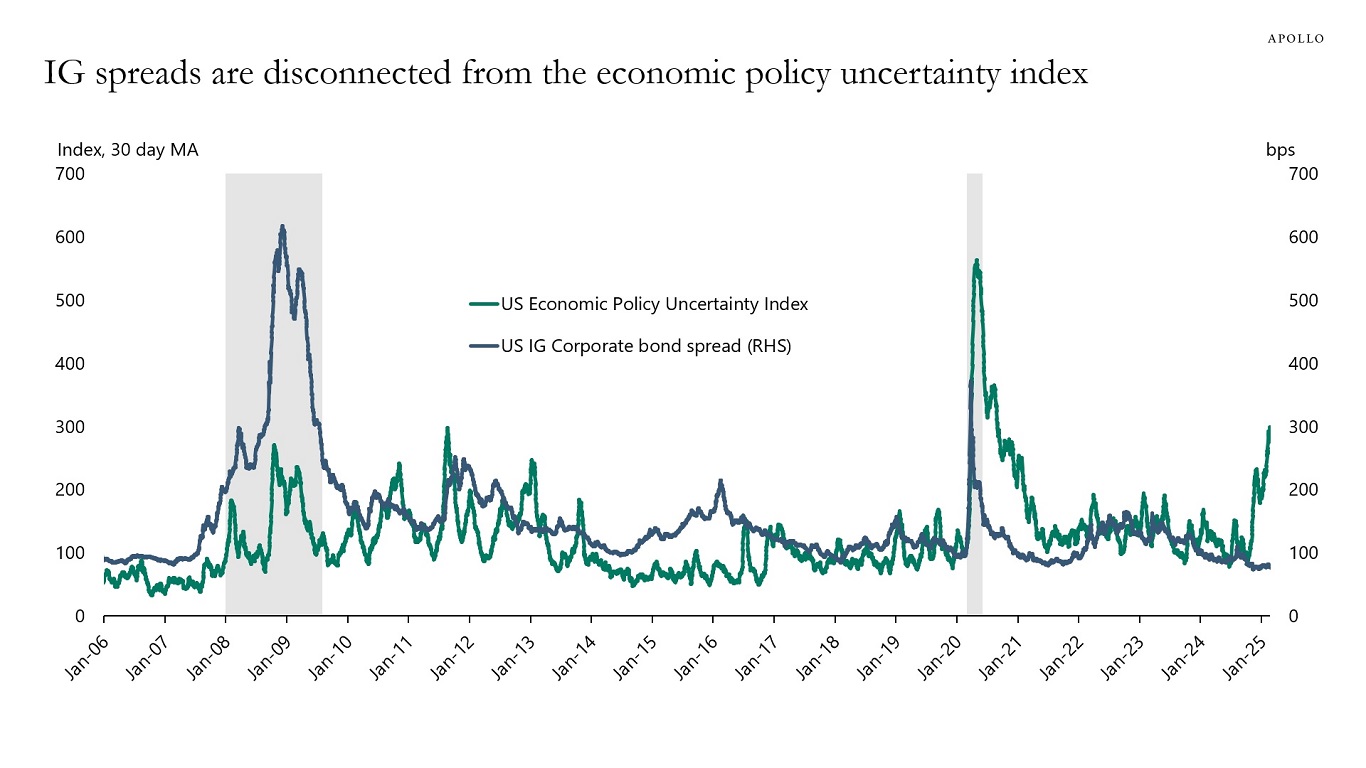
2) Credit spreads have not responded the way they normally do to rising policy uncertainty. Economic policy uncertainty is spiking higher, but credit spreads are not widening, see the third chart. The question is if persistently elevated policy uncertainty will begin to have a negative impact on capex spending and hiring decisions.

The bottom line is that the incoming data remains strong, see the fourth chart. But the near-term downside risks to the economy and markets are growing.

Our chart book with daily and weekly indicators for the US economy is available here.

Initial jobless claims in Washington, DC
Source: US Department of Labor, Bloomberg, Apollo Chief Economist
Total initial jobless claims in Maryland, Virginia, and DC
Source: US Department of Labor, Bloomberg, Apollo Chief Economist
IG spreads are disconnected from the economic policy uncertainty index
Source: Bloomberg, Apollo Chief Economist
Corporate capex spending plans still strong
Source: Business Roundtable; NFIB; Federal Reserve Bank of Philadelphia, Dallas, New York, Kansas, and Richmond; Apollo Chief Economist

Download high-res chart book

Recent Posts

  • China Selling Less to the US and More to Europe, Asia, and Latin America
  • The 10% Depreciation in the Dollar Will Boost Inflation by 0.3 Percentage Points
  • Outlook for the Dollar After Section 899
  • 45 Million People Have a Student Loan, 24% Are Delinquent
  • Unemployment Rate Expected to Move Higher

Recent Comments

No comments to show.

Archives

  • July 2025
  • June 2025
  • May 2025
  • April 2025
  • March 2025
  • February 2025
  • January 2025
  • December 2024
  • November 2024
  • October 2024
  • September 2024
  • August 2024
  • July 2024
  • June 2024
  • May 2024
  • April 2024
  • March 2024
  • February 2024
  • January 2024
  • December 2023
  • November 2023
  • October 2023
  • September 2023
  • August 2023
  • July 2023
  • June 2023
  • May 2023
  • April 2023
  • March 2023
  • February 2023
  • January 2023
  • December 2022
  • November 2022
  • October 2022
  • September 2022
  • August 2022
  • July 2022
  • June 2022
  • May 2022
  • April 2022
  • March 2022
  • February 2022
  • January 2022
  • December 2021
  • November 2021

Categories

  • Apollo Answers
  • Course Introductions
  • Economic Intelligence
  • Hide from Wordpress Search
  • Investment Knowledge
  • Perspectives
  • Redirecting
  • The Daily Spark
  • The View from Apollo
  • The Weekly Brief
  • Uncategorized
  • White Papers

Median Age of Homebuyers: 56

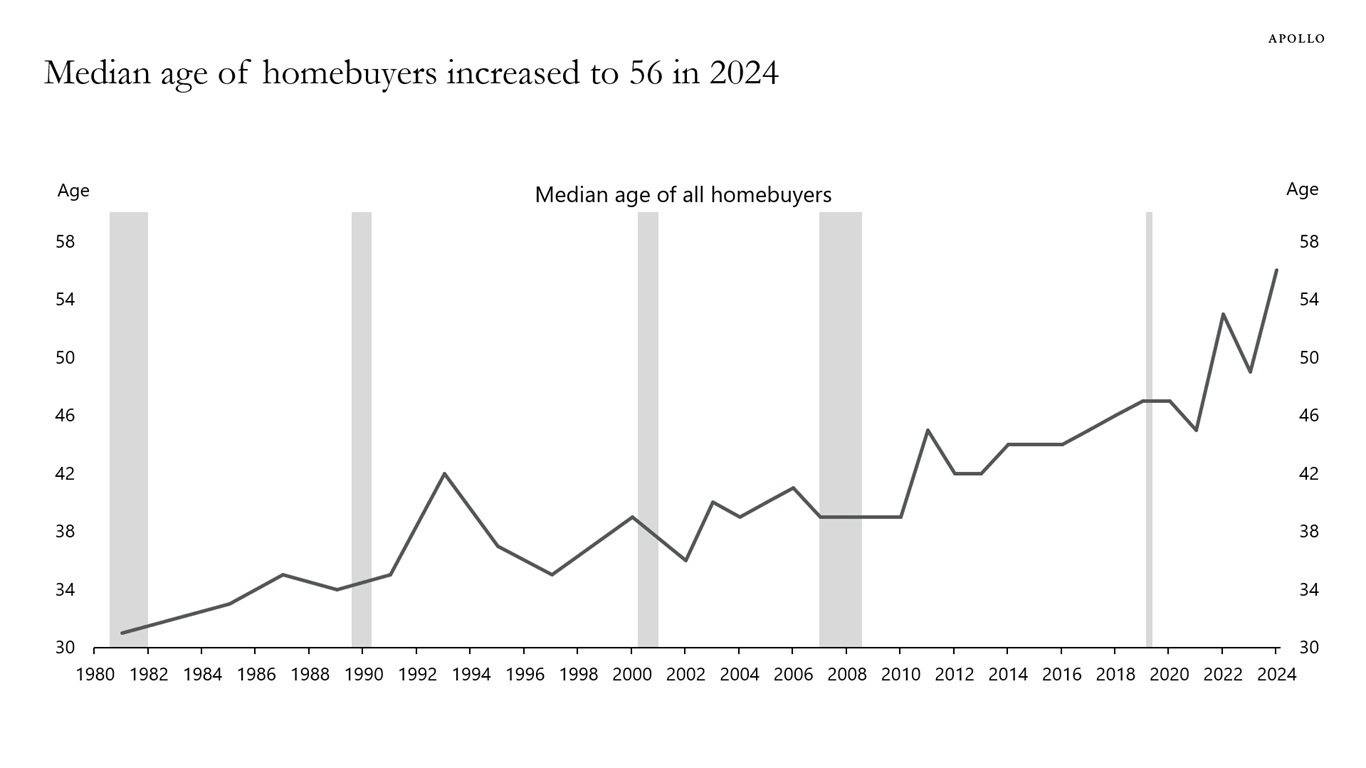
Rising home prices and high mortgage rates have pushed the median age of homebuyers to a record-high 56 years old in 2024, up from 45 in 2021.

In 1981, the median age of homebuyers was 31 years old, see chart below.

Median age of homebuyers increased to 56 in 2024
Source: NAR Profile of Home Buyers and Sellers, Apollo Chief Economist

Download high-res chart

Recent Posts

  • China Selling Less to the US and More to Europe, Asia, and Latin America
  • The 10% Depreciation in the Dollar Will Boost Inflation by 0.3 Percentage Points
  • Outlook for the Dollar After Section 899
  • 45 Million People Have a Student Loan, 24% Are Delinquent
  • Unemployment Rate Expected to Move Higher

Recent Comments

No comments to show.

Archives

  • July 2025
  • June 2025
  • May 2025
  • April 2025
  • March 2025
  • February 2025
  • January 2025
  • December 2024
  • November 2024
  • October 2024
  • September 2024
  • August 2024
  • July 2024
  • June 2024
  • May 2024
  • April 2024
  • March 2024
  • February 2024
  • January 2024
  • December 2023
  • November 2023
  • October 2023
  • September 2023
  • August 2023
  • July 2023
  • June 2023
  • May 2023
  • April 2023
  • March 2023
  • February 2023
  • January 2023
  • December 2022
  • November 2022
  • October 2022
  • September 2022
  • August 2022
  • July 2022
  • June 2022
  • May 2022
  • April 2022
  • March 2022
  • February 2022
  • January 2022
  • December 2021
  • November 2021

Categories

  • Apollo Answers
  • Course Introductions
  • Economic Intelligence
  • Hide from Wordpress Search
  • Investment Knowledge
  • Perspectives
  • Redirecting
  • The Daily Spark
  • The View from Apollo
  • The Weekly Brief
  • Uncategorized
  • White Papers

Challenging to Replace Income Taxes with Tariffs

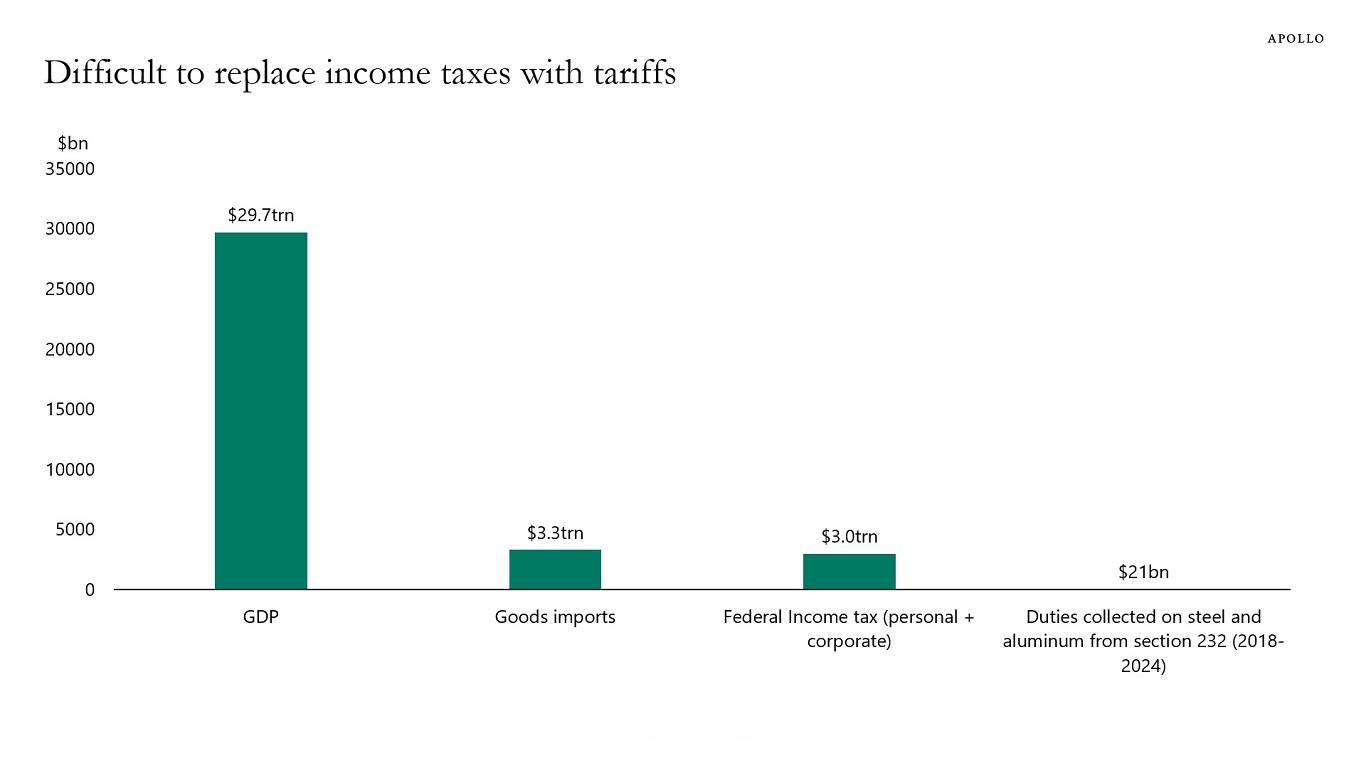
Total revenue raised from income taxes is currently around $3 trillion, and total imports into the US are also around $3 trillion, see chart below.

This means that tariffs would have to be at least 100% on all imported goods for tariffs to replace income taxes.

The challenge is that it is unclear what will happen to sales if all imported products double in price. Given higher prices result in lower sales, it may require as much as 200% tariffs on all imported goods for the total tariff revenue to replace income taxes.

In addition, such a scenario would also involve significantly higher prices of cars, computers, electronics, imported medicine, clothing, shoes, imported energy, etc. for US consumers.

The bottom line is that it is challenging to replace income taxes with tariffs, and higher tariffs will have implications for consumer prices and consumer demand for imported goods.

Difficult to replace income taxes with tariffs
Note: Data for 2024 for GDP, goods imports, and income tax. Source: BEA, OMB, Haver Analytics, US Customs and Borders Protection, Apollo Chief Economist

Download high-res chart

Recent Posts

  • China Selling Less to the US and More to Europe, Asia, and Latin America
  • The 10% Depreciation in the Dollar Will Boost Inflation by 0.3 Percentage Points
  • Outlook for the Dollar After Section 899
  • 45 Million People Have a Student Loan, 24% Are Delinquent
  • Unemployment Rate Expected to Move Higher

Recent Comments

No comments to show.

Archives

  • July 2025
  • June 2025
  • May 2025
  • April 2025
  • March 2025
  • February 2025
  • January 2025
  • December 2024
  • November 2024
  • October 2024
  • September 2024
  • August 2024
  • July 2024
  • June 2024
  • May 2024
  • April 2024
  • March 2024
  • February 2024
  • January 2024
  • December 2023
  • November 2023
  • October 2023
  • September 2023
  • August 2023
  • July 2023
  • June 2023
  • May 2023
  • April 2023
  • March 2023
  • February 2023
  • January 2023
  • December 2022
  • November 2022
  • October 2022
  • September 2022
  • August 2022
  • July 2022
  • June 2022
  • May 2022
  • April 2022
  • March 2022
  • February 2022
  • January 2022
  • December 2021
  • November 2021

Categories

  • Apollo Answers
  • Course Introductions
  • Economic Intelligence
  • Hide from Wordpress Search
  • Investment Knowledge
  • Perspectives
  • Redirecting
  • The Daily Spark
  • The View from Apollo
  • The Weekly Brief
  • Uncategorized
  • White Papers

Key Questions for Investors at the Moment

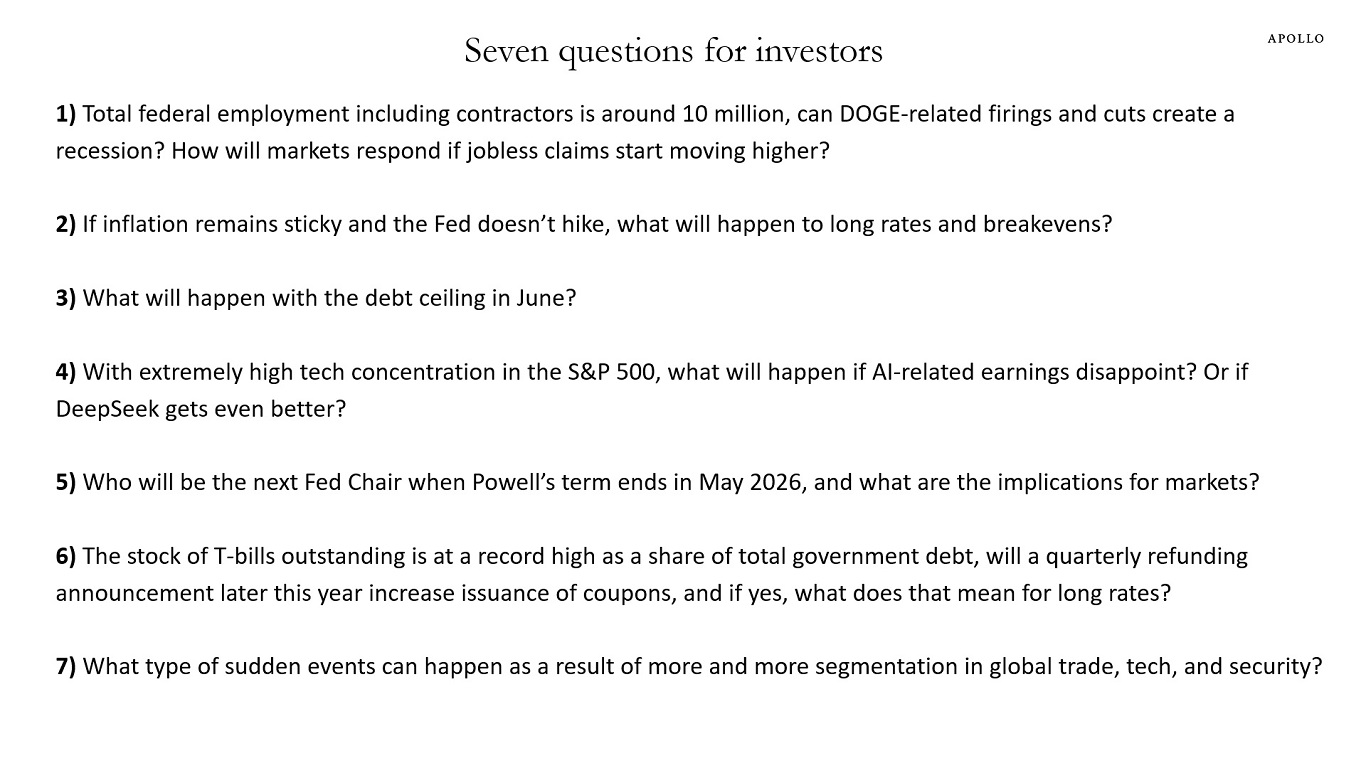
Below are some questions I have been getting from clients recently. All risk managers should be asking themselves these questions. 

Seven questions for investors
Source: Apollo Chief Economist

Download questions

Recent Posts

  • China Selling Less to the US and More to Europe, Asia, and Latin America
  • The 10% Depreciation in the Dollar Will Boost Inflation by 0.3 Percentage Points
  • Outlook for the Dollar After Section 899
  • 45 Million People Have a Student Loan, 24% Are Delinquent
  • Unemployment Rate Expected to Move Higher

Recent Comments

No comments to show.

Archives

  • July 2025
  • June 2025
  • May 2025
  • April 2025
  • March 2025
  • February 2025
  • January 2025
  • December 2024
  • November 2024
  • October 2024
  • September 2024
  • August 2024
  • July 2024
  • June 2024
  • May 2024
  • April 2024
  • March 2024
  • February 2024
  • January 2024
  • December 2023
  • November 2023
  • October 2023
  • September 2023
  • August 2023
  • July 2023
  • June 2023
  • May 2023
  • April 2023
  • March 2023
  • February 2023
  • January 2023
  • December 2022
  • November 2022
  • October 2022
  • September 2022
  • August 2022
  • July 2022
  • June 2022
  • May 2022
  • April 2022
  • March 2022
  • February 2022
  • January 2022
  • December 2021
  • November 2021

Categories

  • Apollo Answers
  • Course Introductions
  • Economic Intelligence
  • Hide from Wordpress Search
  • Investment Knowledge
  • Perspectives
  • Redirecting
  • The Daily Spark
  • The View from Apollo
  • The Weekly Brief
  • Uncategorized
  • White Papers

Posts navigation

Page 1 Page 2 Page 3 Next page→
  • Privacy Notice
  • Terms of Use
  • Forward-Looking Statements
Apollo
© Apollo Global Management, Inc. All Rights Reserved.

The Apollo Academy is for informational and educational purposes only and nothing contained herein should be taken as investment advice or a recommendation to enter into any transaction. They are not an invitation by or on behalf of Apollo to any person to buy or sell any security or to adopt any investment strategy, and shall not form the basis of, nor may it accompany nor form part of, any right or contract to buy or sell any security or to adopt any investment strategy. There is no guarantee that the views and opinions expressed in this website will come to pass. For additional information, please see the disclaimers included in each piece of content or the legal page of our website here.