• Apollo.com
  • Login
  • Register Now
light site-logo
  • The Academy
  • Upcoming Events
        • Upcoming Events

  • Learning Center
        • New & UpdatedAlternative Investing Course 2.0

        • Alternative Investing Essentials Part OnePrivate Equity, Venture Capital, Private Credit
        • Alternative Investing Essentials Part TwoReal Estate, Infrastructure, Digital Assets, Hedge Funds
        • Practical ConsiderationsAsset Allocation, Risk Considerations, Fund Structures, Fees
        • Introductory Videos

          View All Videos

        •  Recent Classes & Videos

        • • Mid-Year Outlook: At the Crossroads of Stagflation — What’s Next?
        • • Hybrid Investments: Flexible Structures for Volatile Times
        • • Private Credit Investing in Volatile Times
        • • Potential Implications of the Latest US Administration Policy Proposals
        • • Beyond 60/40: Private Assets in an Era of High Public Valuations
        • • Investment Grade Private Credit as a Core Fixed Income Allocation
        • View All Classes

  • Alternative Perspectives
        • Investment Knowledge
        • The View from Apollo
          • Investment Knowledge White Papers

            Mid-Year Outlook: At the Crossroads of Stagflation—What’s Next?

            June 23, 2025
          • The View From Apollo

            Mid-Year Outlook: At the Crossroads of Stagflation—What’s Next?

            June 27, 2025
          • Investment Knowledge White Papers

            The Continental Shift: Europe’s Private Credit Moment

            June 20, 2025
  • The Daily Spark
        • Read The Daily Spark Blog


        • Want it delivered daily to your inbox?
          • The Daily Spark

            Comparing Wage Growth for Job Stayers and Job Switchers

            July 18, 2025
          • The Daily Spark

            Different Retirement Systems in Europe

            July 17, 2025
          • The Daily Spark

            AI Bubble Today Is Bigger Than the IT Bubble in the 1990s

            July 16, 2025
  • Register for Apollo Academy: Alternative Investing Course
  • Login
  • About Apollo Academy
  • Upcoming Events
  • Learning Center
  • Alternative Perspectives
  • The Daily Spark
  • Register for Apollo Academy: Alternative Investing Course
  • Login
  • Alternative Investing Course 2.0
  • Mid-Year Outlook: At the Crossroads of Stagflation — What’s Next?
  • Hybrid Investments: Flexible Structures for Volatile Times
  • Private Credit Investing in Volatile Times
  • Potential Implications of the Latest US Administration Policy Proposals
  • Beyond 60/40: Private Assets in an Era of High Public Valuations
  • Investment Grade Private Credit as a Core Fixed Income Allocation
  • View All Classes
  • Introductory Videos
  • Alternative Investing Essentials Part One • Now Available On Demand
  • Alternative Investing Essentials Part Two • Now Available On Demand
  • Practical Considerations • Now Available On Demand
  • Investment Knowledge
  • The View from Apollo
Home August 2024

Quantifying What Fed Cuts Mean for GDP and Inflation

This week, jobless claims declined, GDP was revised higher, and personal income was higher than consensus expected. Our daily and weekly indicators continue to show no signs of a slowdown, see our chart book.

Or, from a markets perspective, if the economy is about to enter a recession and the unemployment rate is about to go up, why is Walmart’s stock price trading at an all-time high?

With this backdrop, let’s quantify what Fed cuts will do to the economy.

The Fed is saying that monetary policy is restrictive and the Fed funds rate needs to normalize and come down to r-star, which they estimate to be around 3%.

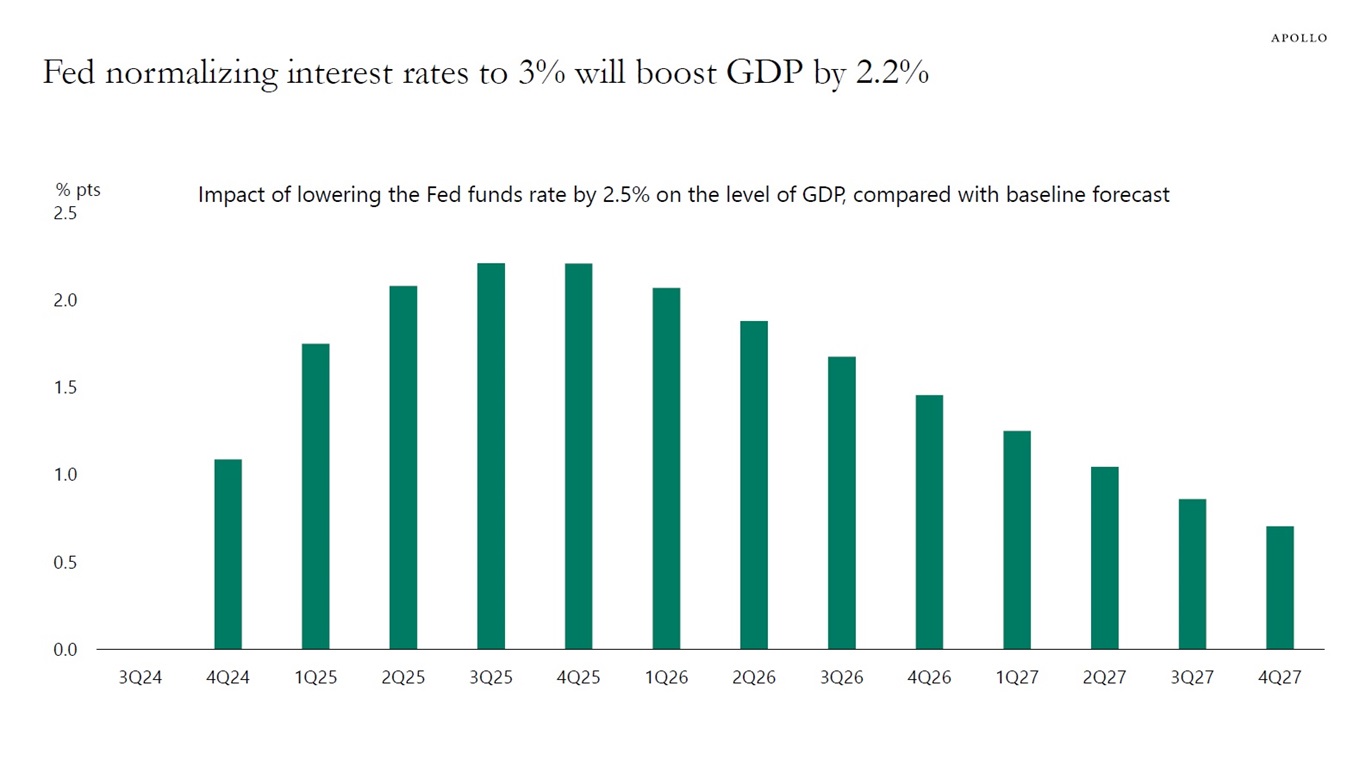
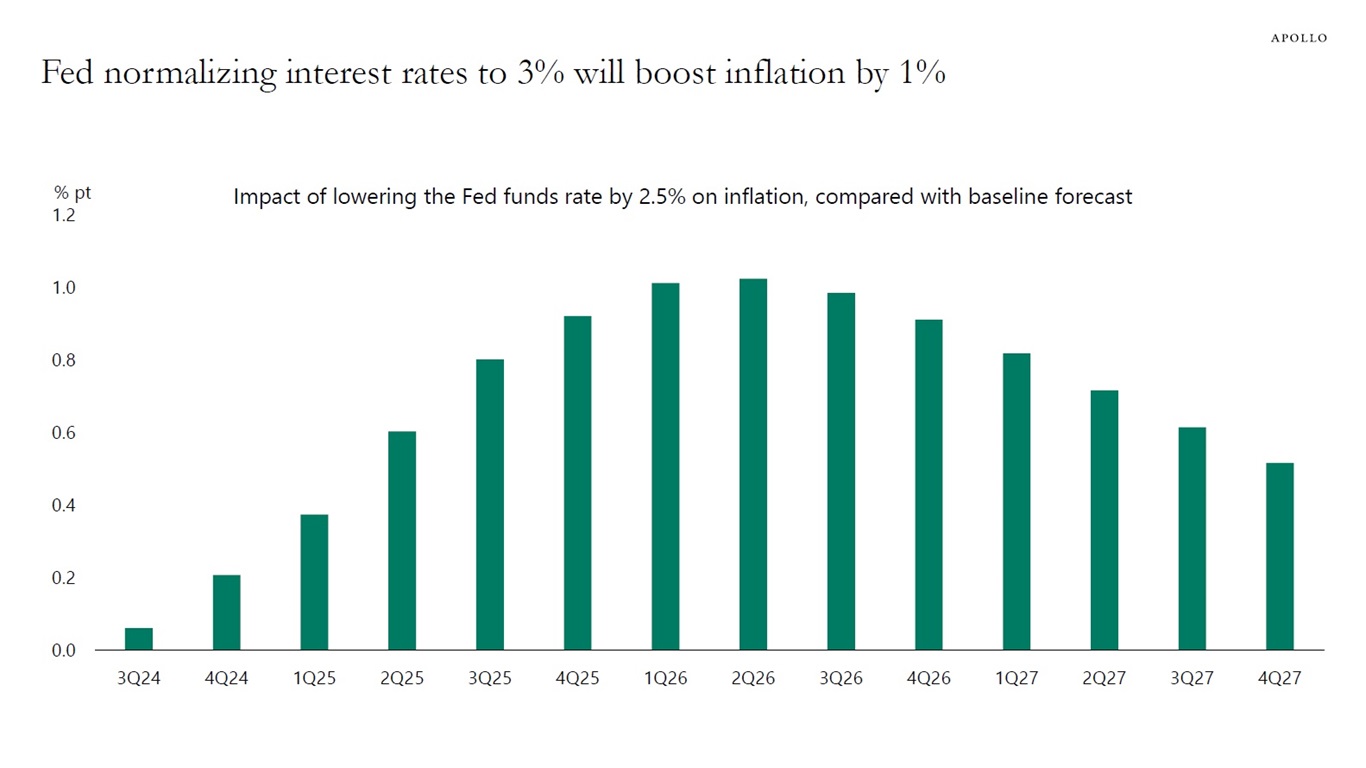
We ran a simulation on a simplified version of the Fed’s model for the US economy, FRBUS, to quantify what the normalization of interest rates means for GDP and inflation.

Assuming a 100bps cut to the Fed funds rate this year and an additional 150bps in forward guidance about more cuts coming will boost GDP by 2% and inflation by 1%, see simulations below.

View Post

In short, the current excitement about a dramatic amount of rate cuts is ignoring the significant positive effects these cuts will have on the stock market, credit spreads, consumer spending, capex spending, corporate earnings, and inflation.

Combined with a continued strong tailwind to the economy from fiscal policy and massive investments in AI, the risks are rising that Fed cuts are going to boost stock prices and tighten credit spreads and trigger a reacceleration in GDP and inflation, see again simulations below.

The bottom line is that the r-star framework is missing what “normalizing interest rates” means for the economy, and this is particularly problematic when the Fed funds rate is significantly higher than the model-calculated terminal policy rate.

Fed normalizing interest rates to 3% will boost GDP by 2.2%
Note: Monetary policy shock: 100bps decline in the Fed funds rate and Fed forward guidance signaling that another 150bps of cuts are coming (to ultimately bring the Fed funds rate down to the Fed’s estimate of r-star at 3%). Source: Bloomberg SHOK Model, Apollo Chief Economist
Fed normalizing interest rates to 3% will boost inflation by 1%
Note: Monetary policy shock: 100bps decline in the Fed funds rate and Fed forward guidance signaling that another 150bps of cuts are coming (to ultimately bring the Fed funds rate down to the Fed’s estimate of r-star at 3%). Source: Bloomberg SHOK Model, Apollo Chief Economist

Download high-res chart(s)

Recent Posts

  • Comparing Wage Growth for Job Stayers and Job Switchers
  • Different Retirement Systems in Europe
  • AI Bubble Today Is Bigger Than the IT Bubble in the 1990s
  • 75% of Restaurant Orders Are Delivery Orders
  • Japan: Negative Population Growth = More Empty Homes

Recent Comments

No comments to show.

Archives

  • July 2025
  • June 2025
  • May 2025
  • April 2025
  • March 2025
  • February 2025
  • January 2025
  • December 2024
  • November 2024
  • October 2024
  • September 2024
  • August 2024
  • July 2024
  • June 2024
  • May 2024
  • April 2024
  • March 2024
  • February 2024
  • January 2024
  • December 2023
  • November 2023
  • October 2023
  • September 2023
  • August 2023
  • July 2023
  • June 2023
  • May 2023
  • April 2023
  • March 2023
  • February 2023
  • January 2023
  • December 2022
  • November 2022
  • October 2022
  • September 2022
  • August 2022
  • July 2022
  • June 2022
  • May 2022
  • April 2022
  • March 2022
  • February 2022
  • January 2022
  • December 2021
  • November 2021

Categories

  • Apollo Answers
  • Course Introductions
  • Economic Intelligence
  • Hide from Wordpress Search
  • Investment Knowledge
  • Perspectives
  • Redirecting
  • The Daily Spark
  • The View from Apollo
  • The Weekly Brief
  • Uncategorized
  • White Papers

Privately Owned Companies Are the Lifeblood of the US Economy

Worldwide employment in all US multinational companies is 44 million.

About 70% of employment in US multinational enterprises, or about 30 million jobs, are in the US, and 14 million jobs in US multinational firms are outside the US.

With total nonfarm payrolls in the US at 159 million, 19% of US employment is in multinational enterprises.

Put differently, more than 80% of jobs in the US economy are outside the S&P 500 companies, and privately owned companies continue to be the lifeblood of the US economy.

For more, see this new data from the BLS.

Employment by US multinational enterprises
Source: US Bureau of Economic Analysis, Apollo Chief Economist

Download high-res chart(s)

Recent Posts

  • Comparing Wage Growth for Job Stayers and Job Switchers
  • Different Retirement Systems in Europe
  • AI Bubble Today Is Bigger Than the IT Bubble in the 1990s
  • 75% of Restaurant Orders Are Delivery Orders
  • Japan: Negative Population Growth = More Empty Homes

Recent Comments

No comments to show.

Archives

  • July 2025
  • June 2025
  • May 2025
  • April 2025
  • March 2025
  • February 2025
  • January 2025
  • December 2024
  • November 2024
  • October 2024
  • September 2024
  • August 2024
  • July 2024
  • June 2024
  • May 2024
  • April 2024
  • March 2024
  • February 2024
  • January 2024
  • December 2023
  • November 2023
  • October 2023
  • September 2023
  • August 2023
  • July 2023
  • June 2023
  • May 2023
  • April 2023
  • March 2023
  • February 2023
  • January 2023
  • December 2022
  • November 2022
  • October 2022
  • September 2022
  • August 2022
  • July 2022
  • June 2022
  • May 2022
  • April 2022
  • March 2022
  • February 2022
  • January 2022
  • December 2021
  • November 2021

Categories

  • Apollo Answers
  • Course Introductions
  • Economic Intelligence
  • Hide from Wordpress Search
  • Investment Knowledge
  • Perspectives
  • Redirecting
  • The Daily Spark
  • The View from Apollo
  • The Weekly Brief
  • Uncategorized
  • White Papers

Free Float Highest in the US

MSCI defines the free float as the proportion of shares outstanding that is deemed to be available for purchase in the public equity markets by international investors.

A higher free float normally means lower volatility and higher liquidity. The free float is higher in the US, UK, and Australia, and generally lower in emerging markets, see charts below.

US, UK, and Australia have a higher free float than other countries
Note: MSCI defines the free float of a security as the proportion of shares outstanding that is deemed to be available for purchase in the public equity markets by international investors. Data as of July 2024. Source: Bloomberg, Apollo Chief Economist
EM: Significant differences in free float across countries
Note: MSCI defines the free float of a security as the proportion of shares outstanding that is deemed to be available for purchase in the public equity markets by international investors. Data as of July 2024. Source: Bloomberg, Apollo Chief Economist

Download high-res chart(s)

Recent Posts

  • Comparing Wage Growth for Job Stayers and Job Switchers
  • Different Retirement Systems in Europe
  • AI Bubble Today Is Bigger Than the IT Bubble in the 1990s
  • 75% of Restaurant Orders Are Delivery Orders
  • Japan: Negative Population Growth = More Empty Homes

Recent Comments

No comments to show.

Archives

  • July 2025
  • June 2025
  • May 2025
  • April 2025
  • March 2025
  • February 2025
  • January 2025
  • December 2024
  • November 2024
  • October 2024
  • September 2024
  • August 2024
  • July 2024
  • June 2024
  • May 2024
  • April 2024
  • March 2024
  • February 2024
  • January 2024
  • December 2023
  • November 2023
  • October 2023
  • September 2023
  • August 2023
  • July 2023
  • June 2023
  • May 2023
  • April 2023
  • March 2023
  • February 2023
  • January 2023
  • December 2022
  • November 2022
  • October 2022
  • September 2022
  • August 2022
  • July 2022
  • June 2022
  • May 2022
  • April 2022
  • March 2022
  • February 2022
  • January 2022
  • December 2021
  • November 2021

Categories

  • Apollo Answers
  • Course Introductions
  • Economic Intelligence
  • Hide from Wordpress Search
  • Investment Knowledge
  • Perspectives
  • Redirecting
  • The Daily Spark
  • The View from Apollo
  • The Weekly Brief
  • Uncategorized
  • White Papers

Capex Spending on AI Continues to Be a Significant Tailwind to the Economic Outlook

The economics textbook says that higher interest rates should slow capex spending.

But capex spending is currently much less sensitive to interest rates because of massive investments in AI.

Despite the Fed funds rate being at the highest level in decades, capex spending by the Magnificent Seven is at record-high levels, see chart below.

This is another reason why the monetary policy transmission mechanism is much weaker than usual. Fed hikes are having a much smaller negative impact than normal on business investment decisions because of the strong appetite among firms to invest in AI.

Capex spending of the Magnificent Seven
Source: Bloomberg, Apollo Chief Economist

Download high-res chart(s)

Recent Posts

  • Comparing Wage Growth for Job Stayers and Job Switchers
  • Different Retirement Systems in Europe
  • AI Bubble Today Is Bigger Than the IT Bubble in the 1990s
  • 75% of Restaurant Orders Are Delivery Orders
  • Japan: Negative Population Growth = More Empty Homes

Recent Comments

No comments to show.

Archives

  • July 2025
  • June 2025
  • May 2025
  • April 2025
  • March 2025
  • February 2025
  • January 2025
  • December 2024
  • November 2024
  • October 2024
  • September 2024
  • August 2024
  • July 2024
  • June 2024
  • May 2024
  • April 2024
  • March 2024
  • February 2024
  • January 2024
  • December 2023
  • November 2023
  • October 2023
  • September 2023
  • August 2023
  • July 2023
  • June 2023
  • May 2023
  • April 2023
  • March 2023
  • February 2023
  • January 2023
  • December 2022
  • November 2022
  • October 2022
  • September 2022
  • August 2022
  • July 2022
  • June 2022
  • May 2022
  • April 2022
  • March 2022
  • February 2022
  • January 2022
  • December 2021
  • November 2021

Categories

  • Apollo Answers
  • Course Introductions
  • Economic Intelligence
  • Hide from Wordpress Search
  • Investment Knowledge
  • Perspectives
  • Redirecting
  • The Daily Spark
  • The View from Apollo
  • The Weekly Brief
  • Uncategorized
  • White Papers

10 Facts about the US Treasury Market

Our chart book, available here, monitors a broad spectrum of indicators for signs of weakness in demand for US Treasuries. Fed cuts will begin to test the appetite for Treasuries among yield-sensitive buyers such as households, pension funds, and insurance companies.

10 Facts about the US Treasury market
Source: Apollo Chief Economist

Download high-res chart(s)

Recent Posts

  • Comparing Wage Growth for Job Stayers and Job Switchers
  • Different Retirement Systems in Europe
  • AI Bubble Today Is Bigger Than the IT Bubble in the 1990s
  • 75% of Restaurant Orders Are Delivery Orders
  • Japan: Negative Population Growth = More Empty Homes

Recent Comments

No comments to show.

Archives

  • July 2025
  • June 2025
  • May 2025
  • April 2025
  • March 2025
  • February 2025
  • January 2025
  • December 2024
  • November 2024
  • October 2024
  • September 2024
  • August 2024
  • July 2024
  • June 2024
  • May 2024
  • April 2024
  • March 2024
  • February 2024
  • January 2024
  • December 2023
  • November 2023
  • October 2023
  • September 2023
  • August 2023
  • July 2023
  • June 2023
  • May 2023
  • April 2023
  • March 2023
  • February 2023
  • January 2023
  • December 2022
  • November 2022
  • October 2022
  • September 2022
  • August 2022
  • July 2022
  • June 2022
  • May 2022
  • April 2022
  • March 2022
  • February 2022
  • January 2022
  • December 2021
  • November 2021

Categories

  • Apollo Answers
  • Course Introductions
  • Economic Intelligence
  • Hide from Wordpress Search
  • Investment Knowledge
  • Perspectives
  • Redirecting
  • The Daily Spark
  • The View from Apollo
  • The Weekly Brief
  • Uncategorized
  • White Papers

Sources of NOK Depreciation

The depreciation of the Norwegian krone has been driven by the Fed raising interest rates faster than Norges Bank and by weak oil prices, see charts below and our chart book available here.

Norwegian krone: Real exchange rate depreciation
Source: Bloomberg, Apollo Chief Economist
The Fed raised interest rates faster than Norges Bank
Source: Bloomberg, Apollo Chief Economist
Weaker oil prices have also been contributing to NOK weakness
Source: Bloomberg, Apollo Chief Economist

Download high-res chart(s)

Recent Posts

  • Comparing Wage Growth for Job Stayers and Job Switchers
  • Different Retirement Systems in Europe
  • AI Bubble Today Is Bigger Than the IT Bubble in the 1990s
  • 75% of Restaurant Orders Are Delivery Orders
  • Japan: Negative Population Growth = More Empty Homes

Recent Comments

No comments to show.

Archives

  • July 2025
  • June 2025
  • May 2025
  • April 2025
  • March 2025
  • February 2025
  • January 2025
  • December 2024
  • November 2024
  • October 2024
  • September 2024
  • August 2024
  • July 2024
  • June 2024
  • May 2024
  • April 2024
  • March 2024
  • February 2024
  • January 2024
  • December 2023
  • November 2023
  • October 2023
  • September 2023
  • August 2023
  • July 2023
  • June 2023
  • May 2023
  • April 2023
  • March 2023
  • February 2023
  • January 2023
  • December 2022
  • November 2022
  • October 2022
  • September 2022
  • August 2022
  • July 2022
  • June 2022
  • May 2022
  • April 2022
  • March 2022
  • February 2022
  • January 2022
  • December 2021
  • November 2021

Categories

  • Apollo Answers
  • Course Introductions
  • Economic Intelligence
  • Hide from Wordpress Search
  • Investment Knowledge
  • Perspectives
  • Redirecting
  • The Daily Spark
  • The View from Apollo
  • The Weekly Brief
  • Uncategorized
  • White Papers

Average Lottery Spending, by State

The five states with the highest average annual lottery spending per person are Rhode Island, Massachusetts, Maryland, West Virginia, and Delaware, see chart below.

States with highest annual average lottery spending
Source: North American Association of State & Provincial Lotteries (NASPL), US Census Bureau, Apollo Chief Economist

Download high-res chart(s)

Recent Posts

  • Comparing Wage Growth for Job Stayers and Job Switchers
  • Different Retirement Systems in Europe
  • AI Bubble Today Is Bigger Than the IT Bubble in the 1990s
  • 75% of Restaurant Orders Are Delivery Orders
  • Japan: Negative Population Growth = More Empty Homes

Recent Comments

No comments to show.

Archives

  • July 2025
  • June 2025
  • May 2025
  • April 2025
  • March 2025
  • February 2025
  • January 2025
  • December 2024
  • November 2024
  • October 2024
  • September 2024
  • August 2024
  • July 2024
  • June 2024
  • May 2024
  • April 2024
  • March 2024
  • February 2024
  • January 2024
  • December 2023
  • November 2023
  • October 2023
  • September 2023
  • August 2023
  • July 2023
  • June 2023
  • May 2023
  • April 2023
  • March 2023
  • February 2023
  • January 2023
  • December 2022
  • November 2022
  • October 2022
  • September 2022
  • August 2022
  • July 2022
  • June 2022
  • May 2022
  • April 2022
  • March 2022
  • February 2022
  • January 2022
  • December 2021
  • November 2021

Categories

  • Apollo Answers
  • Course Introductions
  • Economic Intelligence
  • Hide from Wordpress Search
  • Investment Knowledge
  • Perspectives
  • Redirecting
  • The Daily Spark
  • The View from Apollo
  • The Weekly Brief
  • Uncategorized
  • White Papers

Record Low Levels of Layoffs

The JOLTS data shows that layoffs are currently at record-low levels, see the first chart.

The Challenger, Gray & Christmas survey of job cut announcements shows that job cuts are at record-low levels, see the second chart.

WARN notices are trending down, suggesting that initial jobless claims will decline over the coming months, see the third chart.

The bottom line is that the rise in the unemployment rate is not driven by people getting fired.

Put differently, we are not in a recession, and it is debatable if the labor market is softening.

In short, the economy is doing just fine, and that is good for consumer spending, capex spending, and corporate earnings. There is no need for the Fed to cut interest rates four times this year. In fact, cutting interest rates too aggressively runs the risk of triggering another run-up in inflation.

Our latest chart book with daily and weekly indicators for the US economy is available here.

Record low levels of layoffs
Source: BLS, Haver Analytics, Apollo Chief Economist
Announced job cuts trending lower
Source: Challenger, Gray & Christmas, Haver Analytics, Apollo Chief Economist
WARN data points to lower claims in coming months
Note: The Worker Adjustment and Retraining Notification (WARN) Act helps ensure 60 to 90 days advance notice in cases of qualified plant closings and mass layoffs. WARN factor is the Cleveland Fed estimate for WARN notices (https://www.clevelandfed.org/publications/working-paper/wp-2003r-advance-layoff-notices-and-aggregate-job-loss). Source: Department of Labor, Haver Analytics, Federal Reserve Bank of Cleveland, Apollo Chief Economist

Download high-res chart(s)

Recent Posts

  • Comparing Wage Growth for Job Stayers and Job Switchers
  • Different Retirement Systems in Europe
  • AI Bubble Today Is Bigger Than the IT Bubble in the 1990s
  • 75% of Restaurant Orders Are Delivery Orders
  • Japan: Negative Population Growth = More Empty Homes

Recent Comments

No comments to show.

Archives

  • July 2025
  • June 2025
  • May 2025
  • April 2025
  • March 2025
  • February 2025
  • January 2025
  • December 2024
  • November 2024
  • October 2024
  • September 2024
  • August 2024
  • July 2024
  • June 2024
  • May 2024
  • April 2024
  • March 2024
  • February 2024
  • January 2024
  • December 2023
  • November 2023
  • October 2023
  • September 2023
  • August 2023
  • July 2023
  • June 2023
  • May 2023
  • April 2023
  • March 2023
  • February 2023
  • January 2023
  • December 2022
  • November 2022
  • October 2022
  • September 2022
  • August 2022
  • July 2022
  • June 2022
  • May 2022
  • April 2022
  • March 2022
  • February 2022
  • January 2022
  • December 2021
  • November 2021

Categories

  • Apollo Answers
  • Course Introductions
  • Economic Intelligence
  • Hide from Wordpress Search
  • Investment Knowledge
  • Perspectives
  • Redirecting
  • The Daily Spark
  • The View from Apollo
  • The Weekly Brief
  • Uncategorized
  • White Papers

More One-Person Companies Today than Before Covid

During the pandemic, many new businesses were created, see the first chart below. But the new businesses created were different. They were created by individuals rather than corporations, and they were smaller and less likely to hire a lot of people, see the second and third chart.

The bottom line is that business dynamics changed during Covid, with more one-person businesses opening since 2020. This is likely why the BLS overestimated employment in the birth/death model, which looks back five years and adjusts the total employment numbers for how many new businesses have opened and how many people work at these new businesses.

In other words, new businesses created are smaller and have fewer workers. The sector distribution seems to be fairly even and a lot of these businesses happen to be in Florida, see the fourth and fifth chart.

The implication for markets is that employment growth going forward will be lower because of an increase in the share of new businesses with fewer workers.

For more, see our chart book available here on these changing business dynamics.

Business applications increased during the pandemic and have stayed elevated
Source: Census Bureau, Haver Analytics, Apollo Chief Economist
Business applications from corporations did not increase during Covid
Source: Census Bureau, Haver Analytics, Apollo Chief Economist
The share of business applications that convert into a business with many employees has declined
Note: High-propensity businesses are those that have a higher likelihood of becoming businesses with employees and payroll capabilities, and include those that: Define themselves as a corporate entity, indicate a plan to hire employees, have a date for providing first wages and planned wages, have been given a NAICS industry code that aligns with accommodation and food services, construction, manufacturing, retail, professional, scientific or technical services, educational services and healthcare.
Source: Census Bureau, Haver Analytics, Apollo Chief Economist
Business applications have increased across sectors
Source: Census Bureau, Haver Analytics, Apollo Chief Economist
There are a lot of entrepreneurs in Florida
Source: Census Bureau, Apollo Chief Economist. Note: Data for 2022.

Download high-res chart(s)

Recent Posts

  • Comparing Wage Growth for Job Stayers and Job Switchers
  • Different Retirement Systems in Europe
  • AI Bubble Today Is Bigger Than the IT Bubble in the 1990s
  • 75% of Restaurant Orders Are Delivery Orders
  • Japan: Negative Population Growth = More Empty Homes

Recent Comments

No comments to show.

Archives

  • July 2025
  • June 2025
  • May 2025
  • April 2025
  • March 2025
  • February 2025
  • January 2025
  • December 2024
  • November 2024
  • October 2024
  • September 2024
  • August 2024
  • July 2024
  • June 2024
  • May 2024
  • April 2024
  • March 2024
  • February 2024
  • January 2024
  • December 2023
  • November 2023
  • October 2023
  • September 2023
  • August 2023
  • July 2023
  • June 2023
  • May 2023
  • April 2023
  • March 2023
  • February 2023
  • January 2023
  • December 2022
  • November 2022
  • October 2022
  • September 2022
  • August 2022
  • July 2022
  • June 2022
  • May 2022
  • April 2022
  • March 2022
  • February 2022
  • January 2022
  • December 2021
  • November 2021

Categories

  • Apollo Answers
  • Course Introductions
  • Economic Intelligence
  • Hide from Wordpress Search
  • Investment Knowledge
  • Perspectives
  • Redirecting
  • The Daily Spark
  • The View from Apollo
  • The Weekly Brief
  • Uncategorized
  • White Papers

Italy: More Foreigners Buying Italian Government Debt

The share of Italian government bonds held by non-residents has increased over the past year, see chart below.

More foreigners are buying Italian government debt
Source: Bank of Italy, Apollo Chief Economist. Note: Monetary Financial Institutions include banks, money market funds and ECB.

Download high-res chart(s)

Recent Posts

  • Comparing Wage Growth for Job Stayers and Job Switchers
  • Different Retirement Systems in Europe
  • AI Bubble Today Is Bigger Than the IT Bubble in the 1990s
  • 75% of Restaurant Orders Are Delivery Orders
  • Japan: Negative Population Growth = More Empty Homes

Recent Comments

No comments to show.

Archives

  • July 2025
  • June 2025
  • May 2025
  • April 2025
  • March 2025
  • February 2025
  • January 2025
  • December 2024
  • November 2024
  • October 2024
  • September 2024
  • August 2024
  • July 2024
  • June 2024
  • May 2024
  • April 2024
  • March 2024
  • February 2024
  • January 2024
  • December 2023
  • November 2023
  • October 2023
  • September 2023
  • August 2023
  • July 2023
  • June 2023
  • May 2023
  • April 2023
  • March 2023
  • February 2023
  • January 2023
  • December 2022
  • November 2022
  • October 2022
  • September 2022
  • August 2022
  • July 2022
  • June 2022
  • May 2022
  • April 2022
  • March 2022
  • February 2022
  • January 2022
  • December 2021
  • November 2021

Categories

  • Apollo Answers
  • Course Introductions
  • Economic Intelligence
  • Hide from Wordpress Search
  • Investment Knowledge
  • Perspectives
  • Redirecting
  • The Daily Spark
  • The View from Apollo
  • The Weekly Brief
  • Uncategorized
  • White Papers

Posts navigation

Page 1 Page 2 … Page 4 Next page→
  • Privacy Notice
  • Terms of Use
  • Forward-Looking Statements
Apollo
© Apollo Global Management, Inc. All Rights Reserved.

The Apollo Academy is for informational and educational purposes only and nothing contained herein should be taken as investment advice or a recommendation to enter into any transaction. They are not an invitation by or on behalf of Apollo to any person to buy or sell any security or to adopt any investment strategy, and shall not form the basis of, nor may it accompany nor form part of, any right or contract to buy or sell any security or to adopt any investment strategy. There is no guarantee that the views and opinions expressed in this website will come to pass. For additional information, please see the disclaimers included in each piece of content or the legal page of our website here.