• Apollo.com
  • Login
  • Register Now
light site-logo
  • The Academy
  • Upcoming Events
        • Upcoming Events

        • Hybrid Investments: Flexible Structures for Volatile TimesThursday, May 29, 2025 • 11:00AM ET
  • Learning Center
        • New & UpdatedAlternative Investing Course 2.0

        • Alternative Investing Essentials Part OnePrivate Equity, Venture Capital, Private Credit
        • Alternative Investing Essentials Part TwoReal Estate, Infrastructure, Digital Assets, Hedge Funds
        • Practical ConsiderationsAsset Allocation, Risk Considerations, Fund Structures, Fees
        • Introductory Videos

          View All Videos

        •  Recent Classes & Videos

        • • Private Credit Investing in Volatile Times
        • • Potential Implications of the Latest US Administration Policy Proposals
        • • Beyond 60/40: Private Assets in an Era of High Public Valuations
        • • Investment Grade Private Credit as a Core Fixed Income Allocation
        • • 2025 Economic Outlook: Firing on All Cylinders
        • • Building the Future: Understanding the Tailwinds Behind Infrastructure Investing
        • View All Classes

  • Alternative Perspectives
        • Investment Knowledge
        • The View from Apollo
          • Investment Knowledge White Papers

            Beyond 60/40: Private Assets in an Era of High Public Valuations

            March 21, 2025
          • The View From Apollo

            Private Credit Investing in Volatile Times

            May 9, 2025
          • Investment Knowledge

            Apollo Answers: What Is PIK?

            March 19, 2025
  • The Daily Spark
        • Read The Daily Spark Blog


        • Want it delivered daily to your inbox?
          • The Daily Spark

            The Negative Impact of Tariffs on Earnings

            May 22, 2025
          • The Daily Spark

            Significant Headwinds to Consumer Spending

            May 21, 2025
          • The Daily Spark

            10 Downside Risks to the US Economic Outlook

            May 20, 2025
  • Register for Apollo Academy: Alternative Investing Course
  • Login
  • About Apollo Academy
  • Upcoming Events
  • Learning Center
  • Alternative Perspectives
  • The Daily Spark
  • Register for Apollo Academy: Alternative Investing Course
  • Login
  • Private Credit Investing in Volatile Times
    Tuesday, April 29, 2025 • 11:00am ET
  • Alternative Investing Course 2.0
  • Potential Implications of the Latest US Administration Policy Proposals
  • Beyond 60/40: Private Assets in an Era of Soaring Public Valuations
  • Investment Grade Private Credit as a Core Fixed Income Allocation
  • 2025 Economic Outlook: Where’s the Slowdown?
  • Building the Future: Understanding the Tailwinds Behind Infrastructure Investing
  • Clean Transition Investing: Going Where the Opportunities Are
  • View All Classes
  • Introductory Videos
  • Alternative Investing Essentials Part One • Now Available On Demand
  • Alternative Investing Essentials Part Two • Now Available On Demand
  • Practical Considerations • Now Available On Demand
  • Investment Knowledge
  • The View from Apollo
Home August 2024

Services Spending Normalizing as a Share of Total Consumer Spending

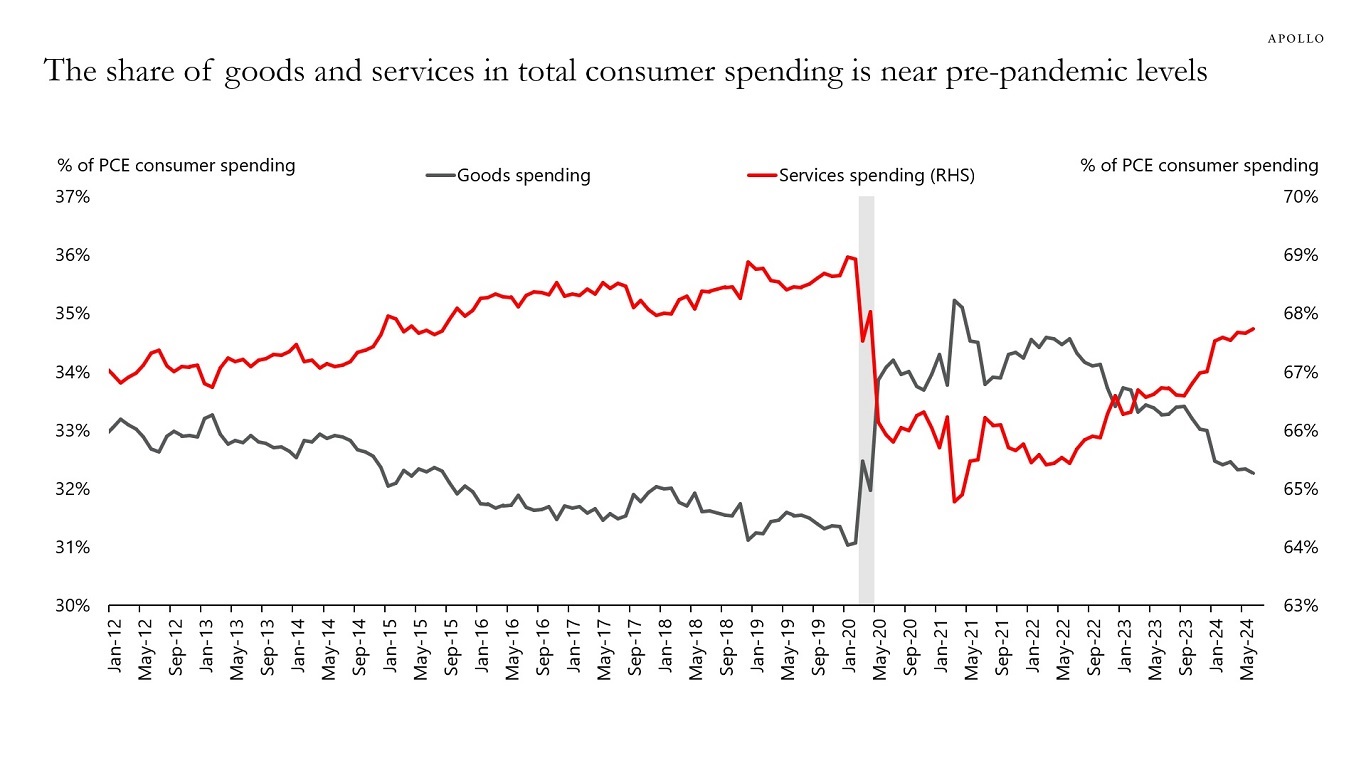
During the pandemic, households increased spending on goods because they were shopping online, and services spending was lowered because they couldn’t go to restaurants and travel.

The chart below shows that consumers have significantly increased spending on services over the past two years, and the current share at 68% is now close to pre-pandemic levels.

The bottom line is that we are getting to the end of the catch-up effect for companies in the consumer services industry.

Source: BEA, Haver Analytics, Apollo Chief Economist

Download high-res chart

Recent Posts

  • The Negative Impact of Tariffs on Earnings
  • Significant Headwinds to Consumer Spending
  • 10 Downside Risks to the US Economic Outlook
  • Declining Foreign Participation in US Treasury 30-Year Auctions
  • The Coming Energy Transition

Recent Comments

No comments to show.

Archives

  • May 2025
  • April 2025
  • March 2025
  • February 2025
  • January 2025
  • December 2024
  • November 2024
  • October 2024
  • September 2024
  • August 2024
  • July 2024
  • June 2024
  • May 2024
  • April 2024
  • March 2024
  • February 2024
  • January 2024
  • December 2023
  • November 2023
  • October 2023
  • September 2023
  • August 2023
  • July 2023
  • June 2023
  • May 2023
  • April 2023
  • March 2023
  • February 2023
  • January 2023
  • December 2022
  • November 2022
  • October 2022
  • September 2022
  • August 2022
  • July 2022
  • June 2022
  • May 2022
  • April 2022
  • March 2022
  • February 2022
  • January 2022
  • December 2021
  • November 2021

Categories

  • Apollo Answers
  • Course Introductions
  • Economic Intelligence
  • Hide from Wordpress Search
  • Investment Knowledge
  • Perspectives
  • Redirecting
  • The Daily Spark
  • The View from Apollo
  • The Weekly Brief
  • Uncategorized
  • White Papers

Negative Population Growth in China

Population growth in China has now turned negative. This is important because a growing labor force used to be a strong driver of growth in China. Combined with falling home prices and ongoing trade wars with Europe and the US, the headwinds to growth in China are intensifying. One implication for markets is continued downward pressure on commodity prices.

China’s population growth has turned negative
Source: CNBS, Haver Analytics, Apollo Chief Economist. Note: Natural population growth shown. Natural population growth = (birth rate – death rate) * total population.

Download high-res chart

Recent Posts

  • The Negative Impact of Tariffs on Earnings
  • Significant Headwinds to Consumer Spending
  • 10 Downside Risks to the US Economic Outlook
  • Declining Foreign Participation in US Treasury 30-Year Auctions
  • The Coming Energy Transition

Recent Comments

No comments to show.

Archives

  • May 2025
  • April 2025
  • March 2025
  • February 2025
  • January 2025
  • December 2024
  • November 2024
  • October 2024
  • September 2024
  • August 2024
  • July 2024
  • June 2024
  • May 2024
  • April 2024
  • March 2024
  • February 2024
  • January 2024
  • December 2023
  • November 2023
  • October 2023
  • September 2023
  • August 2023
  • July 2023
  • June 2023
  • May 2023
  • April 2023
  • March 2023
  • February 2023
  • January 2023
  • December 2022
  • November 2022
  • October 2022
  • September 2022
  • August 2022
  • July 2022
  • June 2022
  • May 2022
  • April 2022
  • March 2022
  • February 2022
  • January 2022
  • December 2021
  • November 2021

Categories

  • Apollo Answers
  • Course Introductions
  • Economic Intelligence
  • Hide from Wordpress Search
  • Investment Knowledge
  • Perspectives
  • Redirecting
  • The Daily Spark
  • The View from Apollo
  • The Weekly Brief
  • Uncategorized
  • White Papers

Small Business Optimism Rising

Small business optimism is at the same level as when the Fed started raising interest rates in March 2022, see chart below. This is not a recession. If anything, this suggests the economy is reaccelerating.

Small business optimism back at March 2022 levels when the Fed started raising rates
Source: NFIB, Haver Analytics, Apollo Chief Economist

Download high-res chart(s)

Recent Posts

  • The Negative Impact of Tariffs on Earnings
  • Significant Headwinds to Consumer Spending
  • 10 Downside Risks to the US Economic Outlook
  • Declining Foreign Participation in US Treasury 30-Year Auctions
  • The Coming Energy Transition

Recent Comments

No comments to show.

Archives

  • May 2025
  • April 2025
  • March 2025
  • February 2025
  • January 2025
  • December 2024
  • November 2024
  • October 2024
  • September 2024
  • August 2024
  • July 2024
  • June 2024
  • May 2024
  • April 2024
  • March 2024
  • February 2024
  • January 2024
  • December 2023
  • November 2023
  • October 2023
  • September 2023
  • August 2023
  • July 2023
  • June 2023
  • May 2023
  • April 2023
  • March 2023
  • February 2023
  • January 2023
  • December 2022
  • November 2022
  • October 2022
  • September 2022
  • August 2022
  • July 2022
  • June 2022
  • May 2022
  • April 2022
  • March 2022
  • February 2022
  • January 2022
  • December 2021
  • November 2021

Categories

  • Apollo Answers
  • Course Introductions
  • Economic Intelligence
  • Hide from Wordpress Search
  • Investment Knowledge
  • Perspectives
  • Redirecting
  • The Daily Spark
  • The View from Apollo
  • The Weekly Brief
  • Uncategorized
  • White Papers

The Financial System Is Changing

The financial system is changing.

First, banks are changing, and debanking continues, partly because of banks’ maturity mismatch when using deposits to finance long-term lending and partly because of ongoing changes to market liquidity and market making.

Second, how firms and consumers borrow is changing, with private credit playing a bigger role, and an increased realization that long-term assets such as investments in AI and energy should be matched with long-term liabilities.

Third, how households save for retirement is changing with passive investing growing, democratization of alternatives, and an increased recognition that parts of the 60/40 portfolio invested in highly liquid public markets can be replaced with private fixed income and private equity both for households and institutional investors.

The financial system is changing

Download high-res chart(s)

Recent Posts

  • The Negative Impact of Tariffs on Earnings
  • Significant Headwinds to Consumer Spending
  • 10 Downside Risks to the US Economic Outlook
  • Declining Foreign Participation in US Treasury 30-Year Auctions
  • The Coming Energy Transition

Recent Comments

No comments to show.

Archives

  • May 2025
  • April 2025
  • March 2025
  • February 2025
  • January 2025
  • December 2024
  • November 2024
  • October 2024
  • September 2024
  • August 2024
  • July 2024
  • June 2024
  • May 2024
  • April 2024
  • March 2024
  • February 2024
  • January 2024
  • December 2023
  • November 2023
  • October 2023
  • September 2023
  • August 2023
  • July 2023
  • June 2023
  • May 2023
  • April 2023
  • March 2023
  • February 2023
  • January 2023
  • December 2022
  • November 2022
  • October 2022
  • September 2022
  • August 2022
  • July 2022
  • June 2022
  • May 2022
  • April 2022
  • March 2022
  • February 2022
  • January 2022
  • December 2021
  • November 2021

Categories

  • Apollo Answers
  • Course Introductions
  • Economic Intelligence
  • Hide from Wordpress Search
  • Investment Knowledge
  • Perspectives
  • Redirecting
  • The Daily Spark
  • The View from Apollo
  • The Weekly Brief
  • Uncategorized
  • White Papers

The Economy Is Doing Just Fine

Looking at the latest daily and weekly data shows that retail sales are strong, jobless claims are falling, restaurant bookings are strong, air travel is strong, hotel occupancy rates are high, bank credit growth is accelerating, bankruptcy filings are trending lower, credit card spending is solid, and Broadway show attendance and box office grosses are strong. The Atlanta Fed’s GDP Now estimate for third quarter GDP is 2.4%, and the Dallas Fed weekly GDP indicator is 2.3%. Finally, we added a new chart with state-level GDP for New York, California, and Texas, which also shows continued strength, see below. The bottom line is that there are no signs of a recession in the incoming data, see also our chart book with daily and weekly data available here.

Weekly economic indicators for New York, California, and Texas
Source: Baumeister, Christiane, Danilo Leiva-Leon, and Eric Sims (2024), “Tracking Weekly State-Level Economic Conditions,” Review of Economics and Statistics, 106(2), 483-504., Apollo Chief Economist. Note: The economic conditions indices are computed with mixed-frequency dynamic factor models with weekly, monthly, and quarterly variables that cover multiple dimensions of state economies. The indices are scaled to 4-quarter growth rates of US real GDP and normalized such that a value of zero indicates national long-run growth.

Download high-res chart(s)

Recent Posts

  • The Negative Impact of Tariffs on Earnings
  • Significant Headwinds to Consumer Spending
  • 10 Downside Risks to the US Economic Outlook
  • Declining Foreign Participation in US Treasury 30-Year Auctions
  • The Coming Energy Transition

Recent Comments

No comments to show.

Archives

  • May 2025
  • April 2025
  • March 2025
  • February 2025
  • January 2025
  • December 2024
  • November 2024
  • October 2024
  • September 2024
  • August 2024
  • July 2024
  • June 2024
  • May 2024
  • April 2024
  • March 2024
  • February 2024
  • January 2024
  • December 2023
  • November 2023
  • October 2023
  • September 2023
  • August 2023
  • July 2023
  • June 2023
  • May 2023
  • April 2023
  • March 2023
  • February 2023
  • January 2023
  • December 2022
  • November 2022
  • October 2022
  • September 2022
  • August 2022
  • July 2022
  • June 2022
  • May 2022
  • April 2022
  • March 2022
  • February 2022
  • January 2022
  • December 2021
  • November 2021

Categories

  • Apollo Answers
  • Course Introductions
  • Economic Intelligence
  • Hide from Wordpress Search
  • Investment Knowledge
  • Perspectives
  • Redirecting
  • The Daily Spark
  • The View from Apollo
  • The Weekly Brief
  • Uncategorized
  • White Papers

Too Early to Buy Distressed CRE

The argument for buying distressed commercial real estate today is that interest rates are about to come down. But if interest rates come down because of a recession, then buying distressed CRE today is not a good idea. If the economy starts to slow down more meaningfully, as the consensus expects, the problems for rental housing, multifamily, and warehouses will get a lot worse.

CMBS loan delinquency for office
Source: Moody’s, Apollo Chief Economist

Download high-res chart(s)

Recent Posts

  • The Negative Impact of Tariffs on Earnings
  • Significant Headwinds to Consumer Spending
  • 10 Downside Risks to the US Economic Outlook
  • Declining Foreign Participation in US Treasury 30-Year Auctions
  • The Coming Energy Transition

Recent Comments

No comments to show.

Archives

  • May 2025
  • April 2025
  • March 2025
  • February 2025
  • January 2025
  • December 2024
  • November 2024
  • October 2024
  • September 2024
  • August 2024
  • July 2024
  • June 2024
  • May 2024
  • April 2024
  • March 2024
  • February 2024
  • January 2024
  • December 2023
  • November 2023
  • October 2023
  • September 2023
  • August 2023
  • July 2023
  • June 2023
  • May 2023
  • April 2023
  • March 2023
  • February 2023
  • January 2023
  • December 2022
  • November 2022
  • October 2022
  • September 2022
  • August 2022
  • July 2022
  • June 2022
  • May 2022
  • April 2022
  • March 2022
  • February 2022
  • January 2022
  • December 2021
  • November 2021

Categories

  • Apollo Answers
  • Course Introductions
  • Economic Intelligence
  • Hide from Wordpress Search
  • Investment Knowledge
  • Perspectives
  • Redirecting
  • The Daily Spark
  • The View from Apollo
  • The Weekly Brief
  • Uncategorized
  • White Papers

Central Bank Gold Demand Remains Strong

Central banks are buying more gold, see charts below.

Central banks buying more gold
Source: World Gold Council, Apollo Chief Economist
Central bank gold demand remains strong
Source: World Gold Council, Apollo Chief Economist

Download high-res chart(s)

Recent Posts

  • The Negative Impact of Tariffs on Earnings
  • Significant Headwinds to Consumer Spending
  • 10 Downside Risks to the US Economic Outlook
  • Declining Foreign Participation in US Treasury 30-Year Auctions
  • The Coming Energy Transition

Recent Comments

No comments to show.

Archives

  • May 2025
  • April 2025
  • March 2025
  • February 2025
  • January 2025
  • December 2024
  • November 2024
  • October 2024
  • September 2024
  • August 2024
  • July 2024
  • June 2024
  • May 2024
  • April 2024
  • March 2024
  • February 2024
  • January 2024
  • December 2023
  • November 2023
  • October 2023
  • September 2023
  • August 2023
  • July 2023
  • June 2023
  • May 2023
  • April 2023
  • March 2023
  • February 2023
  • January 2023
  • December 2022
  • November 2022
  • October 2022
  • September 2022
  • August 2022
  • July 2022
  • June 2022
  • May 2022
  • April 2022
  • March 2022
  • February 2022
  • January 2022
  • December 2021
  • November 2021

Categories

  • Apollo Answers
  • Course Introductions
  • Economic Intelligence
  • Hide from Wordpress Search
  • Investment Knowledge
  • Perspectives
  • Redirecting
  • The Daily Spark
  • The View from Apollo
  • The Weekly Brief
  • Uncategorized
  • White Papers

Household Debt to Income

US households are in much better shape than households in Canada and the UK, see the chart below.

Household debt to income is relatively low in the US
Note: Household debt is defined as all liabilities of households (including non-profit institutions serving households) that require payments of interest or principal by households to the creditors at fixed dates in the future. Debt is calculated as the sum of the following liability categories: loans (primarily mortgage loans and consumer credit) and other accounts payable. The indicator is measured as a percentage of net household disposable income. Source: OECD, Apollo Chief Economist

Download high-res charts

Recent Posts

  • The Negative Impact of Tariffs on Earnings
  • Significant Headwinds to Consumer Spending
  • 10 Downside Risks to the US Economic Outlook
  • Declining Foreign Participation in US Treasury 30-Year Auctions
  • The Coming Energy Transition

Recent Comments

No comments to show.

Archives

  • May 2025
  • April 2025
  • March 2025
  • February 2025
  • January 2025
  • December 2024
  • November 2024
  • October 2024
  • September 2024
  • August 2024
  • July 2024
  • June 2024
  • May 2024
  • April 2024
  • March 2024
  • February 2024
  • January 2024
  • December 2023
  • November 2023
  • October 2023
  • September 2023
  • August 2023
  • July 2023
  • June 2023
  • May 2023
  • April 2023
  • March 2023
  • February 2023
  • January 2023
  • December 2022
  • November 2022
  • October 2022
  • September 2022
  • August 2022
  • July 2022
  • June 2022
  • May 2022
  • April 2022
  • March 2022
  • February 2022
  • January 2022
  • December 2021
  • November 2021

Categories

  • Apollo Answers
  • Course Introductions
  • Economic Intelligence
  • Hide from Wordpress Search
  • Investment Knowledge
  • Perspectives
  • Redirecting
  • The Daily Spark
  • The View from Apollo
  • The Weekly Brief
  • Uncategorized
  • White Papers

S&P 500 Firms Less Worried About a Recession

The media is full of anecdotes from earnings calls about the economy supposedly slowing down.

But the reality is that firms on earnings calls talk less and less about recession, see chart below.

In fact, we have never had a recession at the current low level of recession talk, see again chart below.

S&P 500: Number of times the word “recession” was mentioned on earnings calls
Source: Bloomberg, Apollo Chief Economist

Download high-res chart(s)

Recent Posts

  • The Negative Impact of Tariffs on Earnings
  • Significant Headwinds to Consumer Spending
  • 10 Downside Risks to the US Economic Outlook
  • Declining Foreign Participation in US Treasury 30-Year Auctions
  • The Coming Energy Transition

Recent Comments

No comments to show.

Archives

  • May 2025
  • April 2025
  • March 2025
  • February 2025
  • January 2025
  • December 2024
  • November 2024
  • October 2024
  • September 2024
  • August 2024
  • July 2024
  • June 2024
  • May 2024
  • April 2024
  • March 2024
  • February 2024
  • January 2024
  • December 2023
  • November 2023
  • October 2023
  • September 2023
  • August 2023
  • July 2023
  • June 2023
  • May 2023
  • April 2023
  • March 2023
  • February 2023
  • January 2023
  • December 2022
  • November 2022
  • October 2022
  • September 2022
  • August 2022
  • July 2022
  • June 2022
  • May 2022
  • April 2022
  • March 2022
  • February 2022
  • January 2022
  • December 2021
  • November 2021

Categories

  • Apollo Answers
  • Course Introductions
  • Economic Intelligence
  • Hide from Wordpress Search
  • Investment Knowledge
  • Perspectives
  • Redirecting
  • The Daily Spark
  • The View from Apollo
  • The Weekly Brief
  • Uncategorized
  • White Papers

Weaker Demand for Treasuries

When a US government bond auction is announced, a new when-issued bond starts trading, which allows the market to trade the new Treasury bond before the auction has completed. Such trading activity promotes price discovery and allows the market to trade the government bond before it is available for sale.

When the auction is complete, the yield difference between the when-issued bond and the new bond is generally called the tail. Specifically, a one basis point tail means that the auction result was one basis point higher than where the when-issued yield was trading minutes before the auction was completed, normally at 1 p.m.

This past week, there were auctions for 10-year and 30-year Treasuries, and they both tailed three basis points, which signals that demand for Treasuries was significantly weaker than the market expected. The chart below shows tails for 10-year auctions since January 2020, and the chart shows that a three basis point tail is very significant.

The bottom line is that the trend of larger and more frequent tails since the Fed started raising interest rates in March 2022 underscores the importance of investors closely monitoring Treasury auction metrics. These metrics can provide early indications of weakening demand for Treasuries.

It is possible to track tails in Bloomberg using the tickers USN10YTL and USBD30TL.

10-year bond auction tails
Source: US Treasury Department, Bloomberg, Apollo Chief Economist. Note: Bloomberg ticker USN10YTL Index. Auction tail = Difference between the auction draw and when–issued price at auction. A positive tail means the auction yield was higher than or worse than expected. A negative tail means the auction yield was lower than or better than expected.

Download the high-res chart(s)

Recent Posts

  • The Negative Impact of Tariffs on Earnings
  • Significant Headwinds to Consumer Spending
  • 10 Downside Risks to the US Economic Outlook
  • Declining Foreign Participation in US Treasury 30-Year Auctions
  • The Coming Energy Transition

Recent Comments

No comments to show.

Archives

  • May 2025
  • April 2025
  • March 2025
  • February 2025
  • January 2025
  • December 2024
  • November 2024
  • October 2024
  • September 2024
  • August 2024
  • July 2024
  • June 2024
  • May 2024
  • April 2024
  • March 2024
  • February 2024
  • January 2024
  • December 2023
  • November 2023
  • October 2023
  • September 2023
  • August 2023
  • July 2023
  • June 2023
  • May 2023
  • April 2023
  • March 2023
  • February 2023
  • January 2023
  • December 2022
  • November 2022
  • October 2022
  • September 2022
  • August 2022
  • July 2022
  • June 2022
  • May 2022
  • April 2022
  • March 2022
  • February 2022
  • January 2022
  • December 2021
  • November 2021

Categories

  • Apollo Answers
  • Course Introductions
  • Economic Intelligence
  • Hide from Wordpress Search
  • Investment Knowledge
  • Perspectives
  • Redirecting
  • The Daily Spark
  • The View from Apollo
  • The Weekly Brief
  • Uncategorized
  • White Papers

Posts navigation

←Previous page Page 1 Page 2 Page 3 Page 4 Next page→
  • Privacy Notice
  • Terms of Use
  • Forward-Looking Statements
Apollo
© Apollo Global Management, Inc. All Rights Reserved.

The Apollo Academy is for informational and educational purposes only and nothing contained herein should be taken as investment advice or a recommendation to enter into any transaction. They are not an invitation by or on behalf of Apollo to any person to buy or sell any security or to adopt any investment strategy, and shall not form the basis of, nor may it accompany nor form part of, any right or contract to buy or sell any security or to adopt any investment strategy. There is no guarantee that the views and opinions expressed in this website will come to pass. For additional information, please see the disclaimers included in each piece of content or the legal page of our website here.