• Apollo.com
  • Login
  • Register Now
light site-logo
  • The Academy
  • Upcoming Events
        • Upcoming Events

        • Hybrid Investments: Flexible Structures for Volatile TimesThursday, May 29, 2025 • 11:00AM ET
  • Learning Center
        • New & UpdatedAlternative Investing Course 2.0

        • Alternative Investing Essentials Part OnePrivate Equity, Venture Capital, Private Credit
        • Alternative Investing Essentials Part TwoReal Estate, Infrastructure, Digital Assets, Hedge Funds
        • Practical ConsiderationsAsset Allocation, Risk Considerations, Fund Structures, Fees
        • Introductory Videos

          View All Videos

        •  Recent Classes & Videos

        • • Private Credit Investing in Volatile Times
        • • Potential Implications of the Latest US Administration Policy Proposals
        • • Beyond 60/40: Private Assets in an Era of High Public Valuations
        • • Investment Grade Private Credit as a Core Fixed Income Allocation
        • • 2025 Economic Outlook: Firing on All Cylinders
        • • Building the Future: Understanding the Tailwinds Behind Infrastructure Investing
        • View All Classes

  • Alternative Perspectives
        • Investment Knowledge
        • The View from Apollo
          • Investment Knowledge White Papers

            Beyond 60/40: Private Assets in an Era of High Public Valuations

            March 21, 2025
          • The View From Apollo

            Private Credit Investing in Volatile Times

            May 9, 2025
          • Investment Knowledge

            Apollo Answers: What Is PIK?

            March 19, 2025
  • The Daily Spark
        • Read The Daily Spark Blog


        • Want it delivered daily to your inbox?
          • The Daily Spark

            The Coming Energy Transition

            May 18, 2025
          • The Daily Spark

            US Housing Outlook

            May 17, 2025
          • The Daily Spark

            The Fiscal Situation in France and Germany Is Deteriorating

            May 16, 2025
  • Register for Apollo Academy: Alternative Investing Course
  • Login
  • About Apollo Academy
  • Upcoming Events
  • Learning Center
  • Alternative Perspectives
  • The Daily Spark
  • Register for Apollo Academy: Alternative Investing Course
  • Login
  • Private Credit Investing in Volatile Times
    Tuesday, April 29, 2025 • 11:00am ET
  • Alternative Investing Course 2.0
  • Potential Implications of the Latest US Administration Policy Proposals
  • Beyond 60/40: Private Assets in an Era of Soaring Public Valuations
  • Investment Grade Private Credit as a Core Fixed Income Allocation
  • 2025 Economic Outlook: Where’s the Slowdown?
  • Building the Future: Understanding the Tailwinds Behind Infrastructure Investing
  • Clean Transition Investing: Going Where the Opportunities Are
  • View All Classes
  • Introductory Videos
  • Alternative Investing Essentials Part One • Now Available On Demand
  • Alternative Investing Essentials Part Two • Now Available On Demand
  • Practical Considerations • Now Available On Demand
  • Investment Knowledge
  • The View from Apollo
Home April 2025

China Is a Key Source of Pharmaceutical Drugs in the US

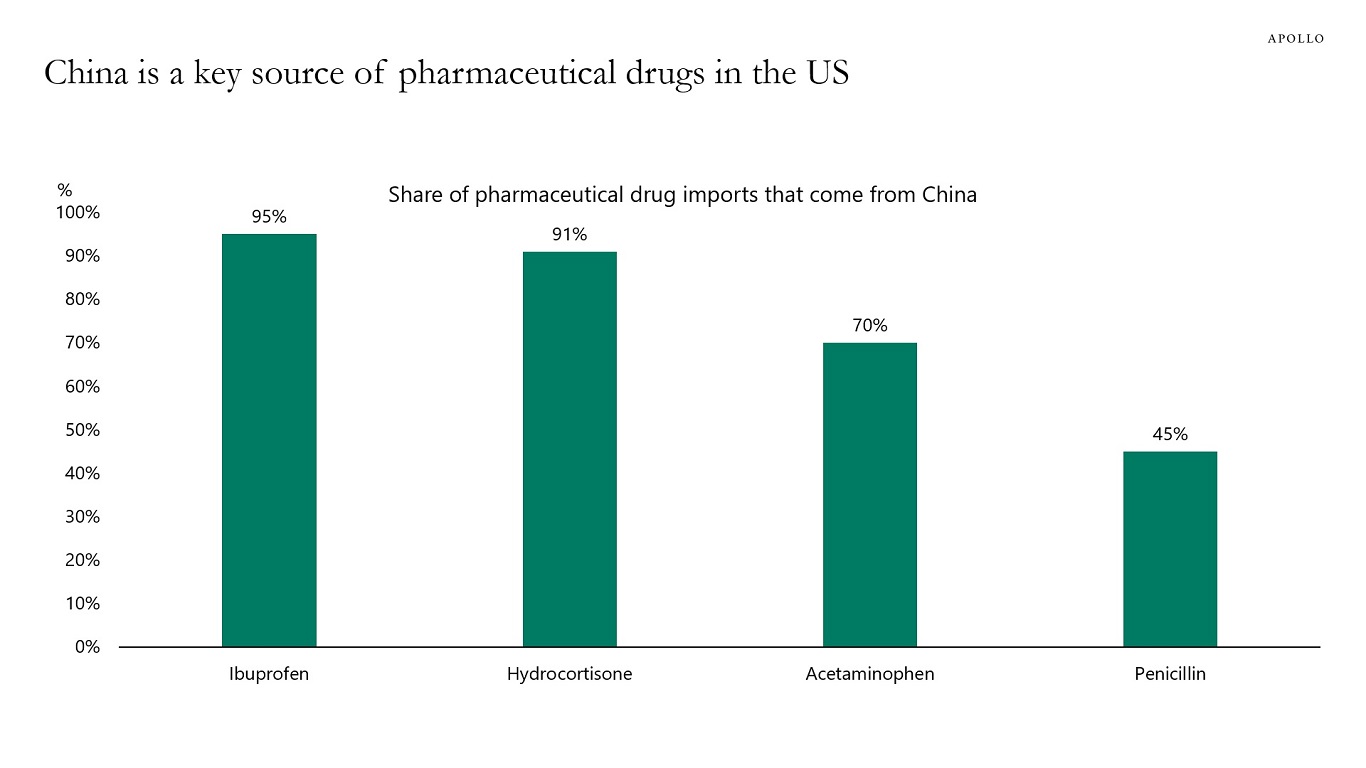
Estimates show that 90% of the inputs in prescription drugs consumed in the US are imported, and the chart below shows the product groups where the US has a high dependency on China.

China is a key source of pharmaceutical drugs in the US
Sources: Skyrocketing Pharmaceutical Imports to the US Endanger National Security | Coalition For A Prosperous America, The geography of prescription pharmaceuticals supplied to the USA: levels, trends, and implications – PMC, Apollo Chief Economist

Dowload high-res chart

Recent Posts

  • The Coming Energy Transition
  • US Housing Outlook
  • The Fiscal Situation in France and Germany Is Deteriorating
  • More Than Half of Expenditures on Imports From China Stays in the US
  • A 10% Trade War Premium for the Dollar

Recent Comments

No comments to show.

Archives

  • May 2025
  • April 2025
  • March 2025
  • February 2025
  • January 2025
  • December 2024
  • November 2024
  • October 2024
  • September 2024
  • August 2024
  • July 2024
  • June 2024
  • May 2024
  • April 2024
  • March 2024
  • February 2024
  • January 2024
  • December 2023
  • November 2023
  • October 2023
  • September 2023
  • August 2023
  • July 2023
  • June 2023
  • May 2023
  • April 2023
  • March 2023
  • February 2023
  • January 2023
  • December 2022
  • November 2022
  • October 2022
  • September 2022
  • August 2022
  • July 2022
  • June 2022
  • May 2022
  • April 2022
  • March 2022
  • February 2022
  • January 2022
  • December 2021
  • November 2021

Categories

  • Apollo Answers
  • Course Introductions
  • Economic Intelligence
  • Hide from Wordpress Search
  • Investment Knowledge
  • Perspectives
  • Redirecting
  • The Daily Spark
  • The View from Apollo
  • The Weekly Brief
  • Uncategorized
  • White Papers

The Employment Report on Friday

The employment report for April will come out on Friday, May 2, and some leading indicators suggest we could see a dramatic weakening in the labor market over the coming months.

Importantly, the survey week for the employment report was the week after Liberation Day tariffs were announced. In other words, the establishment survey and the household survey were carried out during a week with extreme levels of uncertainty for businesses.

The consensus expects 130K jobs created in April. There are significant risks the number is going to be lower, perhaps even negative, see chart below.

Downside risks to employment growth
Sources: US Bureau of Labor Statistics (BLS), University of Michigan, Macrobond, Apollo Chief Economist

Download high-res chart

Recent Posts

  • The Coming Energy Transition
  • US Housing Outlook
  • The Fiscal Situation in France and Germany Is Deteriorating
  • More Than Half of Expenditures on Imports From China Stays in the US
  • A 10% Trade War Premium for the Dollar

Recent Comments

No comments to show.

Archives

  • May 2025
  • April 2025
  • March 2025
  • February 2025
  • January 2025
  • December 2024
  • November 2024
  • October 2024
  • September 2024
  • August 2024
  • July 2024
  • June 2024
  • May 2024
  • April 2024
  • March 2024
  • February 2024
  • January 2024
  • December 2023
  • November 2023
  • October 2023
  • September 2023
  • August 2023
  • July 2023
  • June 2023
  • May 2023
  • April 2023
  • March 2023
  • February 2023
  • January 2023
  • December 2022
  • November 2022
  • October 2022
  • September 2022
  • August 2022
  • July 2022
  • June 2022
  • May 2022
  • April 2022
  • March 2022
  • February 2022
  • January 2022
  • December 2021
  • November 2021

Categories

  • Apollo Answers
  • Course Introductions
  • Economic Intelligence
  • Hide from Wordpress Search
  • Investment Knowledge
  • Perspectives
  • Redirecting
  • The Daily Spark
  • The View from Apollo
  • The Weekly Brief
  • Uncategorized
  • White Papers

Autos Play a Key Role in US Trade

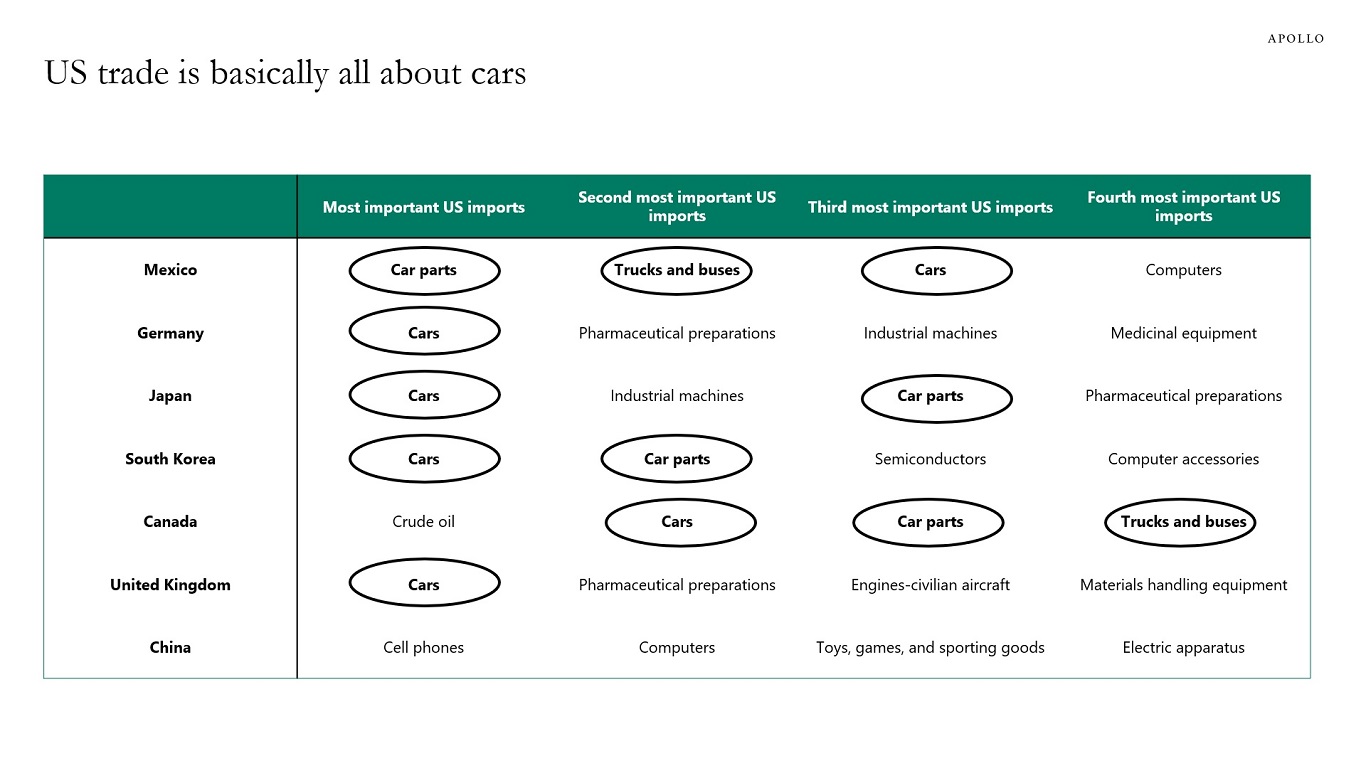
The chart below shows that cars and car parts play a key role in most trade negotiations.

US trade is basically all about cars
Source: Census Bureau, Apollo Chief Economist

Download high-res chart

Recent Posts

  • The Coming Energy Transition
  • US Housing Outlook
  • The Fiscal Situation in France and Germany Is Deteriorating
  • More Than Half of Expenditures on Imports From China Stays in the US
  • A 10% Trade War Premium for the Dollar

Recent Comments

No comments to show.

Archives

  • May 2025
  • April 2025
  • March 2025
  • February 2025
  • January 2025
  • December 2024
  • November 2024
  • October 2024
  • September 2024
  • August 2024
  • July 2024
  • June 2024
  • May 2024
  • April 2024
  • March 2024
  • February 2024
  • January 2024
  • December 2023
  • November 2023
  • October 2023
  • September 2023
  • August 2023
  • July 2023
  • June 2023
  • May 2023
  • April 2023
  • March 2023
  • February 2023
  • January 2023
  • December 2022
  • November 2022
  • October 2022
  • September 2022
  • August 2022
  • July 2022
  • June 2022
  • May 2022
  • April 2022
  • March 2022
  • February 2022
  • January 2022
  • December 2021
  • November 2021

Categories

  • Apollo Answers
  • Course Introductions
  • Economic Intelligence
  • Hide from Wordpress Search
  • Investment Knowledge
  • Perspectives
  • Redirecting
  • The Daily Spark
  • The View from Apollo
  • The Weekly Brief
  • Uncategorized
  • White Papers

Credit Card Data Shows More Consumers Under Pressure

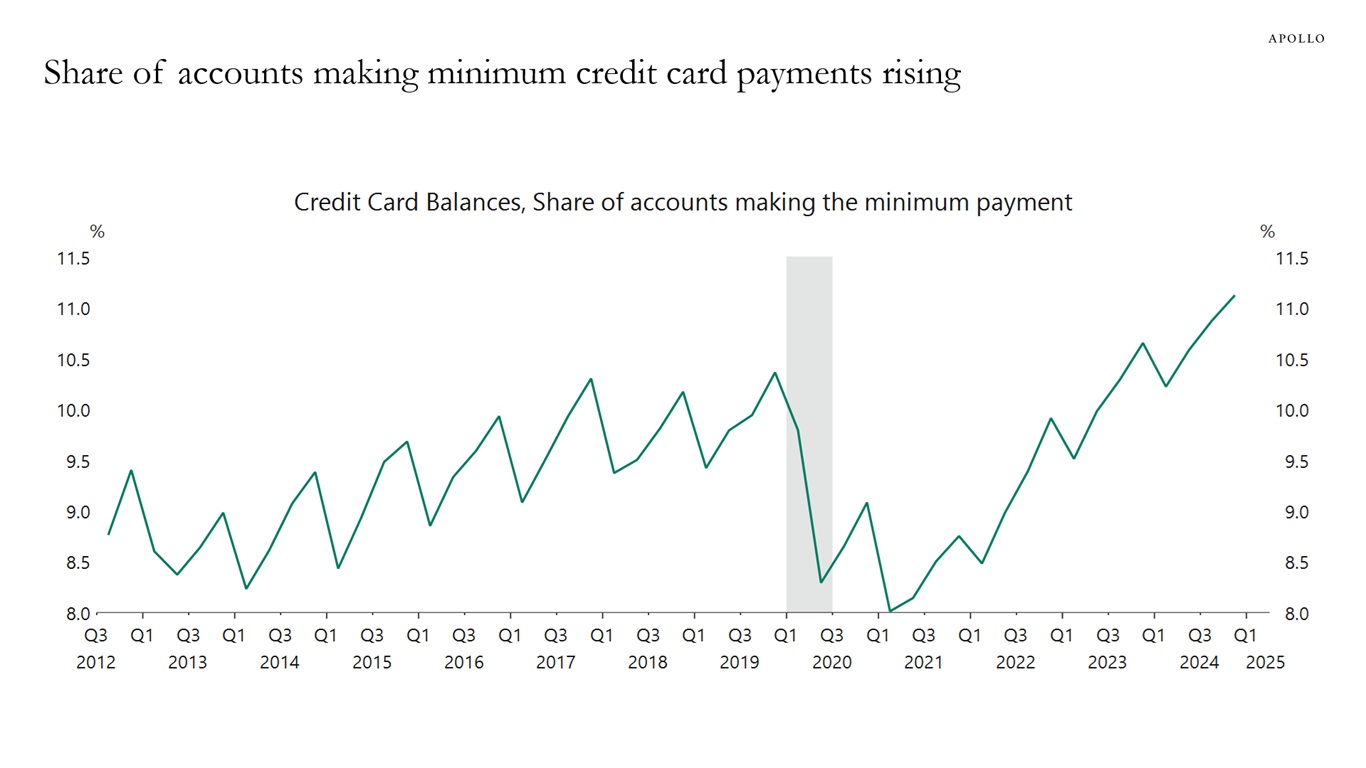
Data from the Fed shows that a record-high share of households are only making the minimum payment on their credit cards, see chart below.

Share of accounts making minimum credit card payments rising
Sources: Federal Reserve Bank of Philadelphia, Macrobond, Apollo Chief Economist

Download high-res chart

Recent Posts

  • The Coming Energy Transition
  • US Housing Outlook
  • The Fiscal Situation in France and Germany Is Deteriorating
  • More Than Half of Expenditures on Imports From China Stays in the US
  • A 10% Trade War Premium for the Dollar

Recent Comments

No comments to show.

Archives

  • May 2025
  • April 2025
  • March 2025
  • February 2025
  • January 2025
  • December 2024
  • November 2024
  • October 2024
  • September 2024
  • August 2024
  • July 2024
  • June 2024
  • May 2024
  • April 2024
  • March 2024
  • February 2024
  • January 2024
  • December 2023
  • November 2023
  • October 2023
  • September 2023
  • August 2023
  • July 2023
  • June 2023
  • May 2023
  • April 2023
  • March 2023
  • February 2023
  • January 2023
  • December 2022
  • November 2022
  • October 2022
  • September 2022
  • August 2022
  • July 2022
  • June 2022
  • May 2022
  • April 2022
  • March 2022
  • February 2022
  • January 2022
  • December 2021
  • November 2021

Categories

  • Apollo Answers
  • Course Introductions
  • Economic Intelligence
  • Hide from Wordpress Search
  • Investment Knowledge
  • Perspectives
  • Redirecting
  • The Daily Spark
  • The View from Apollo
  • The Weekly Brief
  • Uncategorized
  • White Papers

How Are US Consumers and Firms Responding to Tariffs?

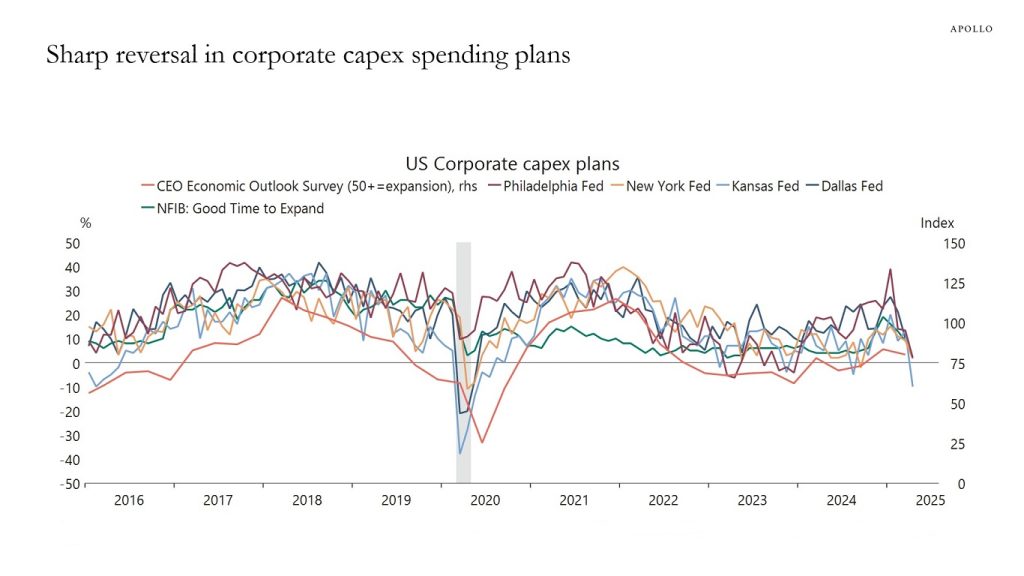
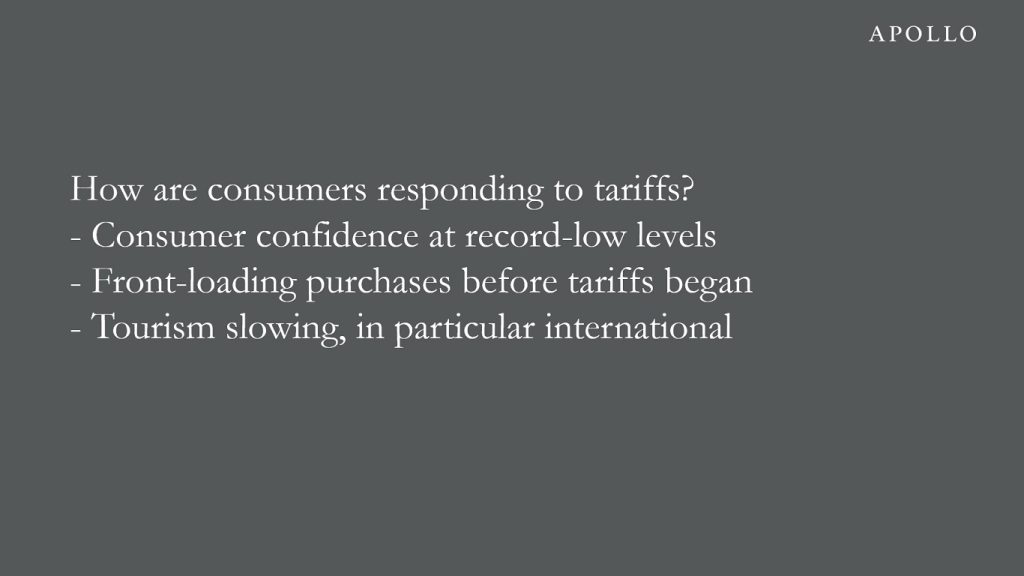
The chart book available here looks at how US consumers and firms are responding to tariffs.

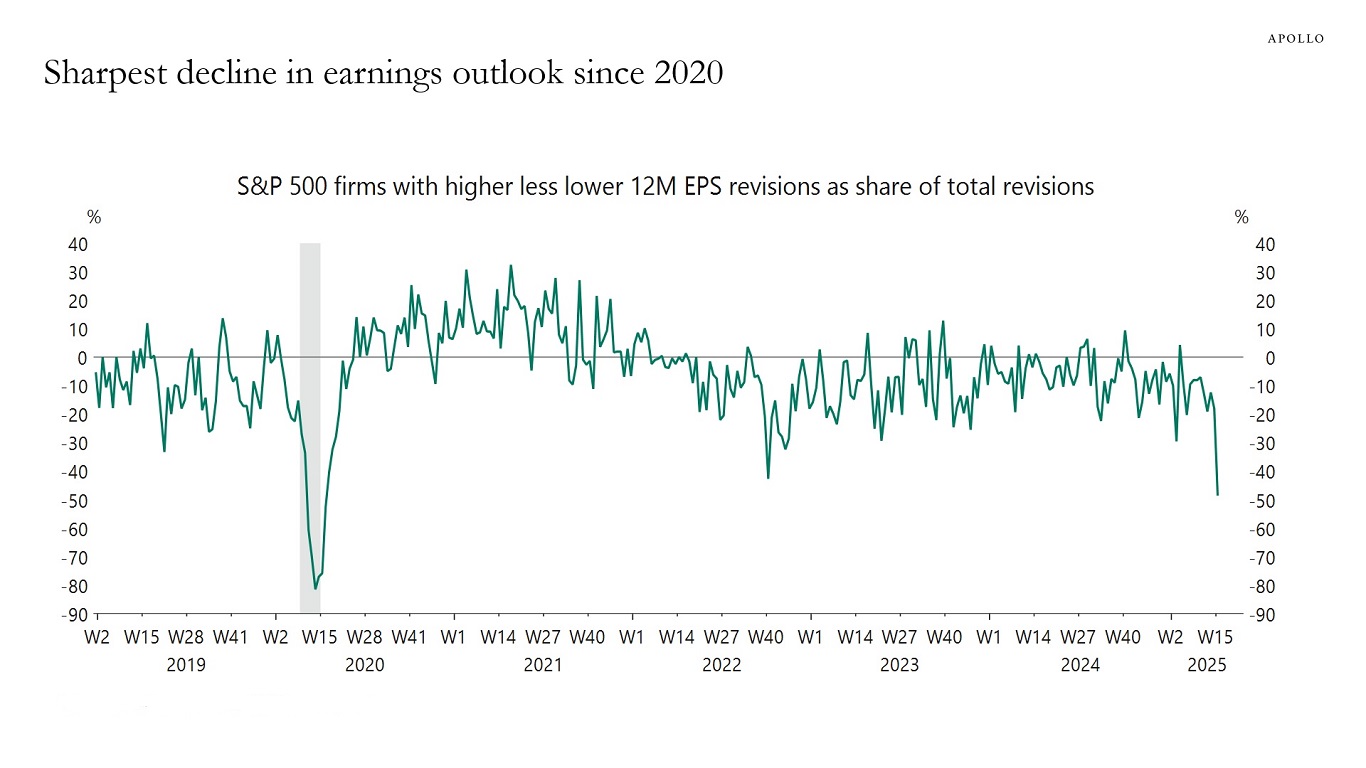
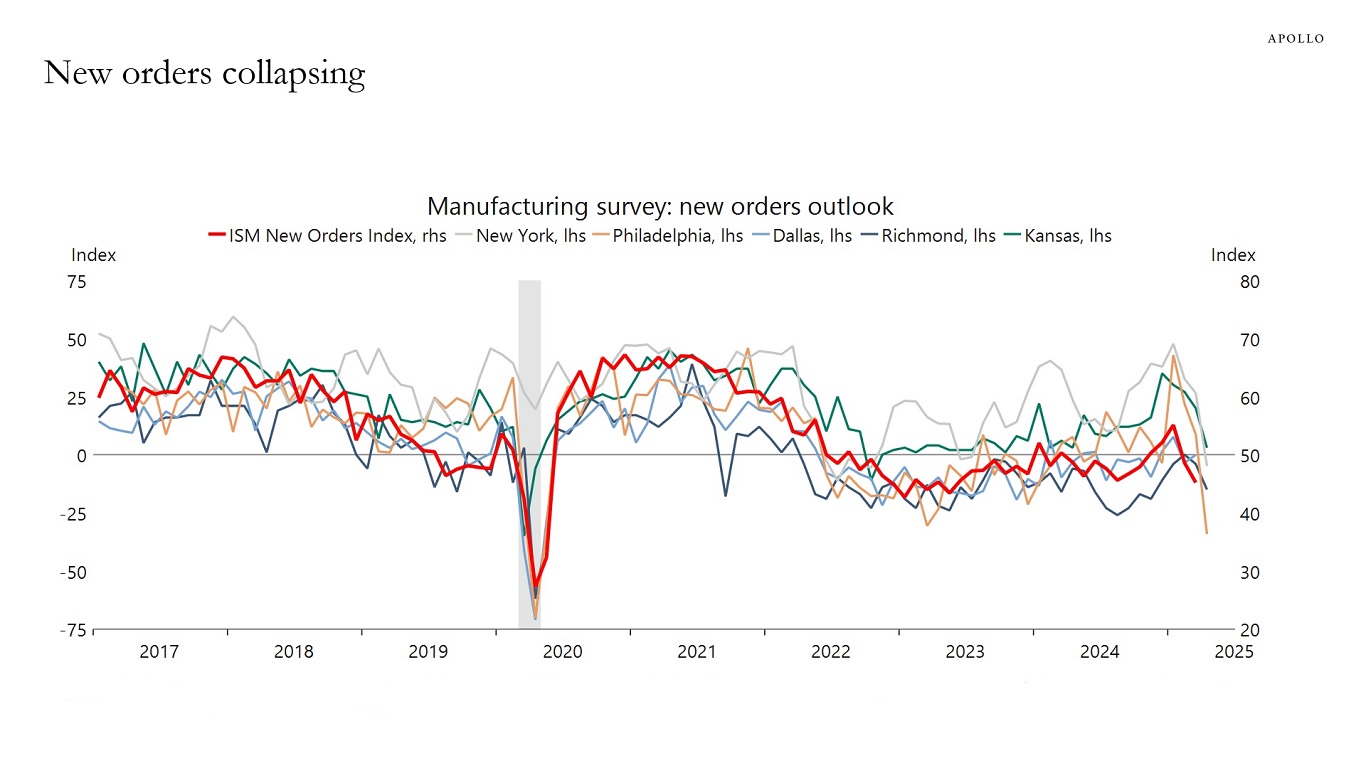
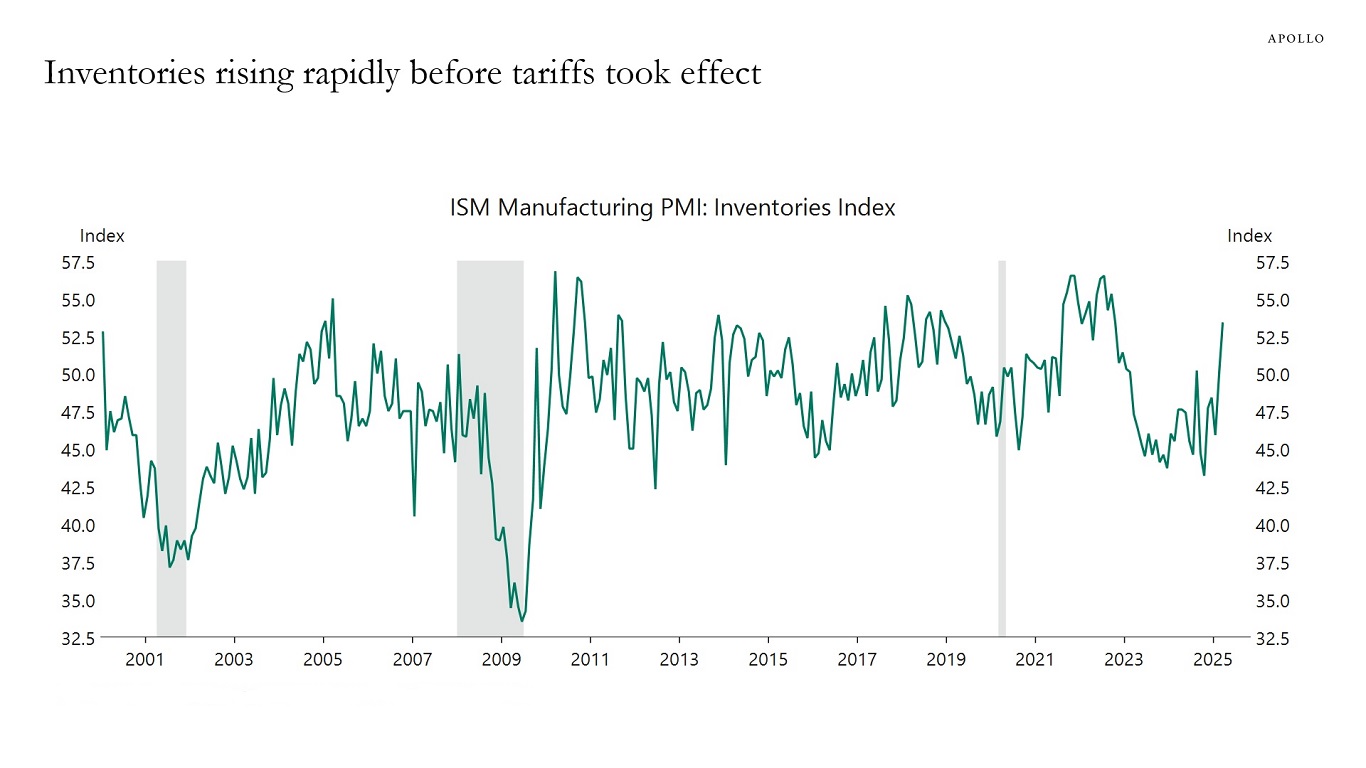
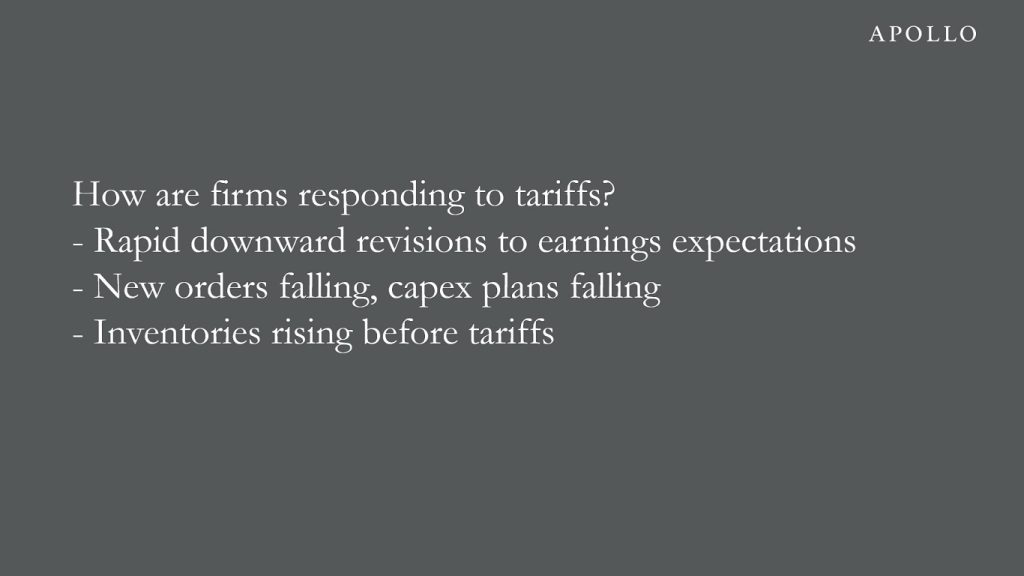
For companies, new orders are falling, capex plans are declining, inventories were rising before tariffs took effect, and firms are revising down earnings expectations.  

For households, consumer confidence is at record-low levels, consumers were front-loading purchases before tariffs began, and tourism is slowing, in particular international travel.

The Voluntary Trade Reset Recession
Source: Apollo Chief Economist
Sharpest decline in earnings outlook since 2020
Source: Bloomberg, Macrobond, Apollo Chief Economist
New orders collapsing
Source: Federal Reserve Bank of Kansas City, Federal Reserve Bank of Richmond, Federal Reserve Bank of Dallas, Federal Reserve Bank of Philadelphia, Federal Reserve Bank of New York, Institute for Supply Management (ISM), Macrobond, Apollo Chief Economist
Source: National Federation of Independent Business, Federal Reserve Bank of Dallas, Federal Reserve Bank of Kansas City, Federal Reserve Bank of New York, Federal Reserve Bank of Philadelphia, Business Roundtable, Macrobond, Apollo Chief Economist
Cost pressures increasing: Prices paid rising
Source: Federal Reserve Bank of Dallas, Federal Reserve Bank of Kansas City, Federal Reserve Bank of New York, Federal Reserve Bank of Philadelphia, U.S. Bureau of Economic Analysis (BEA), Macrobond, Apollo Chief Economist
Inventories rising rapidly before tariffs took effect
Source: Institute for Supply Management (ISM), Macrobond, Apollo Chief Economist
How are consumers responding to tariffs?

Download high-res chart book

Recent Posts

  • The Coming Energy Transition
  • US Housing Outlook
  • The Fiscal Situation in France and Germany Is Deteriorating
  • More Than Half of Expenditures on Imports From China Stays in the US
  • A 10% Trade War Premium for the Dollar

Recent Comments

No comments to show.

Archives

  • May 2025
  • April 2025
  • March 2025
  • February 2025
  • January 2025
  • December 2024
  • November 2024
  • October 2024
  • September 2024
  • August 2024
  • July 2024
  • June 2024
  • May 2024
  • April 2024
  • March 2024
  • February 2024
  • January 2024
  • December 2023
  • November 2023
  • October 2023
  • September 2023
  • August 2023
  • July 2023
  • June 2023
  • May 2023
  • April 2023
  • March 2023
  • February 2023
  • January 2023
  • December 2022
  • November 2022
  • October 2022
  • September 2022
  • August 2022
  • July 2022
  • June 2022
  • May 2022
  • April 2022
  • March 2022
  • February 2022
  • January 2022
  • December 2021
  • November 2021

Categories

  • Apollo Answers
  • Course Introductions
  • Economic Intelligence
  • Hide from Wordpress Search
  • Investment Knowledge
  • Perspectives
  • Redirecting
  • The Daily Spark
  • The View from Apollo
  • The Weekly Brief
  • Uncategorized
  • White Papers

Trade Between China and the US Collapsing

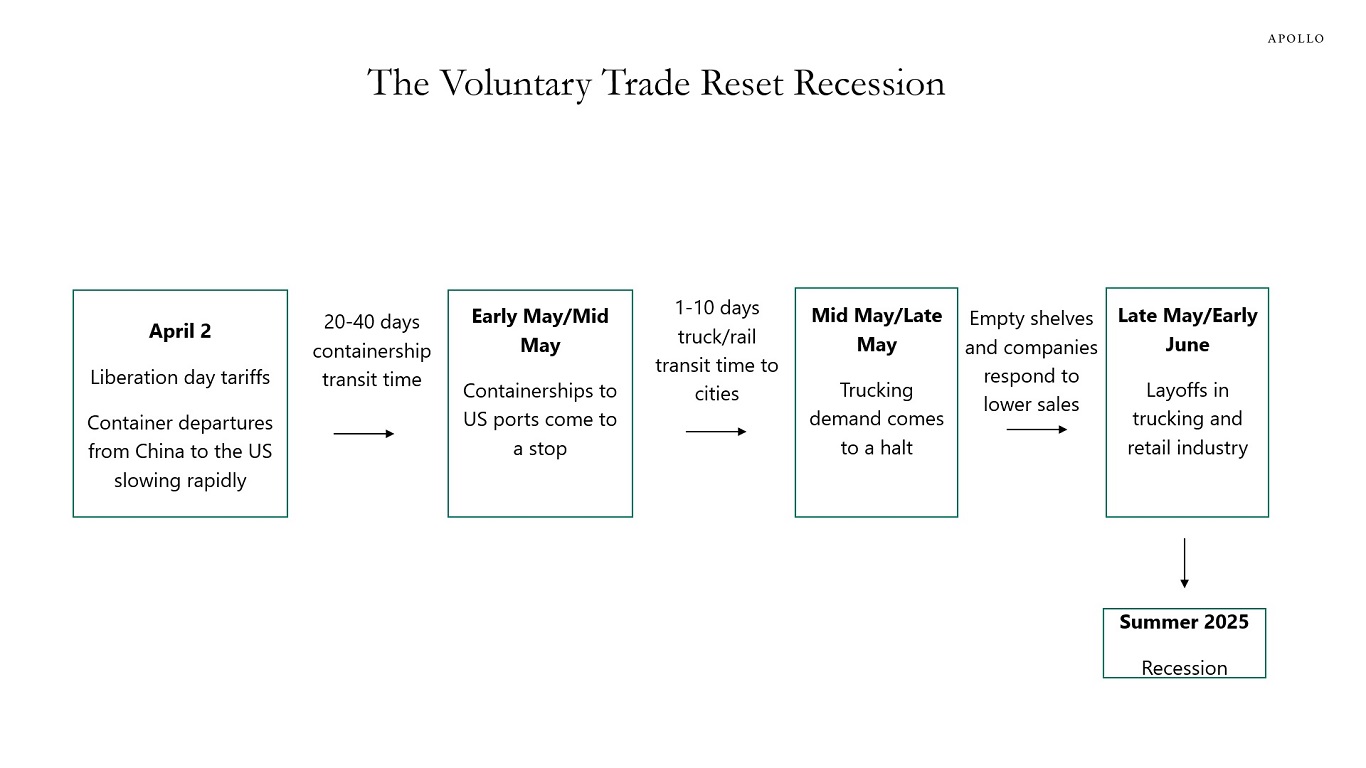
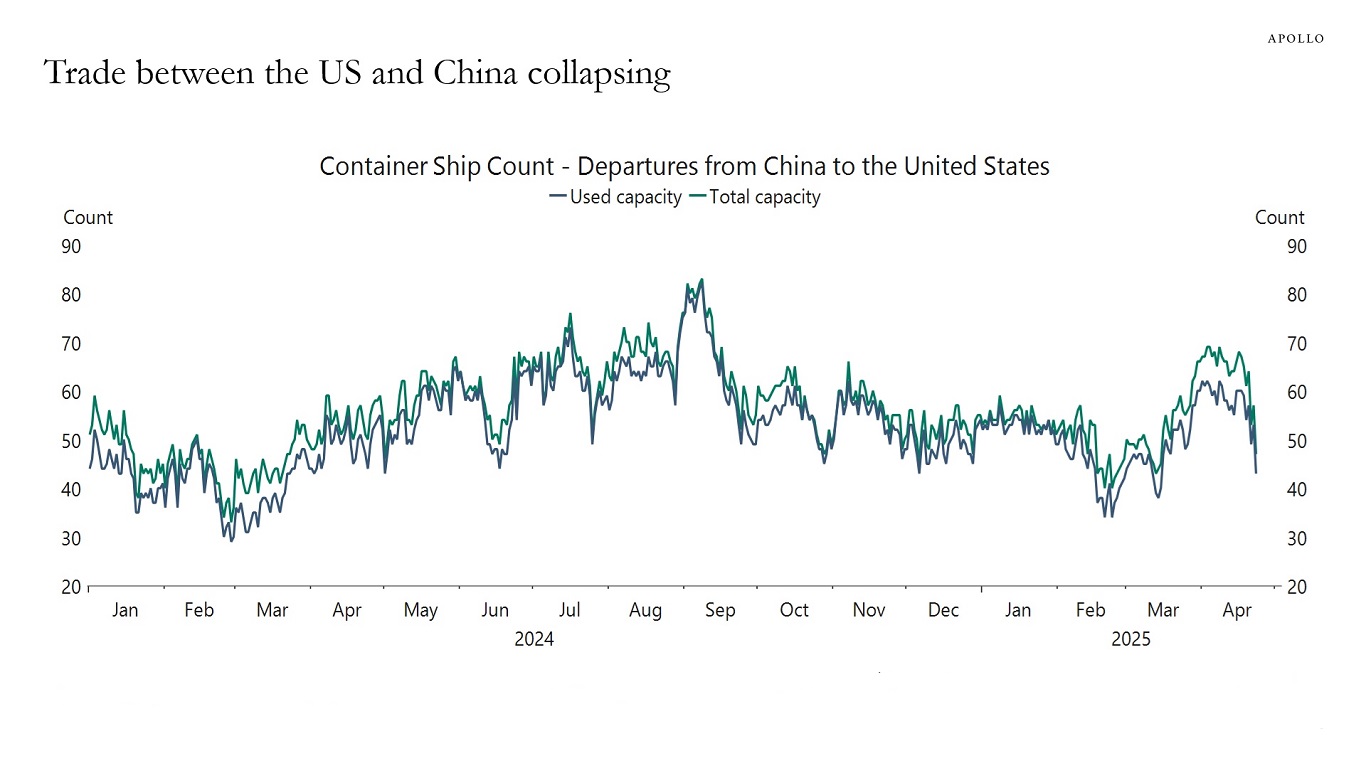
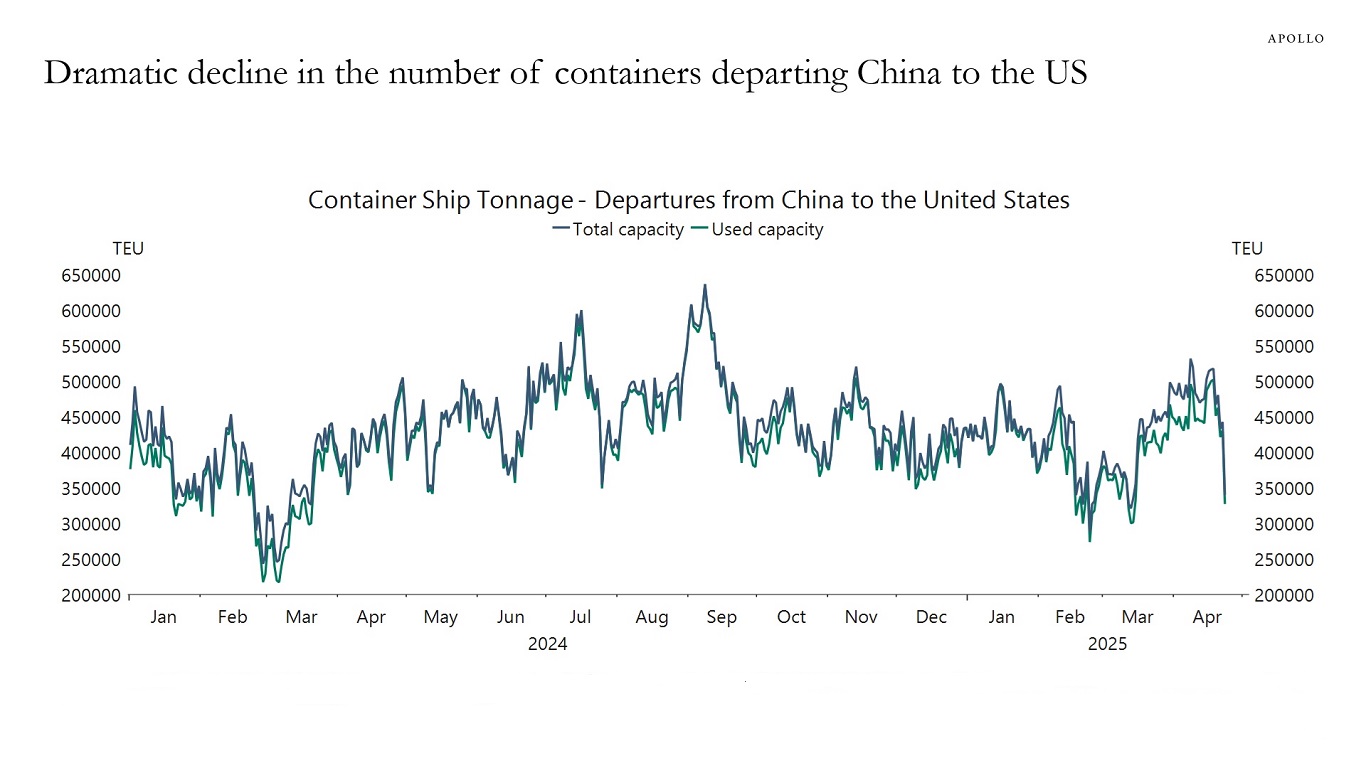
Daily data for container traffic from China to the US is collapsing, see charts below.

The consequence will be empty shelves in US stores in a few weeks and Covid-like shortages for consumers and for firms using Chinese products as intermediate goods.

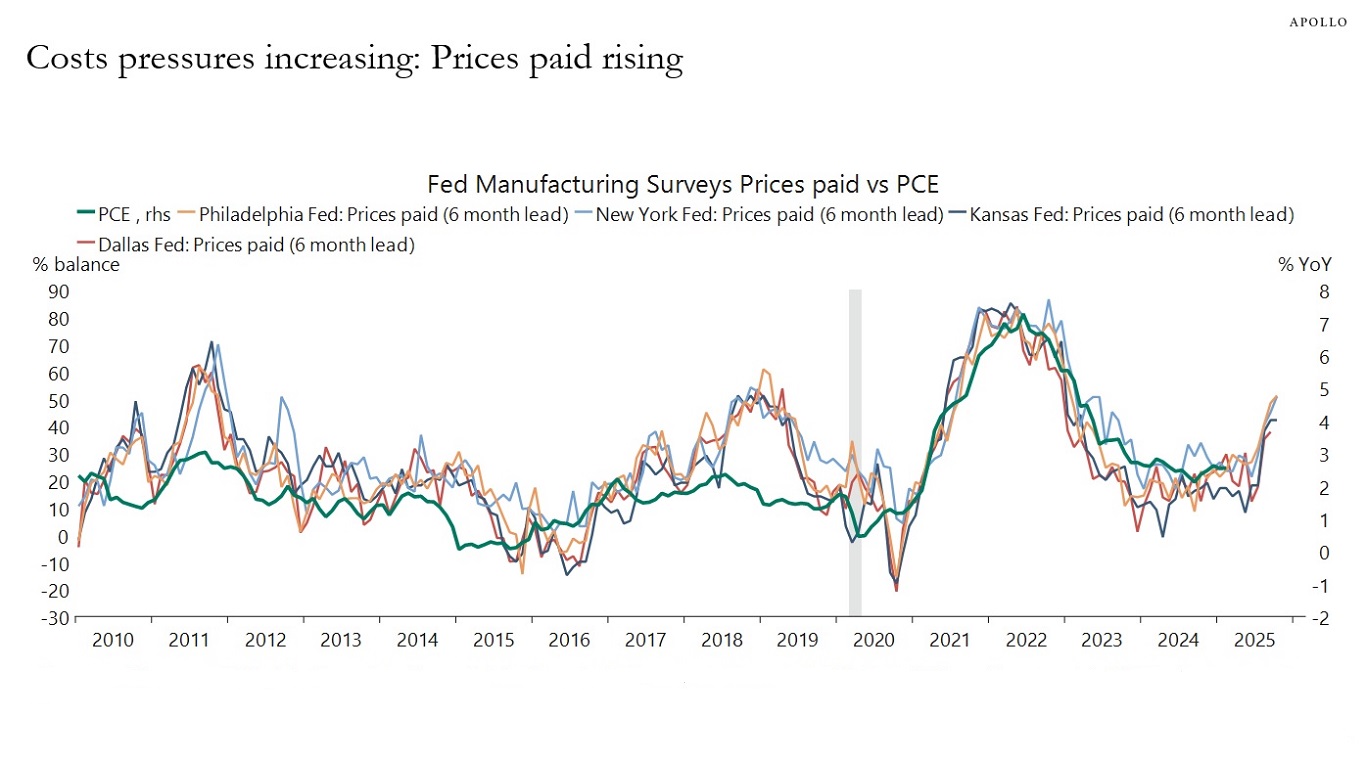
In addition, we will soon begin to see higher inflation because there are a significant number of product categories where China is the main provider of certain goods into the US market.

In May, we will begin to see significant layoffs in trucking, logistics, and retail—particularly in small businesses such as your independent toy store, your independent hardware store, and your independent men’s clothing store. With 9 million people working in trucking-related jobs and 16 million people working in the retail sector, the downside risks to the economy are significant.

Trade between the US and China collapsing
Note: Displays the estimated number of container vessels departing China for the United States, focusing on dry cargo chips. Aggregates data using a 15-day rolling average to reduce short-term volatility and provide a clearer view of broader trends in vessel activity. Sources: Bloomberg, Macrobond, Apollo Chief Economist
Dramatic decline in the number of containers departing China to the US
Note: Represents the aggregated container volume, measured in twenty-foot equivalent units (TEU), of vessels departing China for the United Sates over a 15-day rolling period. Accounts for the shipping capacity being utilized, irrespective of the number of vessels. Sources: Bloomberg, Macrobond, Apollo Chief Economist

Download high-res charts

Recent Posts

  • The Coming Energy Transition
  • US Housing Outlook
  • The Fiscal Situation in France and Germany Is Deteriorating
  • More Than Half of Expenditures on Imports From China Stays in the US
  • A 10% Trade War Premium for the Dollar

Recent Comments

No comments to show.

Archives

  • May 2025
  • April 2025
  • March 2025
  • February 2025
  • January 2025
  • December 2024
  • November 2024
  • October 2024
  • September 2024
  • August 2024
  • July 2024
  • June 2024
  • May 2024
  • April 2024
  • March 2024
  • February 2024
  • January 2024
  • December 2023
  • November 2023
  • October 2023
  • September 2023
  • August 2023
  • July 2023
  • June 2023
  • May 2023
  • April 2023
  • March 2023
  • February 2023
  • January 2023
  • December 2022
  • November 2022
  • October 2022
  • September 2022
  • August 2022
  • July 2022
  • June 2022
  • May 2022
  • April 2022
  • March 2022
  • February 2022
  • January 2022
  • December 2021
  • November 2021

Categories

  • Apollo Answers
  • Course Introductions
  • Economic Intelligence
  • Hide from Wordpress Search
  • Investment Knowledge
  • Perspectives
  • Redirecting
  • The Daily Spark
  • The View from Apollo
  • The Weekly Brief
  • Uncategorized
  • White Papers

Depreciating the Dollar to Grow the Manufacturing Sector

The manufacturing sector in the US has been in steady decline for the past 80 years, and manufacturing jobs today only make up 8% of total US employment. See chart below.

There are three reasons why manufacturing is playing a smaller role: automation, global trade, and significant growth in services, such as the technology sector.

If the dollar falls in value, US exports become cheaper, which encourages foreigners to buy more US manufacturing goods.

But another reason why the rest of the world buys US products is because US products are superior relative to products from other countries, particularly in the services sector, where the US is market-leading with Microsoft, Meta, AWS, Netflix, large language models, etc.

By depreciating the dollar and starting a trade war about goods, which make up less than 10% of US GDP, the US is risking that the rest of the world will slow their imports of the 80% of the US economy that is services, such as iPhones, Windows, Facebook, and large language models.

In addition, a depreciating dollar puts upward pressure on inflation and the term premium, which can create new macroeconomic challenges.

The bottom line is that depreciating the dollar comes with some risks. There is no free lunch in macroeconomics.

Manufacturing employment as a share of total employment has been declining steadily for 80 years
Sources: BLS, Macrobond, Apollo Chief Economist

Download high-res chart

Recent Posts

  • The Coming Energy Transition
  • US Housing Outlook
  • The Fiscal Situation in France and Germany Is Deteriorating
  • More Than Half of Expenditures on Imports From China Stays in the US
  • A 10% Trade War Premium for the Dollar

Recent Comments

No comments to show.

Archives

  • May 2025
  • April 2025
  • March 2025
  • February 2025
  • January 2025
  • December 2024
  • November 2024
  • October 2024
  • September 2024
  • August 2024
  • July 2024
  • June 2024
  • May 2024
  • April 2024
  • March 2024
  • February 2024
  • January 2024
  • December 2023
  • November 2023
  • October 2023
  • September 2023
  • August 2023
  • July 2023
  • June 2023
  • May 2023
  • April 2023
  • March 2023
  • February 2023
  • January 2023
  • December 2022
  • November 2022
  • October 2022
  • September 2022
  • August 2022
  • July 2022
  • June 2022
  • May 2022
  • April 2022
  • March 2022
  • February 2022
  • January 2022
  • December 2021
  • November 2021

Categories

  • Apollo Answers
  • Course Introductions
  • Economic Intelligence
  • Hide from Wordpress Search
  • Investment Knowledge
  • Perspectives
  • Redirecting
  • The Daily Spark
  • The View from Apollo
  • The Weekly Brief
  • Uncategorized
  • White Papers

Investing Implications of Stagflation

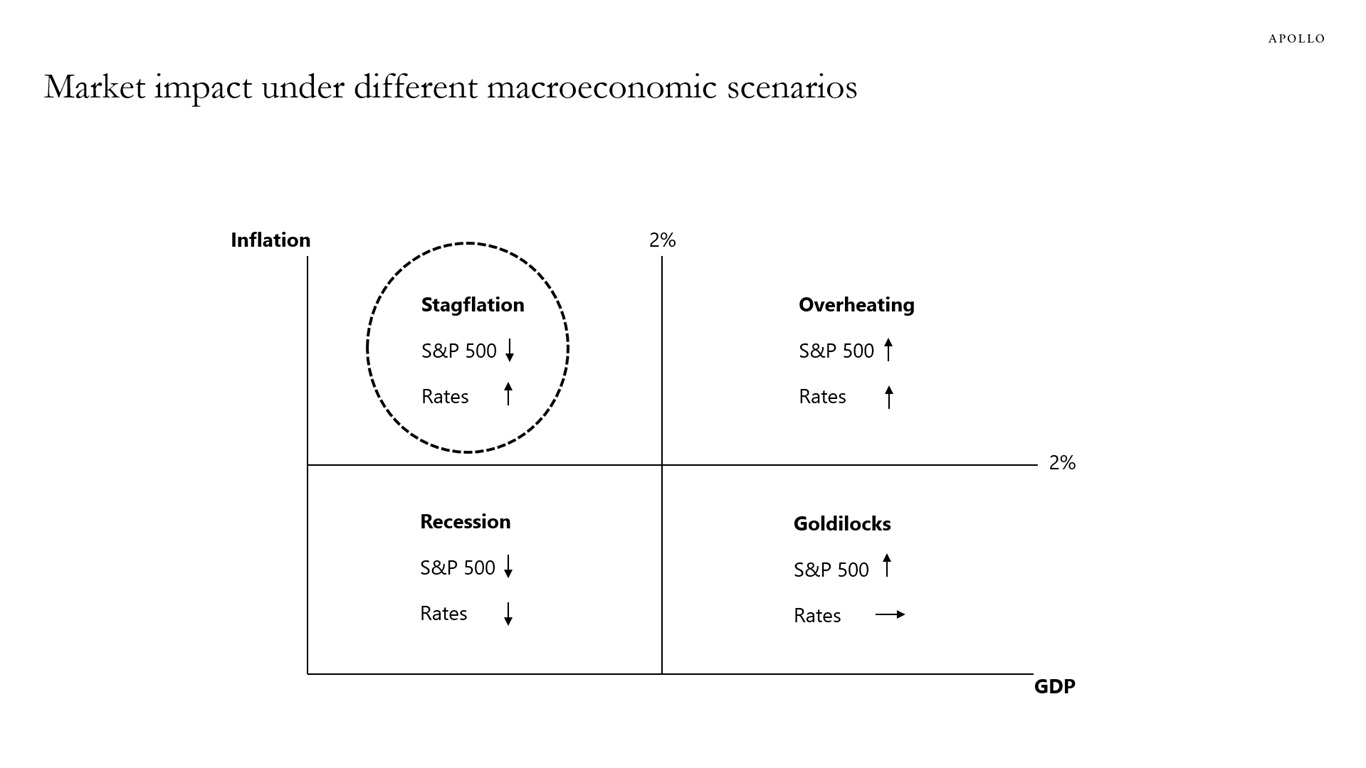
The economics textbook would say that a trade war is a stagflation shock. Tariffs increase consumer prices, and earnings are lower because companies either have to pay some of the tariffs or raise prices for consumers and experience lower demand.

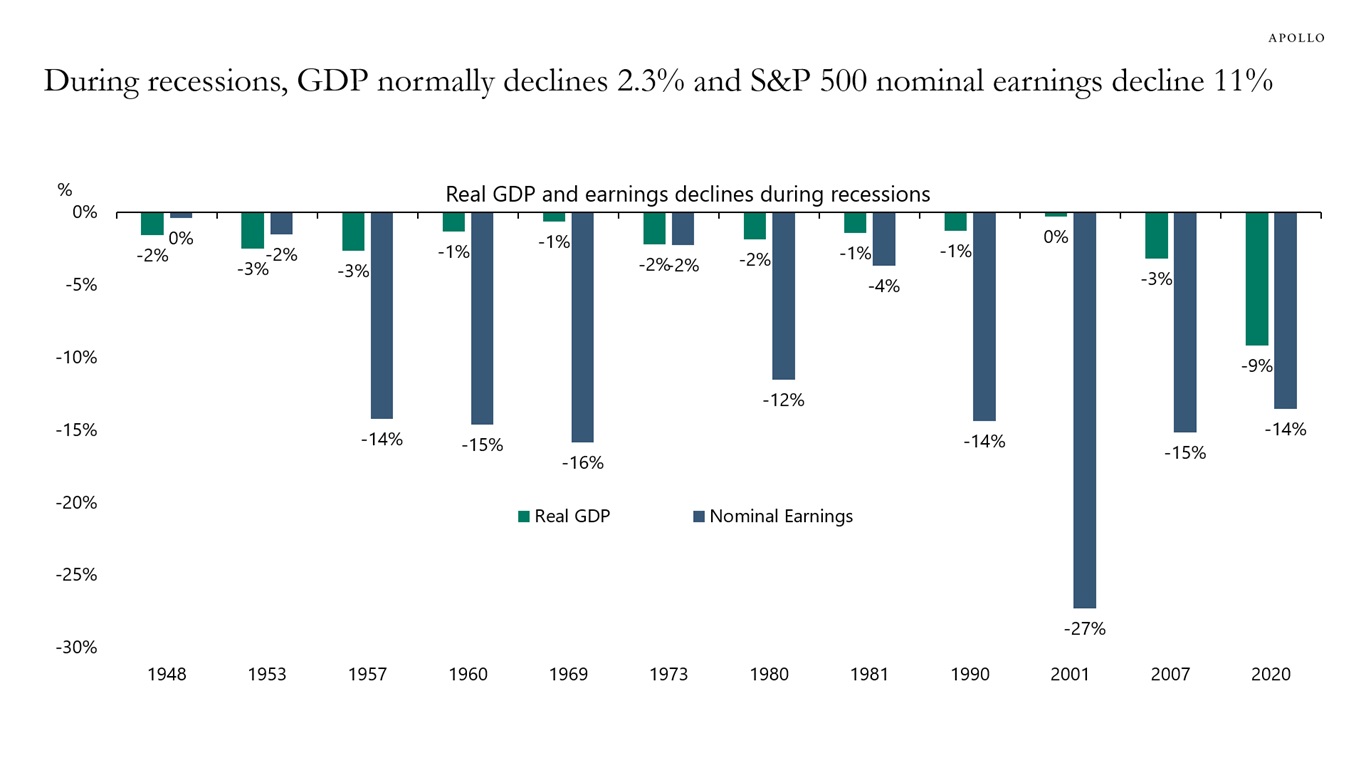
With higher inflation and lower earnings, investors should expect interest rates to stay higher for longer, and investors should expect downward pressure on the stock market as a result of downward pressure on corporate profits, see chart below.

Market impact under different macroeconomic scenarios
Source: Apollo Chief Economist

Download high-res chart

Recent Posts

  • The Coming Energy Transition
  • US Housing Outlook
  • The Fiscal Situation in France and Germany Is Deteriorating
  • More Than Half of Expenditures on Imports From China Stays in the US
  • A 10% Trade War Premium for the Dollar

Recent Comments

No comments to show.

Archives

  • May 2025
  • April 2025
  • March 2025
  • February 2025
  • January 2025
  • December 2024
  • November 2024
  • October 2024
  • September 2024
  • August 2024
  • July 2024
  • June 2024
  • May 2024
  • April 2024
  • March 2024
  • February 2024
  • January 2024
  • December 2023
  • November 2023
  • October 2023
  • September 2023
  • August 2023
  • July 2023
  • June 2023
  • May 2023
  • April 2023
  • March 2023
  • February 2023
  • January 2023
  • December 2022
  • November 2022
  • October 2022
  • September 2022
  • August 2022
  • July 2022
  • June 2022
  • May 2022
  • April 2022
  • March 2022
  • February 2022
  • January 2022
  • December 2021
  • November 2021

Categories

  • Apollo Answers
  • Course Introductions
  • Economic Intelligence
  • Hide from Wordpress Search
  • Investment Knowledge
  • Perspectives
  • Redirecting
  • The Daily Spark
  • The View from Apollo
  • The Weekly Brief
  • Uncategorized
  • White Papers

How Are Imports from China Used in the US?

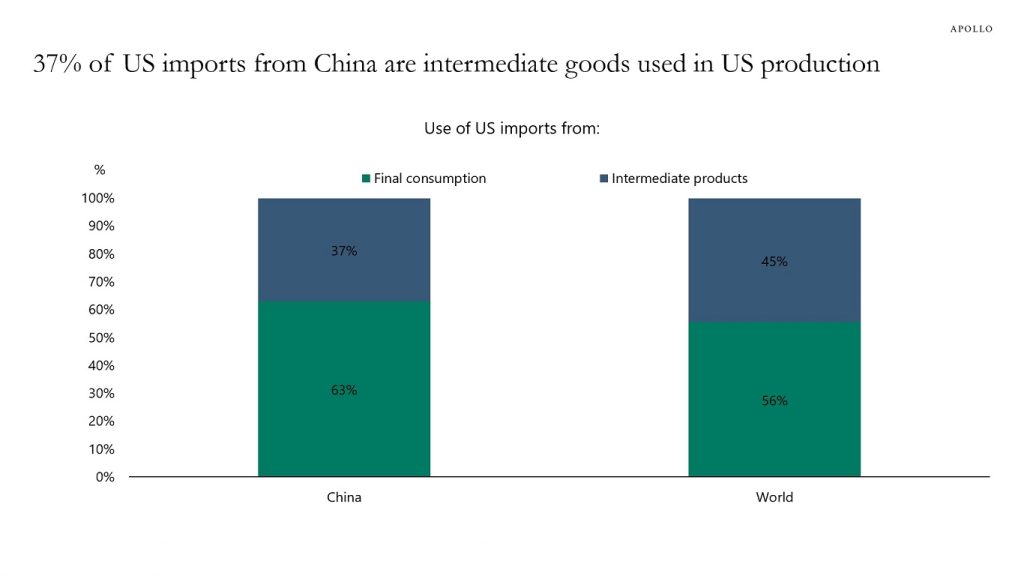
Thirty-seven percent of US imports from China are intermediate goods that are used in US production—such as in the machinery, tool, and auto industries—see chart below. In addition, small and medium-sized enterprises account for 41% of imports from China.

The bottom line is that imports from China are not only t-shirts, shoes, and TV monitors purchased by US consumers. Almost 40% of imports from China are intermediate goods used in US production.

As a result, a dramatic increase in tariffs on China will also increase US companies’ costs of production.

37% of US imports from China are intermediate goods used in US production
Note: Figures may not sum to 100% due to rounding. Sources: How Much Do We Spend on Imports? – San Francisco Fed, Apollo Chief Economist

Download high-res chart

Recent Posts

  • The Coming Energy Transition
  • US Housing Outlook
  • The Fiscal Situation in France and Germany Is Deteriorating
  • More Than Half of Expenditures on Imports From China Stays in the US
  • A 10% Trade War Premium for the Dollar

Recent Comments

No comments to show.

Archives

  • May 2025
  • April 2025
  • March 2025
  • February 2025
  • January 2025
  • December 2024
  • November 2024
  • October 2024
  • September 2024
  • August 2024
  • July 2024
  • June 2024
  • May 2024
  • April 2024
  • March 2024
  • February 2024
  • January 2024
  • December 2023
  • November 2023
  • October 2023
  • September 2023
  • August 2023
  • July 2023
  • June 2023
  • May 2023
  • April 2023
  • March 2023
  • February 2023
  • January 2023
  • December 2022
  • November 2022
  • October 2022
  • September 2022
  • August 2022
  • July 2022
  • June 2022
  • May 2022
  • April 2022
  • March 2022
  • February 2022
  • January 2022
  • December 2021
  • November 2021

Categories

  • Apollo Answers
  • Course Introductions
  • Economic Intelligence
  • Hide from Wordpress Search
  • Investment Knowledge
  • Perspectives
  • Redirecting
  • The Daily Spark
  • The View from Apollo
  • The Weekly Brief
  • Uncategorized
  • White Papers

Average Decline in GDP and EPS During Recessions

Looking back at all recessions since World War II shows that GDP on average declines 2.3% and S&P 500 earnings on average decline 11%, see chart below.

During recessions, GDP normally declines 2.3% and S&P 500 nominal earnings decline 11%
Sources: Robert Shiller, Bloomberg, BEA, Apollo Chief Economist

Download high-res chart

Recent Posts

  • The Coming Energy Transition
  • US Housing Outlook
  • The Fiscal Situation in France and Germany Is Deteriorating
  • More Than Half of Expenditures on Imports From China Stays in the US
  • A 10% Trade War Premium for the Dollar

Recent Comments

No comments to show.

Archives

  • May 2025
  • April 2025
  • March 2025
  • February 2025
  • January 2025
  • December 2024
  • November 2024
  • October 2024
  • September 2024
  • August 2024
  • July 2024
  • June 2024
  • May 2024
  • April 2024
  • March 2024
  • February 2024
  • January 2024
  • December 2023
  • November 2023
  • October 2023
  • September 2023
  • August 2023
  • July 2023
  • June 2023
  • May 2023
  • April 2023
  • March 2023
  • February 2023
  • January 2023
  • December 2022
  • November 2022
  • October 2022
  • September 2022
  • August 2022
  • July 2022
  • June 2022
  • May 2022
  • April 2022
  • March 2022
  • February 2022
  • January 2022
  • December 2021
  • November 2021

Categories

  • Apollo Answers
  • Course Introductions
  • Economic Intelligence
  • Hide from Wordpress Search
  • Investment Knowledge
  • Perspectives
  • Redirecting
  • The Daily Spark
  • The View from Apollo
  • The Weekly Brief
  • Uncategorized
  • White Papers

Posts navigation

Page 1 Page 2 … Page 4 Next page→
  • Privacy Notice
  • Terms of Use
  • Forward-Looking Statements
Apollo
© Apollo Global Management, Inc. All Rights Reserved.

The Apollo Academy is for informational and educational purposes only and nothing contained herein should be taken as investment advice or a recommendation to enter into any transaction. They are not an invitation by or on behalf of Apollo to any person to buy or sell any security or to adopt any investment strategy, and shall not form the basis of, nor may it accompany nor form part of, any right or contract to buy or sell any security or to adopt any investment strategy. There is no guarantee that the views and opinions expressed in this website will come to pass. For additional information, please see the disclaimers included in each piece of content or the legal page of our website here.