• Apollo.com
  • Login
  • Register Now
light site-logo
  • The Academy
  • Upcoming Events
        • Upcoming Events

        • Hybrid Investments: Flexible Structures for Volatile TimesThursday, May 29, 2025 • 11:00AM ET
  • Learning Center
        • New & UpdatedAlternative Investing Course 2.0

        • Alternative Investing Essentials Part OnePrivate Equity, Venture Capital, Private Credit
        • Alternative Investing Essentials Part TwoReal Estate, Infrastructure, Digital Assets, Hedge Funds
        • Practical ConsiderationsAsset Allocation, Risk Considerations, Fund Structures, Fees
        • Introductory Videos

          View All Videos

        •  Recent Classes & Videos

        • • Private Credit Investing in Volatile Times
        • • Potential Implications of the Latest US Administration Policy Proposals
        • • Beyond 60/40: Private Assets in an Era of High Public Valuations
        • • Investment Grade Private Credit as a Core Fixed Income Allocation
        • • 2025 Economic Outlook: Firing on All Cylinders
        • • Building the Future: Understanding the Tailwinds Behind Infrastructure Investing
        • View All Classes

  • Alternative Perspectives
        • Investment Knowledge
        • The View from Apollo
          • Investment Knowledge White Papers

            Beyond 60/40: Private Assets in an Era of High Public Valuations

            March 21, 2025
          • The View From Apollo

            Private Credit Investing in Volatile Times

            May 9, 2025
          • Investment Knowledge

            Apollo Answers: What Is PIK?

            March 19, 2025
  • The Daily Spark
        • Read The Daily Spark Blog


        • Want it delivered daily to your inbox?
          • The Daily Spark

            US Housing Outlook

            May 17, 2025
          • The Daily Spark

            The Fiscal Situation in France and Germany Is Deteriorating

            May 16, 2025
          • The Daily Spark

            More Than Half of Expenditures on Imports From China Stays in the US

            May 15, 2025
  • Register for Apollo Academy: Alternative Investing Course
  • Login
  • About Apollo Academy
  • Upcoming Events
  • Learning Center
  • Alternative Perspectives
  • The Daily Spark
  • Register for Apollo Academy: Alternative Investing Course
  • Login
  • Private Credit Investing in Volatile Times
    Tuesday, April 29, 2025 • 11:00am ET
  • Alternative Investing Course 2.0
  • Potential Implications of the Latest US Administration Policy Proposals
  • Beyond 60/40: Private Assets in an Era of Soaring Public Valuations
  • Investment Grade Private Credit as a Core Fixed Income Allocation
  • 2025 Economic Outlook: Where’s the Slowdown?
  • Building the Future: Understanding the Tailwinds Behind Infrastructure Investing
  • Clean Transition Investing: Going Where the Opportunities Are
  • View All Classes
  • Introductory Videos
  • Alternative Investing Essentials Part One • Now Available On Demand
  • Alternative Investing Essentials Part Two • Now Available On Demand
  • Practical Considerations • Now Available On Demand
  • Investment Knowledge
  • The View from Apollo
Home March 2024

More Bankruptcy Reorganizations

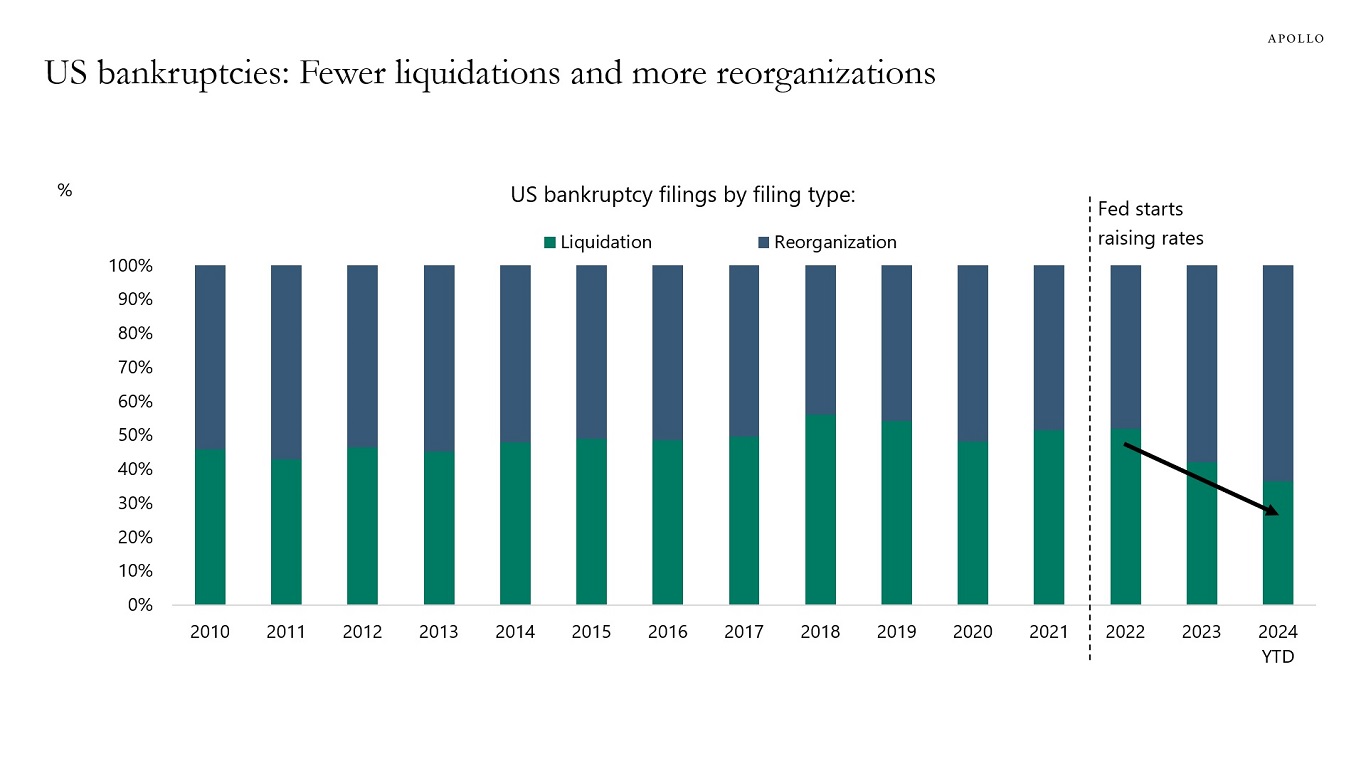
Normally, when a firm goes bankrupt, you imagine a liquidation where all employees are fired and all assets are sold. But this is not what is happening at the moment. A record-high 70% of US bankruptcy filings this year have been reorganizations, see chart below.

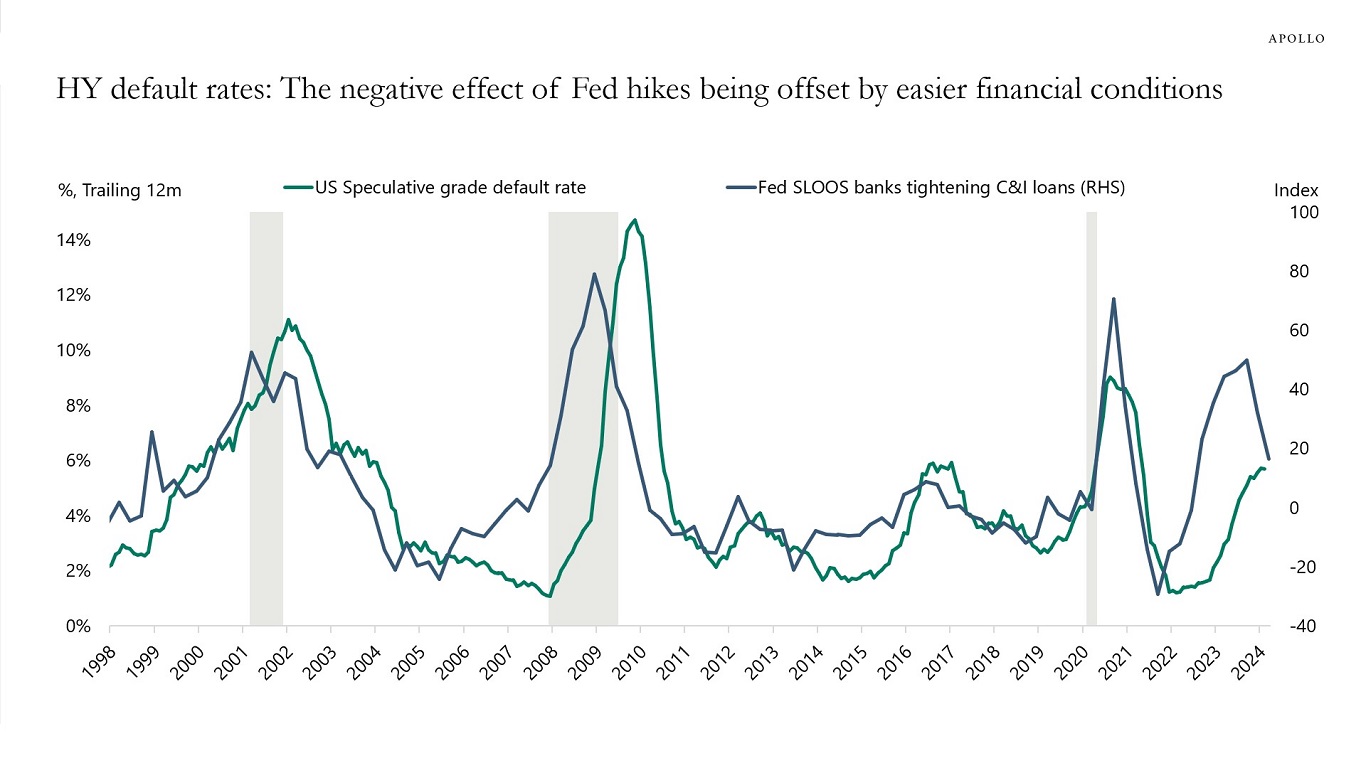
High stock prices and tight credit spreads help companies reorganize instead of liquidating. Combined with the wealth effect of easy financial conditions on consumers, it is harder for the Fed to get inflation under control when financial conditions continue to ease. Put differently, easy financial conditions dampen the traditional transmission mechanism of monetary policy.

US bankruptcies: Fewer liquidations and more reorganizations
Source: S&P Capital IQ, Apollo Chief Economist. Note: Data till March 14, 2024. Bankruptcy figures include public companies or private companies with public debt with a minimum of $2 million in assets or liabilities at the time of filing, in addition to private companies with at least $10 million in assets or liabilities. Chapter 11 liquidation and Chapter 7 bankruptcy filings are categorized as liquidation and other Chapter 11 bankruptcy filings as reorganization.

Download hi-res chart(s)

Recent Posts

  • US Housing Outlook
  • The Fiscal Situation in France and Germany Is Deteriorating
  • More Than Half of Expenditures on Imports From China Stays in the US
  • A 10% Trade War Premium for the Dollar
  • It Takes Time to Rebuild Trust

Recent Comments

No comments to show.

Archives

  • May 2025
  • April 2025
  • March 2025
  • February 2025
  • January 2025
  • December 2024
  • November 2024
  • October 2024
  • September 2024
  • August 2024
  • July 2024
  • June 2024
  • May 2024
  • April 2024
  • March 2024
  • February 2024
  • January 2024
  • December 2023
  • November 2023
  • October 2023
  • September 2023
  • August 2023
  • July 2023
  • June 2023
  • May 2023
  • April 2023
  • March 2023
  • February 2023
  • January 2023
  • December 2022
  • November 2022
  • October 2022
  • September 2022
  • August 2022
  • July 2022
  • June 2022
  • May 2022
  • April 2022
  • March 2022
  • February 2022
  • January 2022
  • December 2021
  • November 2021

Categories

  • Apollo Answers
  • Course Introductions
  • Economic Intelligence
  • Hide from Wordpress Search
  • Investment Knowledge
  • Perspectives
  • Redirecting
  • The Daily Spark
  • The View from Apollo
  • The Weekly Brief
  • Uncategorized
  • White Papers

Outlook for Banks

Since the beginning of the year, the banking sector has been underperforming the S&P 500, and the regional banks have been underperforming the broader banking sector, driven by deteriorating earnings expectations for regional banks, see charts below. Our latest banking sector chart book is available here.

Regional bank stocks underperforming
Source: Bloomberg, Apollo Chief Economist
Earnings expectations falling for regional banks
Source: Bloomberg, Apollo Chief Economist

Download hi-res chart(s)

Recent Posts

  • US Housing Outlook
  • The Fiscal Situation in France and Germany Is Deteriorating
  • More Than Half of Expenditures on Imports From China Stays in the US
  • A 10% Trade War Premium for the Dollar
  • It Takes Time to Rebuild Trust

Recent Comments

No comments to show.

Archives

  • May 2025
  • April 2025
  • March 2025
  • February 2025
  • January 2025
  • December 2024
  • November 2024
  • October 2024
  • September 2024
  • August 2024
  • July 2024
  • June 2024
  • May 2024
  • April 2024
  • March 2024
  • February 2024
  • January 2024
  • December 2023
  • November 2023
  • October 2023
  • September 2023
  • August 2023
  • July 2023
  • June 2023
  • May 2023
  • April 2023
  • March 2023
  • February 2023
  • January 2023
  • December 2022
  • November 2022
  • October 2022
  • September 2022
  • August 2022
  • July 2022
  • June 2022
  • May 2022
  • April 2022
  • March 2022
  • February 2022
  • January 2022
  • December 2021
  • November 2021

Categories

  • Apollo Answers
  • Course Introductions
  • Economic Intelligence
  • Hide from Wordpress Search
  • Investment Knowledge
  • Perspectives
  • Redirecting
  • The Daily Spark
  • The View from Apollo
  • The Weekly Brief
  • Uncategorized
  • White Papers

S&P 500 Market Cap Is Up $10.9 Trillion Since the Fed Pivot

The S&P 500 is up 25% since the November FOMC meeting. That is a $10.9 trillion increase in the market cap of the S&P 500 in five months.

Similarly, with lower rates and tighter credit spreads, the market cap of the US bond market is up $2.6 trillion. That’s a total increase in wealth since the Fed pivot of $13.5 trillion. For comparison, US consumer spending in 2023 was $19 trillion.

Combined with higher home prices and higher bitcoin prices, the bottom line is that the wealth gain experienced for US households since the Fed pivot is at least 70% of consumer spending, and this is going to be a strong tailwind for private consumption over the coming quarters.

Wealth has increased $13.5 trillion since the November FOMC meeting
Source: Bloomberg, Apollo Chief Economist. Note: Indices used are WCAUUS Index and LC07TRUU Index.

Download high-res chart(s)

Recent Posts

  • US Housing Outlook
  • The Fiscal Situation in France and Germany Is Deteriorating
  • More Than Half of Expenditures on Imports From China Stays in the US
  • A 10% Trade War Premium for the Dollar
  • It Takes Time to Rebuild Trust

Recent Comments

No comments to show.

Archives

  • May 2025
  • April 2025
  • March 2025
  • February 2025
  • January 2025
  • December 2024
  • November 2024
  • October 2024
  • September 2024
  • August 2024
  • July 2024
  • June 2024
  • May 2024
  • April 2024
  • March 2024
  • February 2024
  • January 2024
  • December 2023
  • November 2023
  • October 2023
  • September 2023
  • August 2023
  • July 2023
  • June 2023
  • May 2023
  • April 2023
  • March 2023
  • February 2023
  • January 2023
  • December 2022
  • November 2022
  • October 2022
  • September 2022
  • August 2022
  • July 2022
  • June 2022
  • May 2022
  • April 2022
  • March 2022
  • February 2022
  • January 2022
  • December 2021
  • November 2021

Categories

  • Apollo Answers
  • Course Introductions
  • Economic Intelligence
  • Hide from Wordpress Search
  • Investment Knowledge
  • Perspectives
  • Redirecting
  • The Daily Spark
  • The View from Apollo
  • The Weekly Brief
  • Uncategorized
  • White Papers

HY Default Rates and Financial Conditions

Higher costs of capital have pushed up default rates in high yield corporate credit since the Fed started raising rates in March 2022.

But since the Fed turned dovish five months ago, credit spreads have tightened and stock prices have rallied, which has reopened capital markets with more M&A activity and IPO activity.

As a result, the high yield default rate is now beginning to flatten out, see chart below.

In short, the negative effect of Fed hikes is being offset by the Fed pivot and the associated easing in financial conditions.

HY default rates: The negative effect of Fed hikes being offset by easier financial conditions
Source: FRB, Moody’s Analytics, Haver Analytics, Apollo Chief Economist

Download high-res chart(s)

Recent Posts

  • US Housing Outlook
  • The Fiscal Situation in France and Germany Is Deteriorating
  • More Than Half of Expenditures on Imports From China Stays in the US
  • A 10% Trade War Premium for the Dollar
  • It Takes Time to Rebuild Trust

Recent Comments

No comments to show.

Archives

  • May 2025
  • April 2025
  • March 2025
  • February 2025
  • January 2025
  • December 2024
  • November 2024
  • October 2024
  • September 2024
  • August 2024
  • July 2024
  • June 2024
  • May 2024
  • April 2024
  • March 2024
  • February 2024
  • January 2024
  • December 2023
  • November 2023
  • October 2023
  • September 2023
  • August 2023
  • July 2023
  • June 2023
  • May 2023
  • April 2023
  • March 2023
  • February 2023
  • January 2023
  • December 2022
  • November 2022
  • October 2022
  • September 2022
  • August 2022
  • July 2022
  • June 2022
  • May 2022
  • April 2022
  • March 2022
  • February 2022
  • January 2022
  • December 2021
  • November 2021

Categories

  • Apollo Answers
  • Course Introductions
  • Economic Intelligence
  • Hide from Wordpress Search
  • Investment Knowledge
  • Perspectives
  • Redirecting
  • The Daily Spark
  • The View from Apollo
  • The Weekly Brief
  • Uncategorized
  • White Papers

Mind the (Funding) Gap: Finding Opportunities in Real Estate Debt Amid Dislocation

Higher interest rates have pressured real estate prices, but fundamentals remain stable across most property types. In this white paper and on-demand class, we examine the state of the real estate market and discuss the opportunity in RE debt in light of wider spreads, more lender-friendly terms, and significant refinancing needs.

DOWNLOAD THE PAPER
WATCH THE CLASS
LISTEN TO THE PODCAST

Key Takeaways

  • Higher interest rates have pressured real estate prices, but fundamentals remain stable for most property types. Coupled with rising base rates and spreads, lower lender leverage, and heightened ability to drive terms in a constrained funding market, we believe that real estate debt presents an attractive opportunity in the current market environment. And we see this potential opportunity augmented by significant amounts of maturing loans and funding gaps.   
  • Specifically, certain challenged office is indeed a part of CRE that is in distress due to structural changes in the way office space is used following the Covid-19 pandemic. But, apart from office, sectors such as industrial, multifamily, and others are showing resilient fundamentals. Additionally, secular trends continue to carry on for some traditional and specialized sectors. In other words, it is key, in our view, to not equate CRE as a whole to what’s happening specifically in the office space.
  • CRE is a highly diverse asset class, comprised of other traditional sectors such as multifamily, industrial, retail, and hotels. It also includes sub-sectors (e.g., student housing, cold storage, self storage, and data centers) that arise from traditional sectors due to changes in needs, advances in technology, changing consumer behavior, and other trends. Each type of property has its own use cases, characteristics, trends, and demand drivers that can offer opportunities for growth.
  • There is a large need for capital on the horizon as significant amounts of real estate loans are expected to mature over the next few years. And funding gaps from declining property values and stricter loan standards need to be closed, offering another area to provide capital. We believe that real estate debt presents an attractive opportunity in the current market environment due to the potential for higher yields and lower leverage levels on reset valuations, providing more protective loan structures. We see the opportunity to originate real estate debt attractive in both the US and Europe.
  • The opportunity is augmented for private capital providers, given some traditional funding sources—such as banks and the securitization market—have retrenched, leaving a void for other lenders to fill.
DOWNLOAD THE PAPER
WATCH THE CLASS
LISTEN TO THE PODCAST

The information herein is provided for educational purposes only and should not be construed as financial or investment advice, nor should any information in this document be relied on when making an investment decision. Opinions and views expressed reflect the current opinions and views of the authors and Apollo Analysts as of the date hereof and are subject to change. Please see the end of this document for important disclosure information.


Important Disclosure Information

This presentation is for educational purposes only and should not be treated as research. This presentation may not be distributed, transmitted or otherwise communicated to others, in whole or in part, without the express written consent of Apollo Global Management, Inc. (together with its subsidiaries, “Apollo”).

The views and opinions expressed in this presentation are the views and opinions of the author(s) of the White Paper. They do not necessarily reflect the views and opinions of Apollo and are subject to change at any time without notice. Further, Apollo and its affiliates may have positions (long or short) or engage in securities transactions that are not consistent with the information and views expressed in this presentation. There can be no assurance that an investment strategy will be successful. Historic market trends are not reliable indicators of actual future market behavior or future performance of any particular investment which may differ materially, and should not be relied upon as such. Target allocations contained herein are subject to change. There is no assurance that the target allocations will be achieved, and actual allocations may be significantly different than that shown here. This presentation does not constitute an offer of any service or product of Apollo. It is not an invitation by or on behalf of Apollo to any person to buy or sell any security or to adopt any investment strategy, and shall not form the basis of, nor may it accompany nor form part of, any right or contract to buy or sell any security or to adopt any investment strategy. Nothing herein should be taken as investment advice or a recommendation to enter into any transaction.

Hyperlinks to third-party websites in this presentation are provided for reader convenience only. There can be no assurance that any trends discussed herein will continue. Unless otherwise noted, information included herein is presented as of the dates indicated. This presentation is not complete and the information contained herein may change at any time without notice. Apollo does not have any responsibility to update the presentation to account for such changes. Apollo has not made any representation or warranty, expressed or implied, with respect to fairness, correctness, accuracy, reasonableness, or completeness of any of the information contained herein, and expressly disclaims any responsibility or liability therefore. The information contained herein is not intended to provide, and should not be relied upon for, accounting, legal or tax advice or investment recommendations. Investors should make an independent investigation of the information contained herein, including consulting their tax, legal, accounting or other advisors about such information. Apollo does not act for you and is not responsible for providing you with the protections afforded to its clients.

Certain information contained herein may be “forward-looking” in nature. Due to various risks and uncertainties, actual events or results may differ materially from those reflected or contemplated in such forward-looking information. As such, undue reliance should not be placed on such information. Forward-looking statements may be identified by the use of terminology including, but not limited to, “may”, “will”, “should”, “expect”, “anticipate”, “target”, “project”, “estimate”, “intend”, “continue” or “believe” or the negatives thereof or other variations thereon or comparable terminology.

The Standard & Poor’s 500 (“S&P 500”) Index is a market-capitalization-weighted index of the 500 largest U.S. publicly traded companies by market value.

Additional information may be available upon request.

Recent Posts

  • US Housing Outlook
  • The Fiscal Situation in France and Germany Is Deteriorating
  • More Than Half of Expenditures on Imports From China Stays in the US
  • A 10% Trade War Premium for the Dollar
  • It Takes Time to Rebuild Trust

Recent Comments

No comments to show.

Archives

  • May 2025
  • April 2025
  • March 2025
  • February 2025
  • January 2025
  • December 2024
  • November 2024
  • October 2024
  • September 2024
  • August 2024
  • July 2024
  • June 2024
  • May 2024
  • April 2024
  • March 2024
  • February 2024
  • January 2024
  • December 2023
  • November 2023
  • October 2023
  • September 2023
  • August 2023
  • July 2023
  • June 2023
  • May 2023
  • April 2023
  • March 2023
  • February 2023
  • January 2023
  • December 2022
  • November 2022
  • October 2022
  • September 2022
  • August 2022
  • July 2022
  • June 2022
  • May 2022
  • April 2022
  • March 2022
  • February 2022
  • January 2022
  • December 2021
  • November 2021

Categories

  • Apollo Answers
  • Course Introductions
  • Economic Intelligence
  • Hide from Wordpress Search
  • Investment Knowledge
  • Perspectives
  • Redirecting
  • The Daily Spark
  • The View from Apollo
  • The Weekly Brief
  • Uncategorized
  • White Papers

Strong Tailwind to Stocks and Credit

One way to measure liquidity is to add bank reserves and money market assets, see chart below which shows that there is record-high liquidity to push stock prices higher and credit spreads tighter. In particular, once the Fed starts lowering interest rates, some of the $6 trillion in money market funds is likely to find its way into stocks and credit.

Record-high liquidity to support equity and credit markets
Source: ICI, FRB, Haver Analytics, Apollo Chief Economist

Download high-res chart(s)

Recent Posts

  • US Housing Outlook
  • The Fiscal Situation in France and Germany Is Deteriorating
  • More Than Half of Expenditures on Imports From China Stays in the US
  • A 10% Trade War Premium for the Dollar
  • It Takes Time to Rebuild Trust

Recent Comments

No comments to show.

Archives

  • May 2025
  • April 2025
  • March 2025
  • February 2025
  • January 2025
  • December 2024
  • November 2024
  • October 2024
  • September 2024
  • August 2024
  • July 2024
  • June 2024
  • May 2024
  • April 2024
  • March 2024
  • February 2024
  • January 2024
  • December 2023
  • November 2023
  • October 2023
  • September 2023
  • August 2023
  • July 2023
  • June 2023
  • May 2023
  • April 2023
  • March 2023
  • February 2023
  • January 2023
  • December 2022
  • November 2022
  • October 2022
  • September 2022
  • August 2022
  • July 2022
  • June 2022
  • May 2022
  • April 2022
  • March 2022
  • February 2022
  • January 2022
  • December 2021
  • November 2021

Categories

  • Apollo Answers
  • Course Introductions
  • Economic Intelligence
  • Hide from Wordpress Search
  • Investment Knowledge
  • Perspectives
  • Redirecting
  • The Daily Spark
  • The View from Apollo
  • The Weekly Brief
  • Uncategorized
  • White Papers

Incoming Data Suggests Monetary Policy Is Not Restrictive

The best guide to whether monetary policy is restrictive is not r-star but the incoming data. The incoming data shows that after the Fed turned dovish and the stock market rallied, we have in January and February seen strong employment growth, low jobless claims, and upward pressure on CPI and PPI inflation.

Maybe the lagged effects of Fed hikes work after 12 to 18 months through income in the consumption function. However, the effects of easy financial conditions on consumer spending are immediate. Given that financial conditions have eased significantly over the past five months, with record-high stock prices, tight credit spreads, and rising home prices, it is not surprising that the incoming economic data is strong.

The bottom line is that the last mile is harder because of the immediate positive impact on the economy of record-high stock prices. In contrast, the long and variable lags work mainly through a rising unemployment rate.

In short, the long and variable lags of monetary policy have been overwhelmed by the 25% increase in the S&P 500 since November.

Fed model estimate of r-star
Source: FRBNY, Haver Analytics, Apollo Chief Economist

Download high-res chart(s)

Recent Posts

  • US Housing Outlook
  • The Fiscal Situation in France and Germany Is Deteriorating
  • More Than Half of Expenditures on Imports From China Stays in the US
  • A 10% Trade War Premium for the Dollar
  • It Takes Time to Rebuild Trust

Recent Comments

No comments to show.

Archives

  • May 2025
  • April 2025
  • March 2025
  • February 2025
  • January 2025
  • December 2024
  • November 2024
  • October 2024
  • September 2024
  • August 2024
  • July 2024
  • June 2024
  • May 2024
  • April 2024
  • March 2024
  • February 2024
  • January 2024
  • December 2023
  • November 2023
  • October 2023
  • September 2023
  • August 2023
  • July 2023
  • June 2023
  • May 2023
  • April 2023
  • March 2023
  • February 2023
  • January 2023
  • December 2022
  • November 2022
  • October 2022
  • September 2022
  • August 2022
  • July 2022
  • June 2022
  • May 2022
  • April 2022
  • March 2022
  • February 2022
  • January 2022
  • December 2021
  • November 2021

Categories

  • Apollo Answers
  • Course Introductions
  • Economic Intelligence
  • Hide from Wordpress Search
  • Investment Knowledge
  • Perspectives
  • Redirecting
  • The Daily Spark
  • The View from Apollo
  • The Weekly Brief
  • Uncategorized
  • White Papers

Trend Wage Inflation Is 5%

The New York Fed has constructed a new measure of trend wage inflation, which currently is running at 5%, see chart below and here.

Wage inflation at 5% is not consistent with the Fed’s 2% inflation target. The Fed will keep interest rates higher for longer.

This is not surprising given the ongoing reacceleration in both nonfarm payrolls and CPI and PPI inflation, likely driven by the significant easing of financial conditions since the December 13 FOMC meeting and Chris Waller’s hawkish-to-dovish speech in November.

Trend wage inflation is sticky around 5%
Source: Federal Reserve Bank of New York, Apollo Chief Economist

Download high-res chart(s)

Recent Posts

  • US Housing Outlook
  • The Fiscal Situation in France and Germany Is Deteriorating
  • More Than Half of Expenditures on Imports From China Stays in the US
  • A 10% Trade War Premium for the Dollar
  • It Takes Time to Rebuild Trust

Recent Comments

No comments to show.

Archives

  • May 2025
  • April 2025
  • March 2025
  • February 2025
  • January 2025
  • December 2024
  • November 2024
  • October 2024
  • September 2024
  • August 2024
  • July 2024
  • June 2024
  • May 2024
  • April 2024
  • March 2024
  • February 2024
  • January 2024
  • December 2023
  • November 2023
  • October 2023
  • September 2023
  • August 2023
  • July 2023
  • June 2023
  • May 2023
  • April 2023
  • March 2023
  • February 2023
  • January 2023
  • December 2022
  • November 2022
  • October 2022
  • September 2022
  • August 2022
  • July 2022
  • June 2022
  • May 2022
  • April 2022
  • March 2022
  • February 2022
  • January 2022
  • December 2021
  • November 2021

Categories

  • Apollo Answers
  • Course Introductions
  • Economic Intelligence
  • Hide from Wordpress Search
  • Investment Knowledge
  • Perspectives
  • Redirecting
  • The Daily Spark
  • The View from Apollo
  • The Weekly Brief
  • Uncategorized
  • White Papers

Liquidity in Public and Private Credit Converging

The total amount of corporate bonds outstanding is now over $10 trillion, and the primary dealer inventory of corporate bonds is $33 billion, see chart below.

This is not a liquid market. When credit markets are quiet and calm, it gives the impression that liquidity is fine, but if many holders of credit suddenly want to sell, liquidity will disappear. Even in quiet markets, finding a bond can take several days.

With more evergreen funds with monthly and quarterly liquidity in private credit, the reality is that the liquidity situation in public and private credit is converging, and in some cases, if you want to buy or sell a big amount of public credit without moving the price, private credit may be more liquid.

Liquidity is very thin in corporate bond markets
Source: FRBNY, Haver Analytics, ICE BofA, Bloomberg, Apollo Chief Economist

Download high-res chart(s)

Recent Posts

  • US Housing Outlook
  • The Fiscal Situation in France and Germany Is Deteriorating
  • More Than Half of Expenditures on Imports From China Stays in the US
  • A 10% Trade War Premium for the Dollar
  • It Takes Time to Rebuild Trust

Recent Comments

No comments to show.

Archives

  • May 2025
  • April 2025
  • March 2025
  • February 2025
  • January 2025
  • December 2024
  • November 2024
  • October 2024
  • September 2024
  • August 2024
  • July 2024
  • June 2024
  • May 2024
  • April 2024
  • March 2024
  • February 2024
  • January 2024
  • December 2023
  • November 2023
  • October 2023
  • September 2023
  • August 2023
  • July 2023
  • June 2023
  • May 2023
  • April 2023
  • March 2023
  • February 2023
  • January 2023
  • December 2022
  • November 2022
  • October 2022
  • September 2022
  • August 2022
  • July 2022
  • June 2022
  • May 2022
  • April 2022
  • March 2022
  • February 2022
  • January 2022
  • December 2021
  • November 2021

Categories

  • Apollo Answers
  • Course Introductions
  • Economic Intelligence
  • Hide from Wordpress Search
  • Investment Knowledge
  • Perspectives
  • Redirecting
  • The Daily Spark
  • The View from Apollo
  • The Weekly Brief
  • Uncategorized
  • White Papers

Strong Demand for $100 Bills

When the Fed lowered interest rates to zero in 2008, demand for $100 bills started growing faster than demand for $1 bills, and there are now more $100 bills than $1 bills in circulation, see chart below.

There are more $100 bills in circulation than $1 bills
Source: Federal Reserve Board, Apollo Chief Economist

Download hi-res chart(s)

Recent Posts

  • US Housing Outlook
  • The Fiscal Situation in France and Germany Is Deteriorating
  • More Than Half of Expenditures on Imports From China Stays in the US
  • A 10% Trade War Premium for the Dollar
  • It Takes Time to Rebuild Trust

Recent Comments

No comments to show.

Archives

  • May 2025
  • April 2025
  • March 2025
  • February 2025
  • January 2025
  • December 2024
  • November 2024
  • October 2024
  • September 2024
  • August 2024
  • July 2024
  • June 2024
  • May 2024
  • April 2024
  • March 2024
  • February 2024
  • January 2024
  • December 2023
  • November 2023
  • October 2023
  • September 2023
  • August 2023
  • July 2023
  • June 2023
  • May 2023
  • April 2023
  • March 2023
  • February 2023
  • January 2023
  • December 2022
  • November 2022
  • October 2022
  • September 2022
  • August 2022
  • July 2022
  • June 2022
  • May 2022
  • April 2022
  • March 2022
  • February 2022
  • January 2022
  • December 2021
  • November 2021

Categories

  • Apollo Answers
  • Course Introductions
  • Economic Intelligence
  • Hide from Wordpress Search
  • Investment Knowledge
  • Perspectives
  • Redirecting
  • The Daily Spark
  • The View from Apollo
  • The Weekly Brief
  • Uncategorized
  • White Papers

Posts navigation

Page 1 Page 2 … Page 4 Next page→
  • Privacy Notice
  • Terms of Use
  • Forward-Looking Statements
Apollo
© Apollo Global Management, Inc. All Rights Reserved.

The Apollo Academy is for informational and educational purposes only and nothing contained herein should be taken as investment advice or a recommendation to enter into any transaction. They are not an invitation by or on behalf of Apollo to any person to buy or sell any security or to adopt any investment strategy, and shall not form the basis of, nor may it accompany nor form part of, any right or contract to buy or sell any security or to adopt any investment strategy. There is no guarantee that the views and opinions expressed in this website will come to pass. For additional information, please see the disclaimers included in each piece of content or the legal page of our website here.