• Apollo.com
  • Login
  • Register Now
light site-logo
  • The Academy
  • Upcoming Events
        • Upcoming Events

  • Learning Center
        • New & UpdatedAlternative Investing Course 2.0

        • Alternative Investing Essentials Part OnePrivate Equity, Venture Capital, Private Credit
        • Alternative Investing Essentials Part TwoReal Estate, Infrastructure, Digital Assets, Hedge Funds
        • Practical ConsiderationsAsset Allocation, Risk Considerations, Fund Structures, Fees
        • Introductory Videos

          View All Videos

        •  Recent Classes & Videos

        • • Mid-Year Outlook: At the Crossroads of Stagflation — What’s Next?
        • • Hybrid Investments: Flexible Structures for Volatile Times
        • • Private Credit Investing in Volatile Times
        • • Potential Implications of the Latest US Administration Policy Proposals
        • • Beyond 60/40: Private Assets in an Era of High Public Valuations
        • • Investment Grade Private Credit as a Core Fixed Income Allocation
        • View All Classes

  • Alternative Perspectives
        • Investment Knowledge
        • The View from Apollo
          • Investment Knowledge White Papers

            Mid-Year Outlook: At the Crossroads of Stagflation—What’s Next?

            June 23, 2025
          • The View From Apollo

            Another Chance to Position Portfolios for Tariff Turmoil?

            July 17, 2025
          • Investment Knowledge White Papers

            The Continental Shift: Europe’s Private Credit Moment

            June 20, 2025
  • The Daily Spark
        • Read The Daily Spark Blog


        • Want it delivered daily to your inbox?
          • The Daily Spark

            90% of US Power Capacity Installations Are Renewables

            July 19, 2025
          • The Daily Spark

            Comparing Wage Growth for Job Stayers and Job Switchers

            July 18, 2025
          • The Daily Spark

            Different Retirement Systems in Europe

            July 17, 2025
  • Register for Apollo Academy: Alternative Investing Course
  • Login
  • About Apollo Academy
  • Upcoming Events
  • Learning Center
  • Alternative Perspectives
  • The Daily Spark
  • Register for Apollo Academy: Alternative Investing Course
  • Login
  • Alternative Investing Course 2.0
  • Mid-Year Outlook: At the Crossroads of Stagflation — What’s Next?
  • Hybrid Investments: Flexible Structures for Volatile Times
  • Private Credit Investing in Volatile Times
  • Potential Implications of the Latest US Administration Policy Proposals
  • Beyond 60/40: Private Assets in an Era of High Public Valuations
  • Investment Grade Private Credit as a Core Fixed Income Allocation
  • View All Classes
  • Introductory Videos
  • Alternative Investing Essentials Part One • Now Available On Demand
  • Alternative Investing Essentials Part Two • Now Available On Demand
  • Practical Considerations • Now Available On Demand
  • Investment Knowledge
  • The View from Apollo
Home January 2025

The US Economy Is Strong

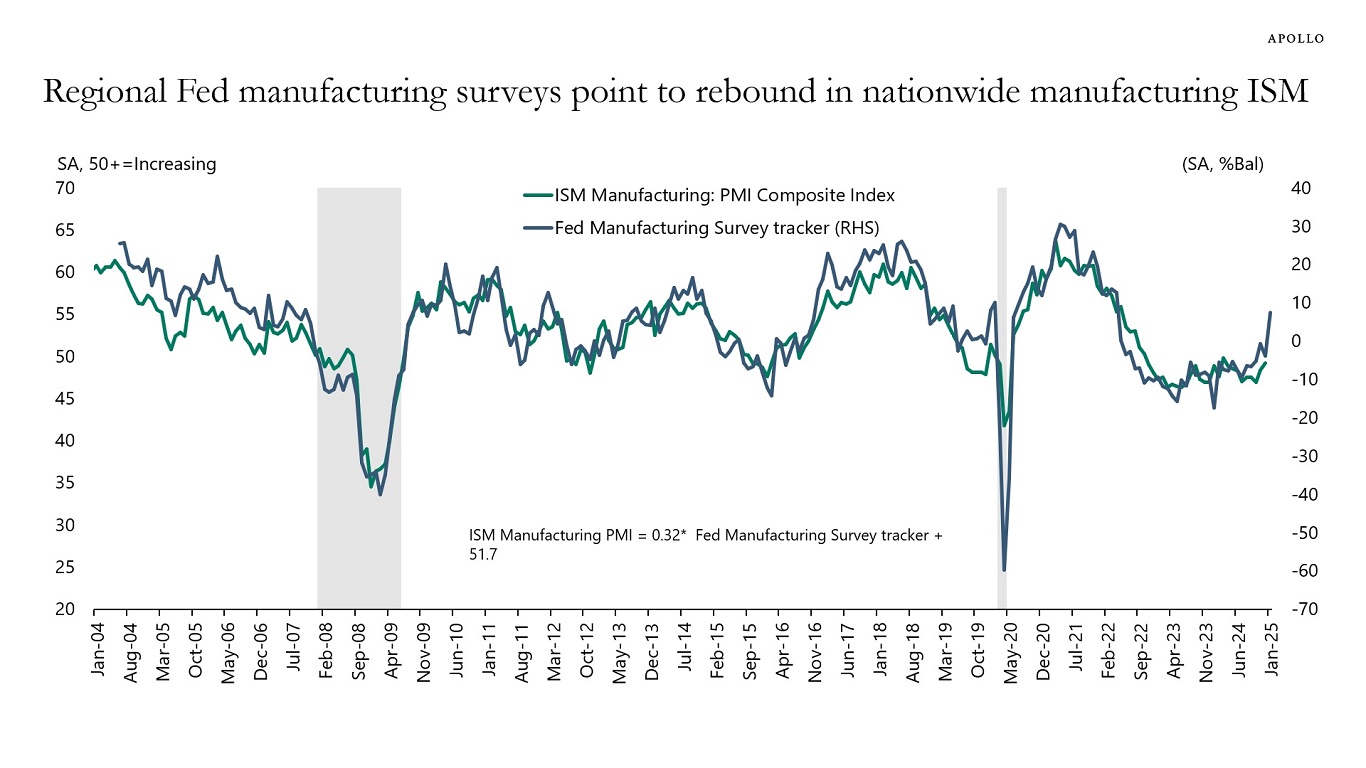
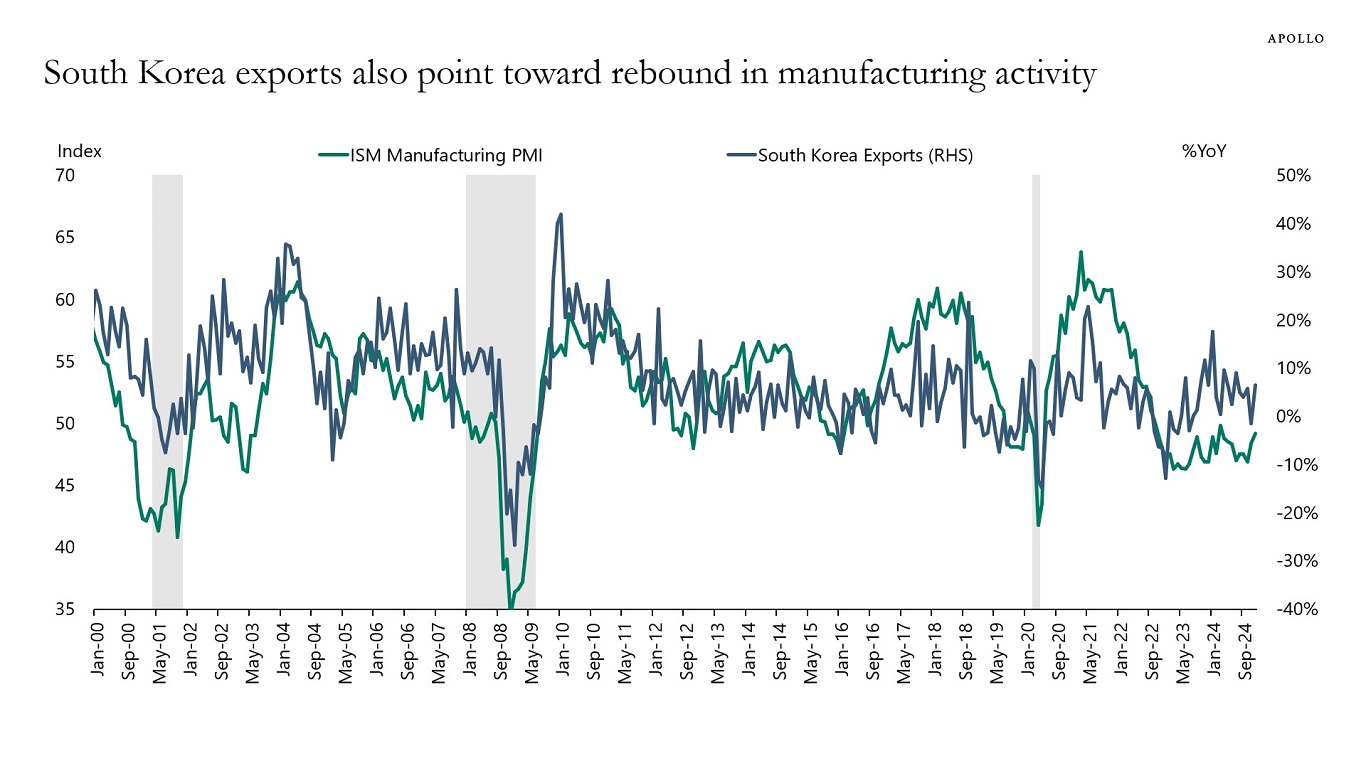
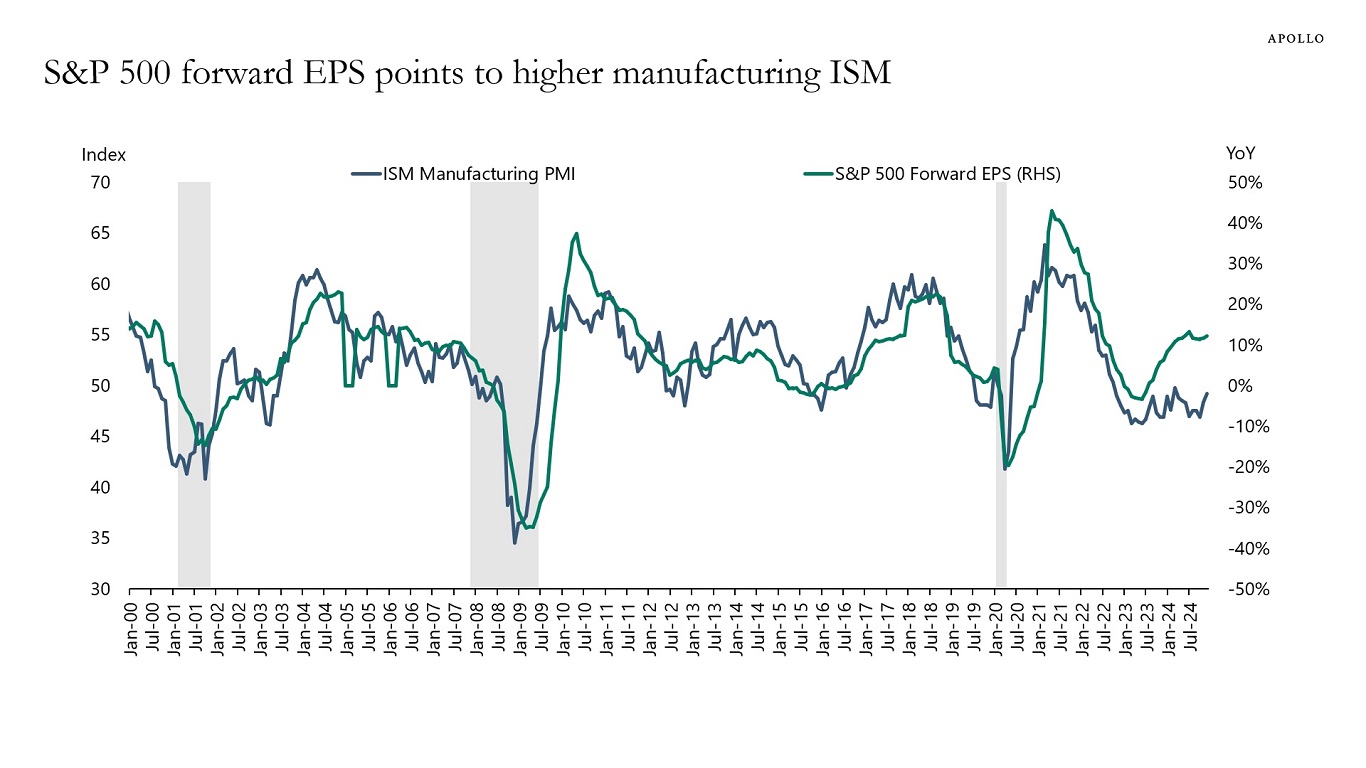
On Monday, we will get manufacturing ISM for January, and it is likely to show a big jump higher, see charts below. Based on the historical relationship with the regional Fed ISM indicators, the nationwide ISM could increase to 54, a level which would be consistent with first-quarter GDP growth of 3.4%.

The strong momentum in the economy is driven by high stock prices, high home prices, and strong tailwinds to growth from tech capex spending, defense spending, and spending driven by the CHIPS Act, the IRA, and the Infrastructure Act.

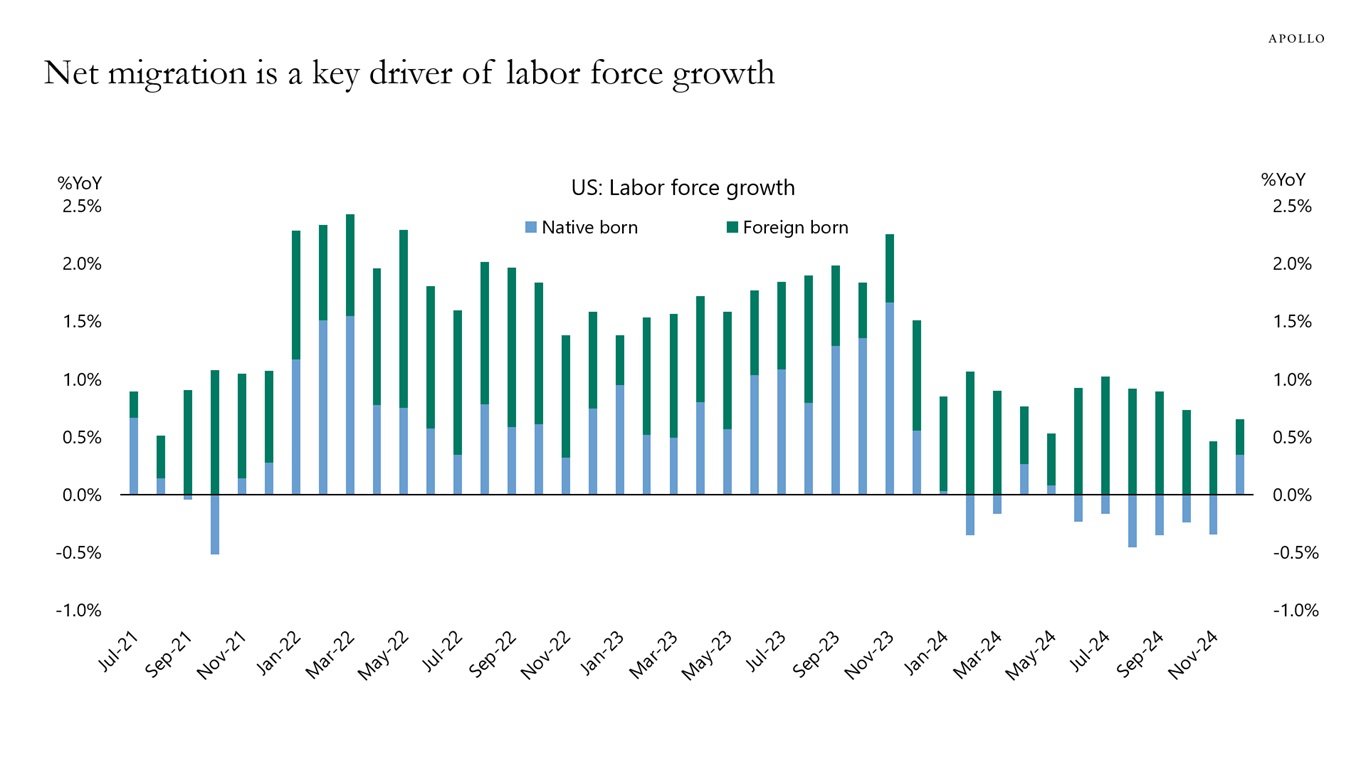
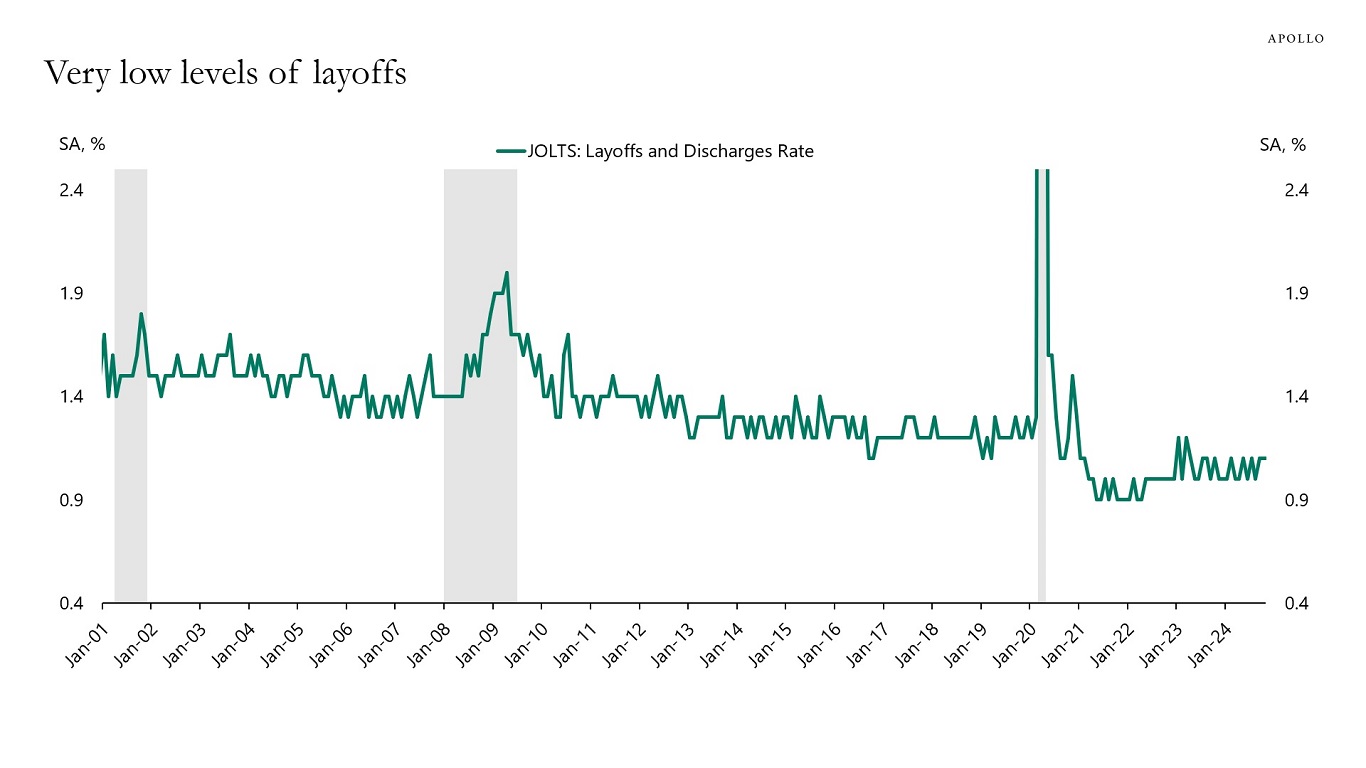
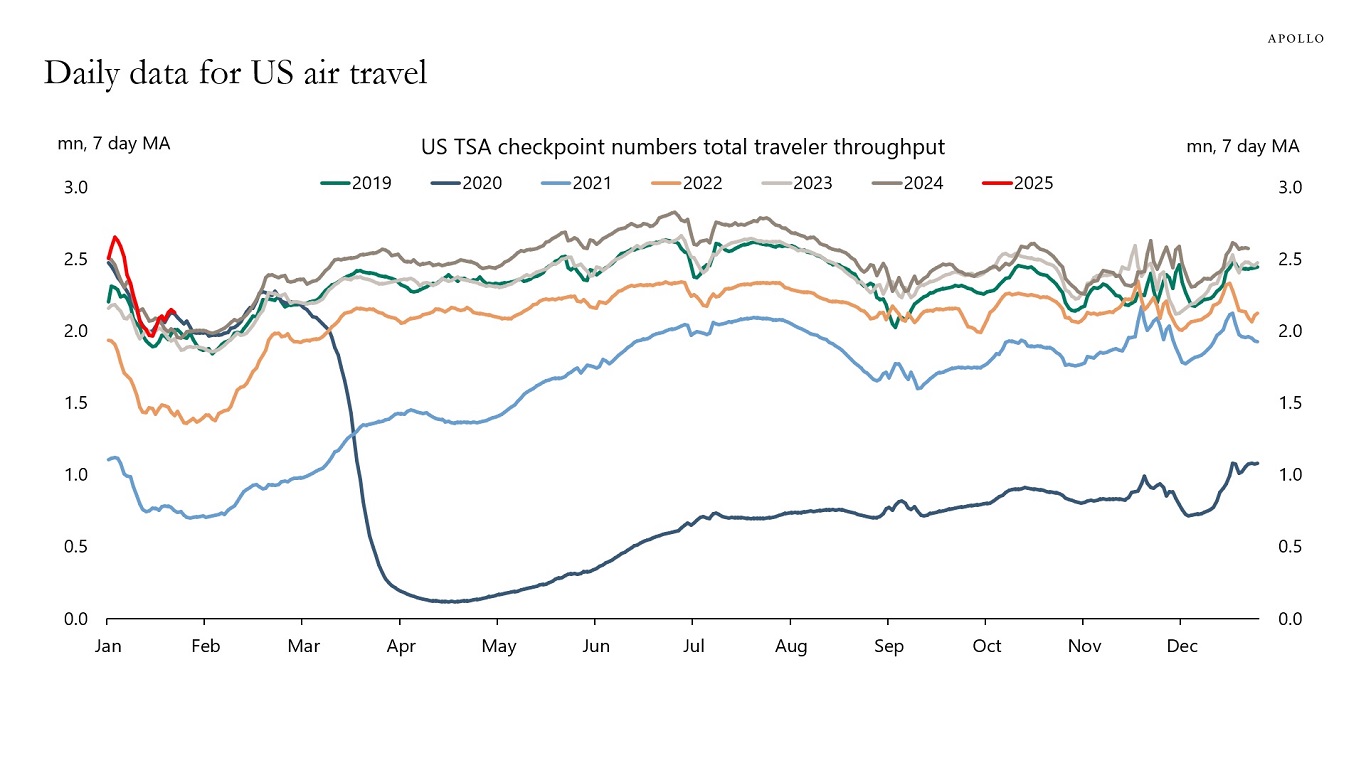
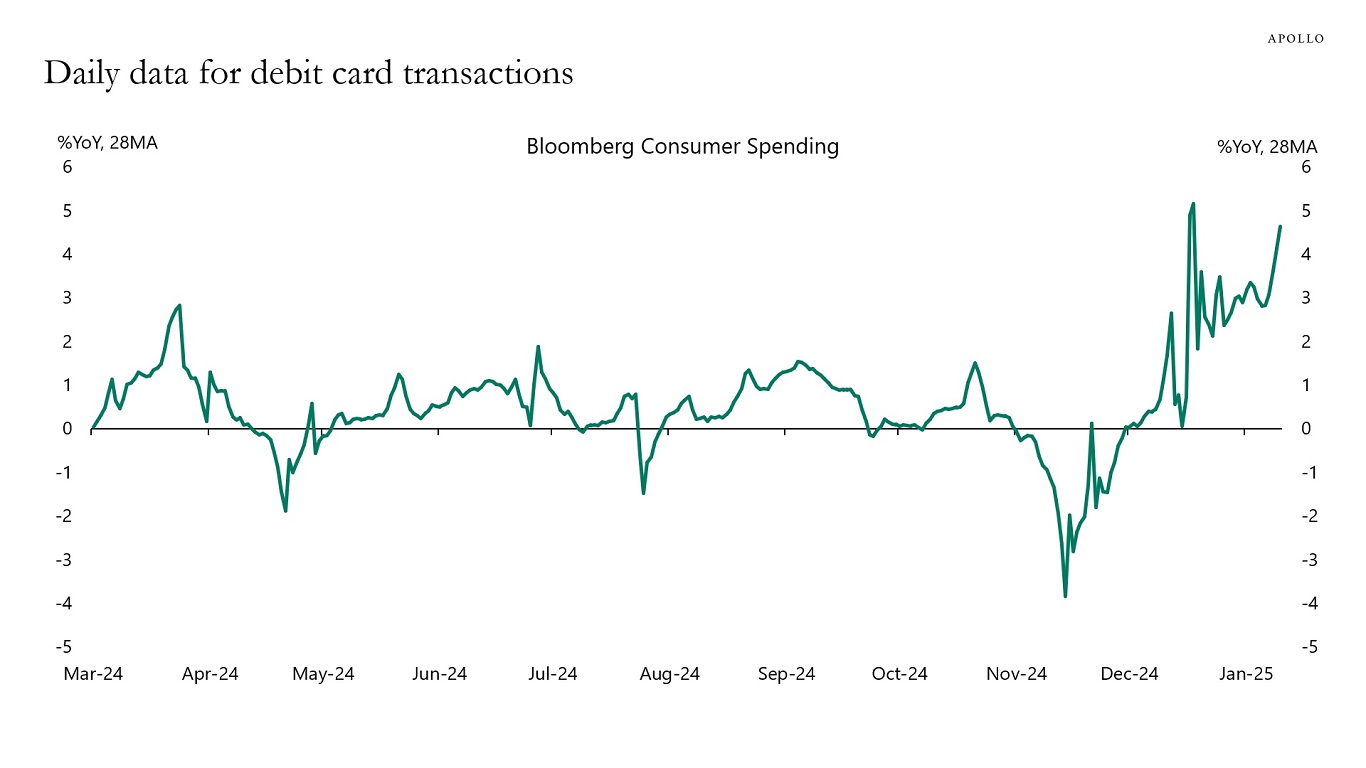
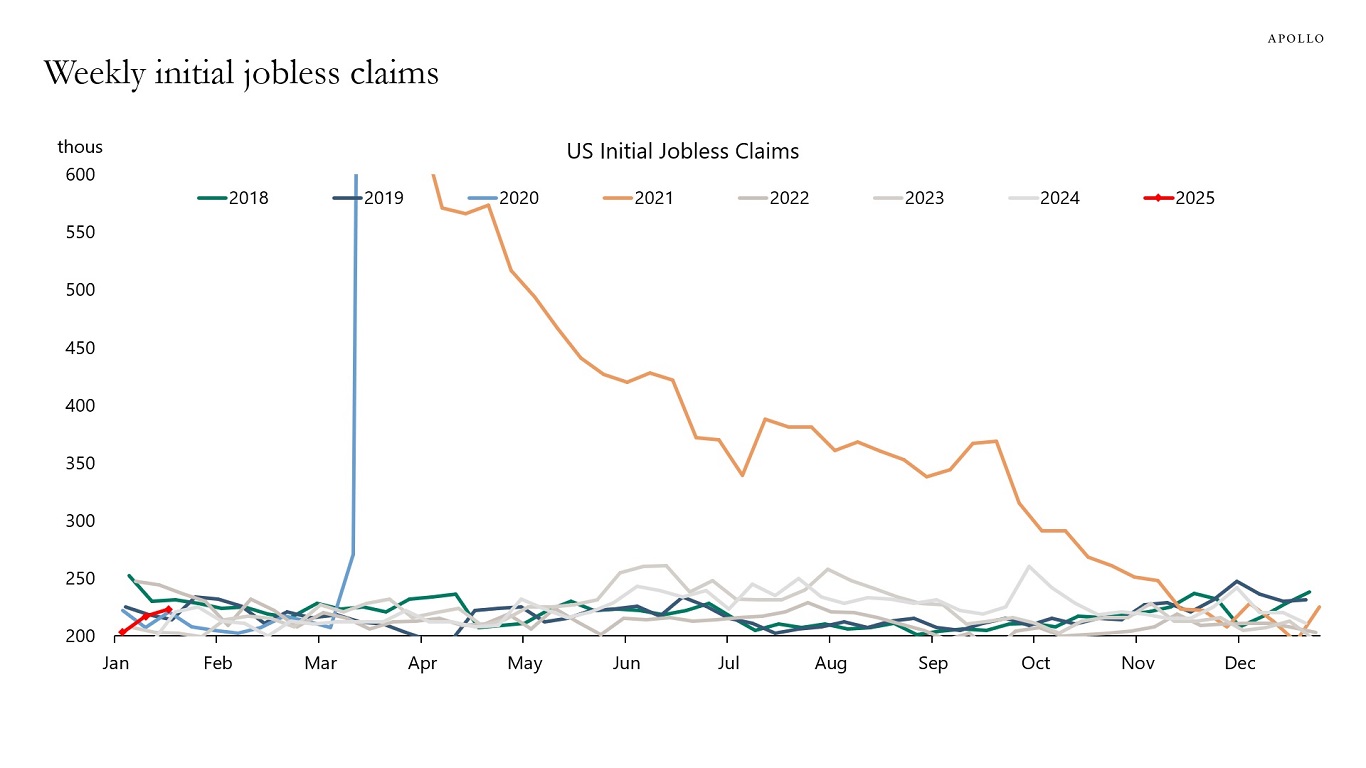
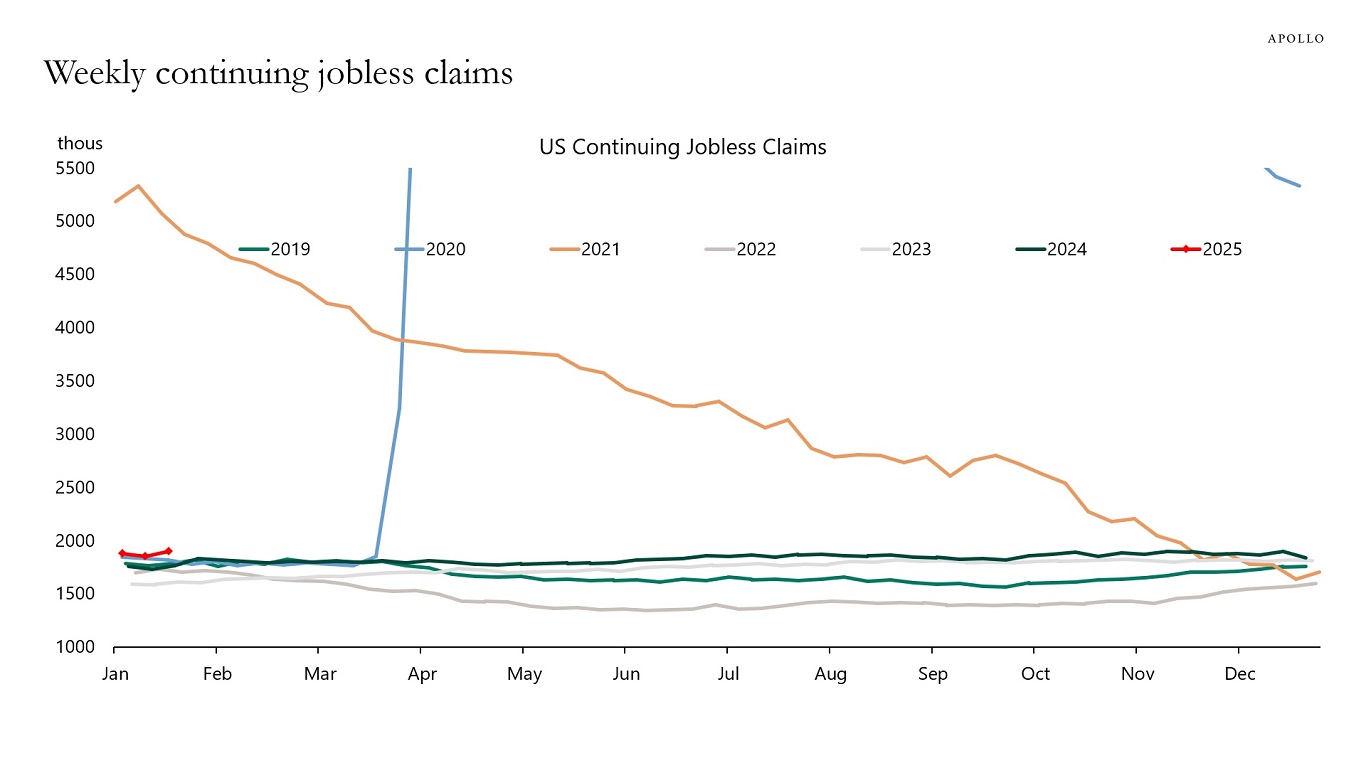
Combined with low jobless claims and higher animal spirits since the election, the bottom line is that the US economy is entering 2025 with accelerating momentum.

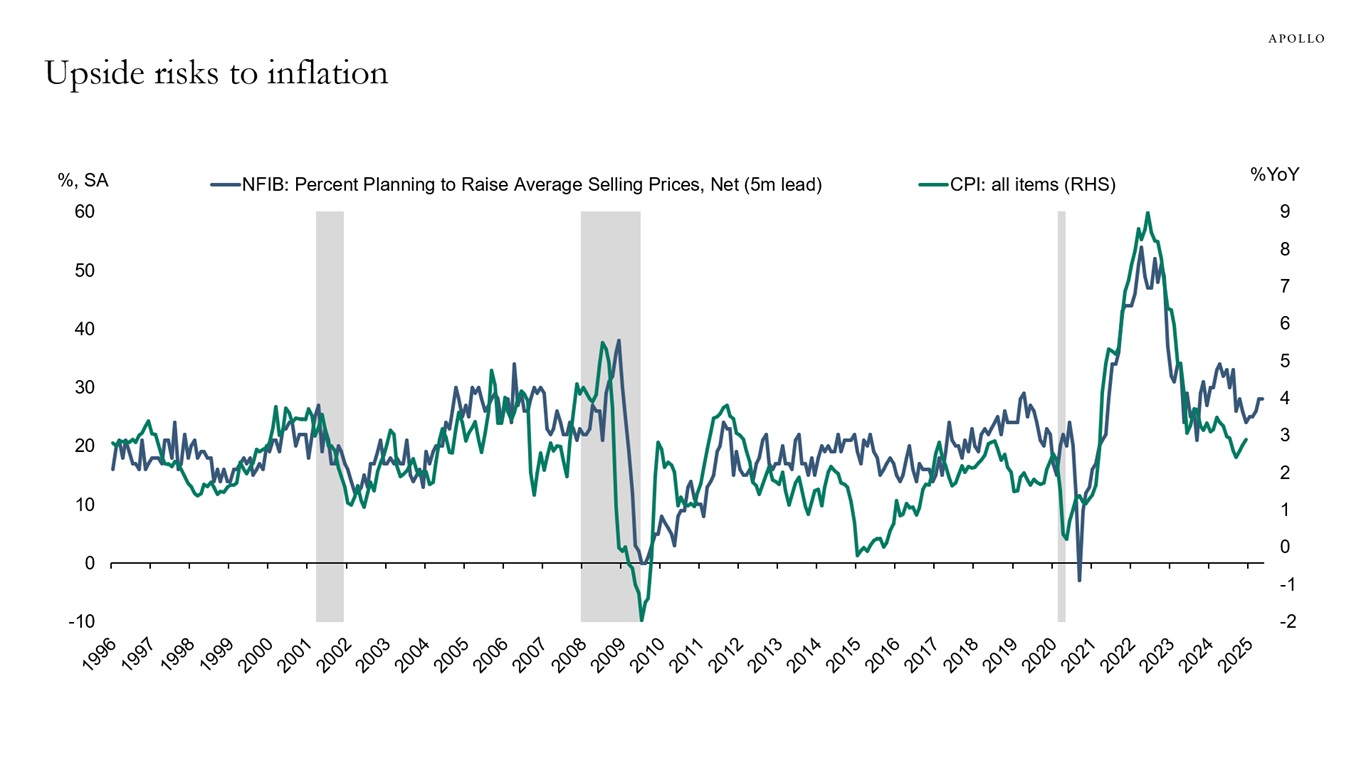
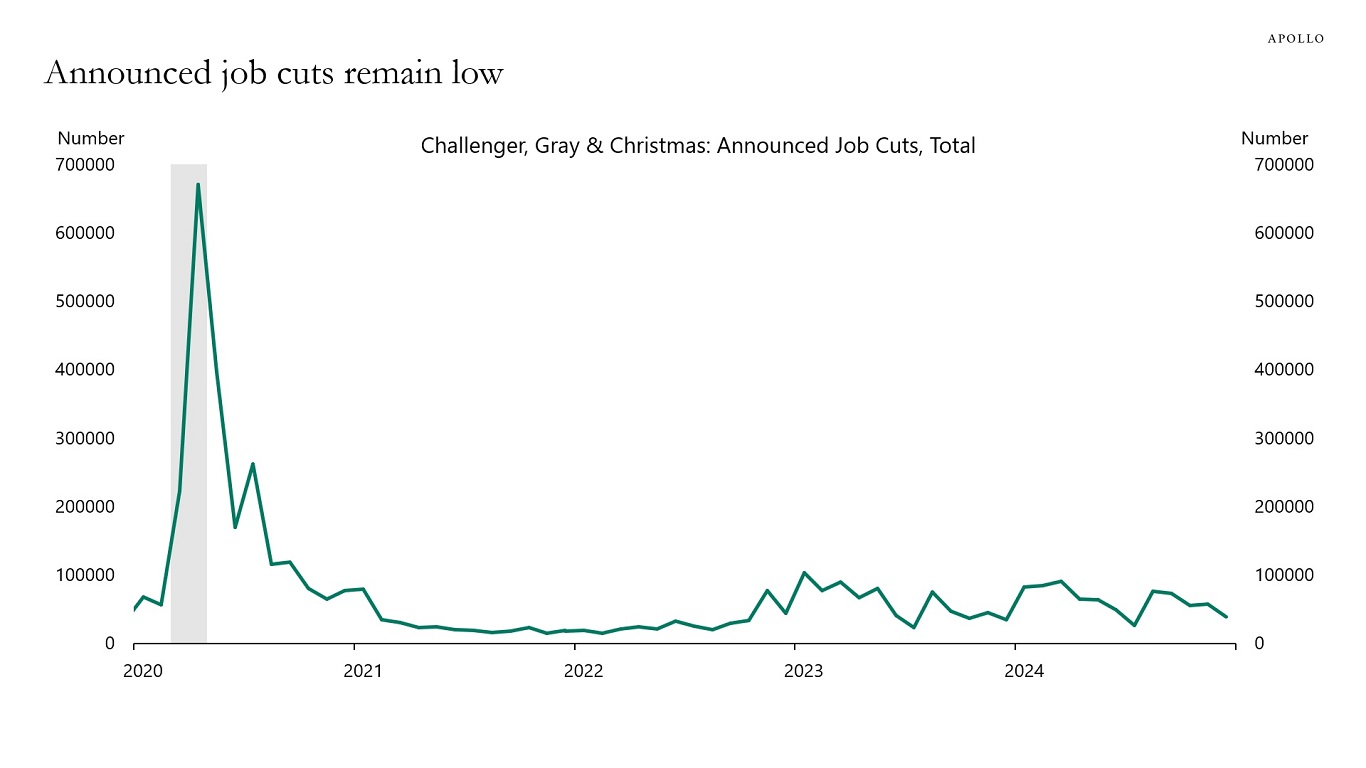
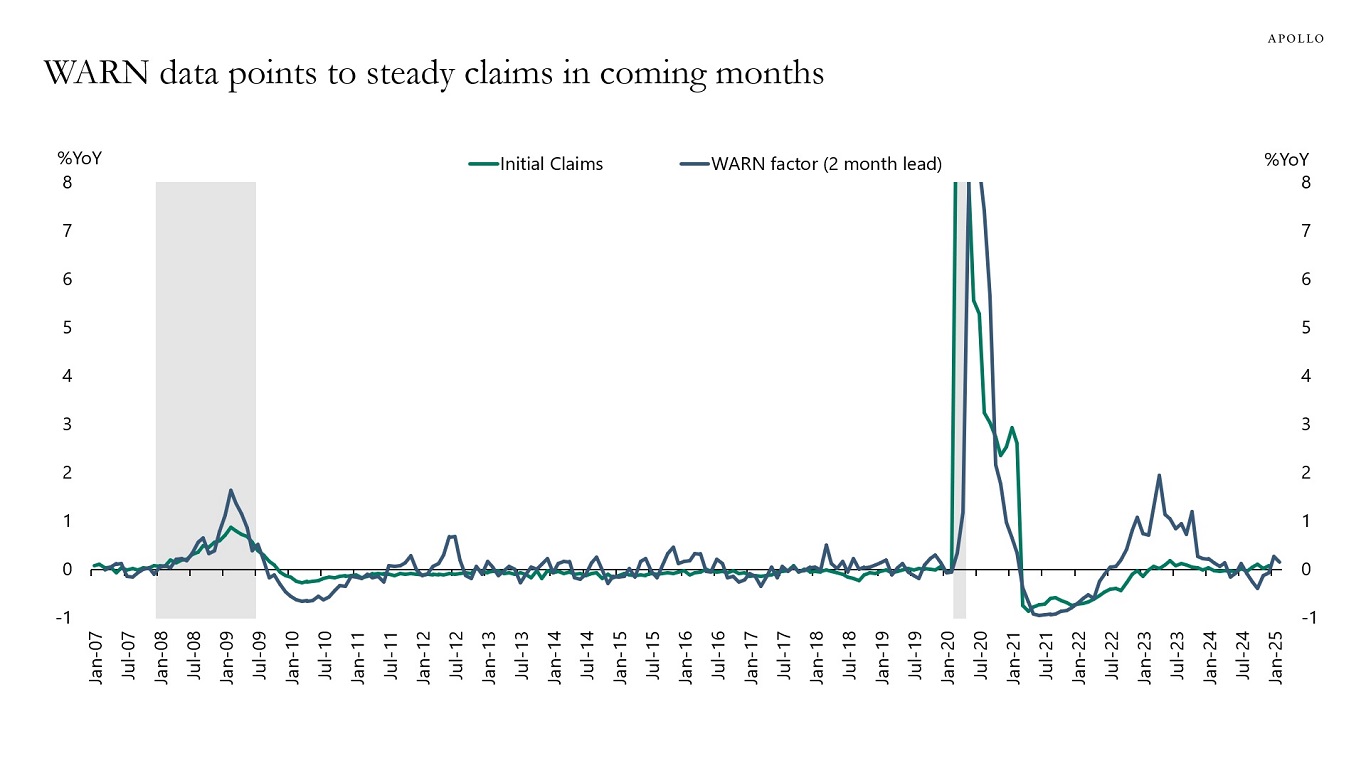
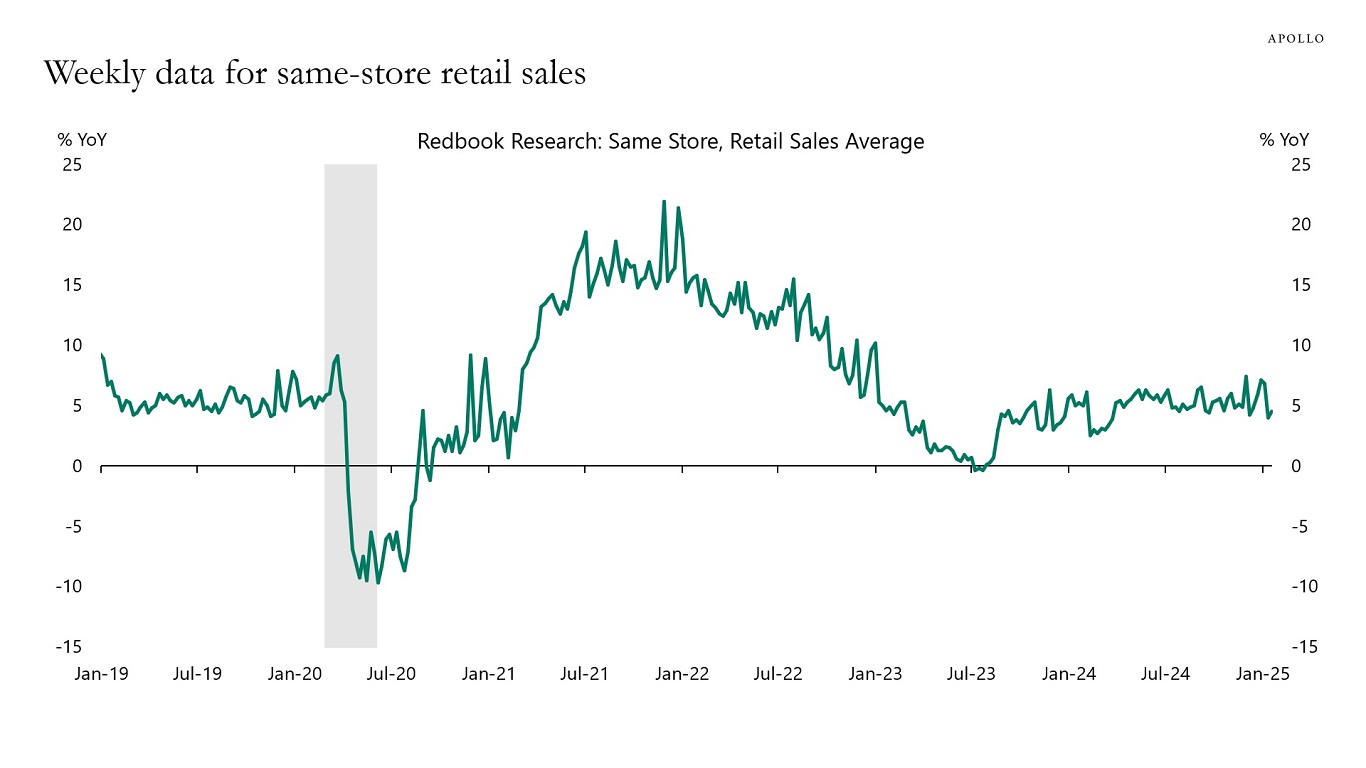
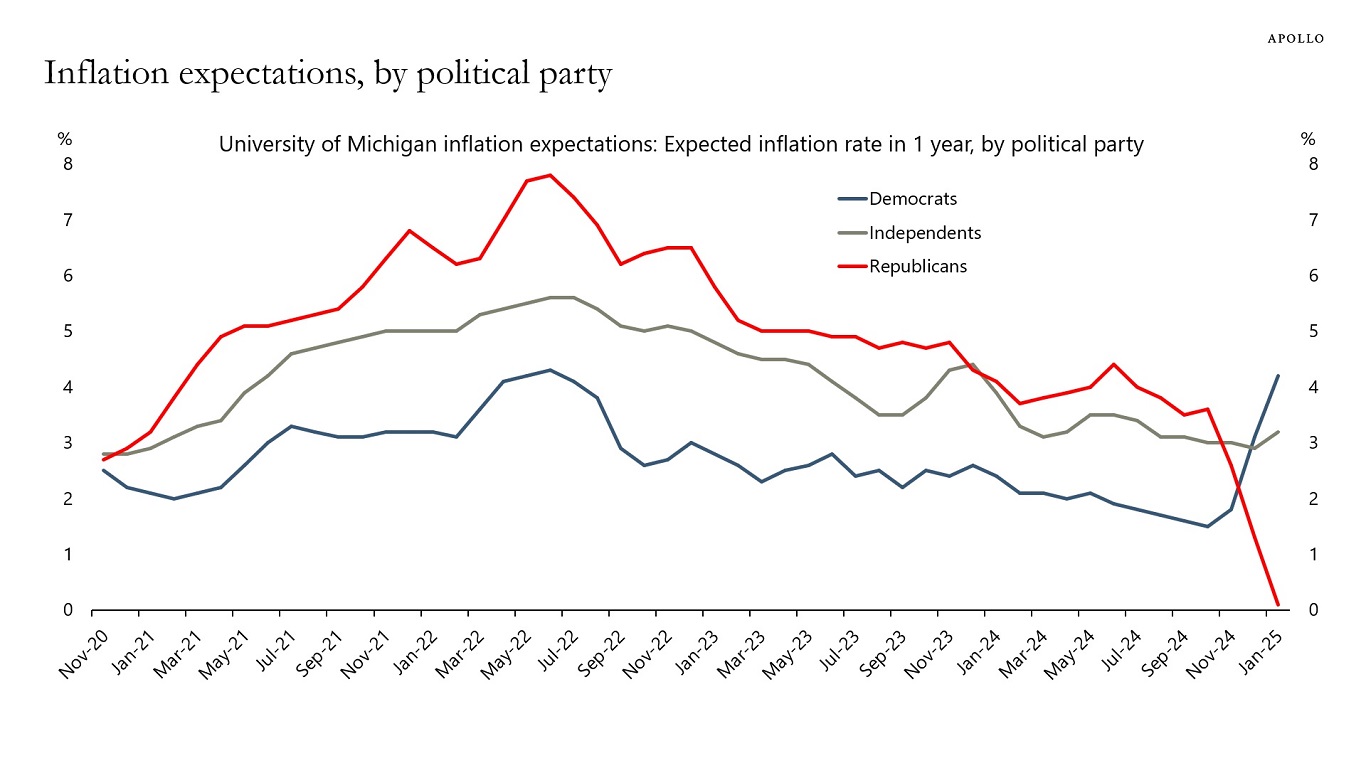
The narrative that the economy is slowing and inflation is moving down to 2% is wrong, see again charts below.

Regional Fed manufacturing surveys point to rebound in nationwide manufacturing ISM
Note: Fed Manufacturing tracker is the average of the FRBNY, Federal Reserve Bank of Richmond, Federal Reserve Bank of Philadelphia, Kansas City Fed, Federal Reserve Bank of Dallas manufacturing surveys. Source: ISM, FRBNY, Federal Reserve Bank of Richmond, Federal Reserve Bank of Philadelphia, Kansas City Fed, Federal Reserve Bank of Dallas
South Korea exports also point toward rebound in manufacturing activity
Source: BoK, ISM, Haver Analytics, Apollo Chief Economist
S&P 500 forward EPS points to higher manufacturing ISM
Source: ISM, Bloomberg, Apollo Chief Economist

Download high-res charts

Recent Posts

  • 90% of US Power Capacity Installations Are Renewables
  • Comparing Wage Growth for Job Stayers and Job Switchers
  • Another Chance to Position Portfolios for Tariff Turmoil?
  • Different Retirement Systems in Europe
  • AI Bubble Today Is Bigger Than the IT Bubble in the 1990s

Recent Comments

No comments to show.

Archives

  • July 2025
  • June 2025
  • May 2025
  • April 2025
  • March 2025
  • February 2025
  • January 2025
  • December 2024
  • November 2024
  • October 2024
  • September 2024
  • August 2024
  • July 2024
  • June 2024
  • May 2024
  • April 2024
  • March 2024
  • February 2024
  • January 2024
  • December 2023
  • November 2023
  • October 2023
  • September 2023
  • August 2023
  • July 2023
  • June 2023
  • May 2023
  • April 2023
  • March 2023
  • February 2023
  • January 2023
  • December 2022
  • November 2022
  • October 2022
  • September 2022
  • August 2022
  • July 2022
  • June 2022
  • May 2022
  • April 2022
  • March 2022
  • February 2022
  • January 2022
  • December 2021
  • November 2021

Categories

  • Apollo Answers
  • Course Introductions
  • Economic Intelligence
  • Hide from Wordpress Search
  • Investment Knowledge
  • Perspectives
  • Redirecting
  • The Daily Spark
  • The View from Apollo
  • The Weekly Brief
  • Uncategorized
  • White Papers

Can Private Markets Be the Alternative to Lofty Public Market Valuations?

High public market valuations pose a key question for allocation adjustments in 2025: What can one do to enhance potential returns, improve diversification, and mitigate volatility?

In this paper, Alexander Wright, Partner and Global Wealth Strategist at the Firm, discusses these questions and more.

DOWNLOAD THE PAPER

Key Takeaways

  • Public markets are expensive and concentrated: Both public stocks and bonds are trading at elevated valuations, offering low risk premia. In equities, performance is increasingly reliant on a small group of mega-cap stocks, amplifying portfolio risks.
  • Diversification is harder to achieve: The rising correlation between public stocks and bonds has practically eroded the diversification benefits of the traditional 60/40 portfolio, leaving investors more exposed to systemic risks.
  • Private markets can enhance portfolio resilience: Private markets can offer access to differentiated return drivers, lower correlations with public markets, and opportunities to improve risk-adjusted return potential, which we believe make them a valuable component of a broader portfolio strategy, especially in light of high public market valuations.
DOWNLOAD THE PAPER

The information herein is provided for educational purposes only and should not be construed as financial or investment advice, nor should any information in this document be relied on when making an investment decision. Opinions and views expressed reflect the current opinions and views of the authors and Apollo Analysts as of the date hereof and are subject to change. Please see the end of this document for important disclosure information.


Important Disclosure Information

This presentation is for educational purposes only and should not be treated as research. This presentation may not be distributed, transmitted or otherwise communicated to others, in whole or in part, without the express written consent of Apollo Global Management, Inc. (together with its subsidiaries, “Apollo”).

The views and opinions expressed in this presentation are the views and opinions of the author(s) of the White Paper. They do not necessarily reflect the views and opinions of Apollo and are subject to change at any time without notice. Further, Apollo and its affiliates may have positions (long or short) or engage in securities transactions that are not consistent with the information and views expressed in this presentation. There can be no assurance that an investment strategy will be successful. Historic market trends are not reliable indicators of actual future market behavior or future performance of any particular investment which may differ materially, and should not be relied upon as such. Target allocations contained herein are subject to change. There is no assurance that the target allocations will be achieved, and actual allocations may be significantly different than that shown here. This presentation does not constitute an offer of any service or product of Apollo. It is not an invitation by or on behalf of Apollo to any person to buy or sell any security or to adopt any investment strategy, and shall not form the basis of, nor may it accompany nor form part of, any right or contract to buy or sell any security or to adopt any investment strategy. Nothing herein should be taken as investment advice or a recommendation to enter into any transaction.

Hyperlinks to third-party websites in this presentation are provided for reader convenience only. There can be no assurance that any trends discussed herein will continue. Unless otherwise noted, information included herein is presented as of the dates indicated. This presentation is not complete and the information contained herein may change at any time without notice. Apollo does not have any responsibility to update the presentation to account for such changes. Apollo has not made any representation or warranty, expressed or implied, with respect to fairness, correctness, accuracy, reasonableness, or completeness of any of the information contained herein, and expressly disclaims any responsibility or liability therefore. The information contained herein is not intended to provide, and should not be relied upon for, accounting, legal or tax advice or investment recommendations. Investors should make an independent investigation of the information contained herein, including consulting their tax, legal, accounting or other advisors about such information. Apollo does not act for you and is not responsible for providing you with the protections afforded to its clients.

Certain information contained herein may be “forward-looking” in nature. Due to various risks and uncertainties, actual events or results may differ materially from those reflected or contemplated in such forward-looking information. As such, undue reliance should not be placed on such information. Forward-looking statements may be identified by the use of terminology including, but not limited to, “may”, “will”, “should”, “expect”, “anticipate”, “target”, “project”, “estimate”, “intend”, “continue” or “believe” or the negatives thereof or other variations thereon or comparable terminology.

The Standard & Poor’s 500 (“S&P 500”) Index is a market-capitalization-weighted index of the 500 largest U.S. publicly traded companies by market value.

Additional information may be available upon request.

Recent Posts

  • 90% of US Power Capacity Installations Are Renewables
  • Comparing Wage Growth for Job Stayers and Job Switchers
  • Another Chance to Position Portfolios for Tariff Turmoil?
  • Different Retirement Systems in Europe
  • AI Bubble Today Is Bigger Than the IT Bubble in the 1990s

Recent Comments

No comments to show.

Archives

  • July 2025
  • June 2025
  • May 2025
  • April 2025
  • March 2025
  • February 2025
  • January 2025
  • December 2024
  • November 2024
  • October 2024
  • September 2024
  • August 2024
  • July 2024
  • June 2024
  • May 2024
  • April 2024
  • March 2024
  • February 2024
  • January 2024
  • December 2023
  • November 2023
  • October 2023
  • September 2023
  • August 2023
  • July 2023
  • June 2023
  • May 2023
  • April 2023
  • March 2023
  • February 2023
  • January 2023
  • December 2022
  • November 2022
  • October 2022
  • September 2022
  • August 2022
  • July 2022
  • June 2022
  • May 2022
  • April 2022
  • March 2022
  • February 2022
  • January 2022
  • December 2021
  • November 2021

Categories

  • Apollo Answers
  • Course Introductions
  • Economic Intelligence
  • Hide from Wordpress Search
  • Investment Knowledge
  • Perspectives
  • Redirecting
  • The Daily Spark
  • The View from Apollo
  • The Weekly Brief
  • Uncategorized
  • White Papers

More Retirement Savings Needed in All OECD Countries

In France, government pension spending is 14% of GDP. In Germany, it is 10%, and in the United States, it is 7%, see chart below.

There is a need for more retirement savings in all OECD countries.

Total public pension spending as % of GDP, by country
Note: Data for 2019. Source: OECD, Apollo Chief Economist

Download high-res chart

Recent Posts

  • 90% of US Power Capacity Installations Are Renewables
  • Comparing Wage Growth for Job Stayers and Job Switchers
  • Another Chance to Position Portfolios for Tariff Turmoil?
  • Different Retirement Systems in Europe
  • AI Bubble Today Is Bigger Than the IT Bubble in the 1990s

Recent Comments

No comments to show.

Archives

  • July 2025
  • June 2025
  • May 2025
  • April 2025
  • March 2025
  • February 2025
  • January 2025
  • December 2024
  • November 2024
  • October 2024
  • September 2024
  • August 2024
  • July 2024
  • June 2024
  • May 2024
  • April 2024
  • March 2024
  • February 2024
  • January 2024
  • December 2023
  • November 2023
  • October 2023
  • September 2023
  • August 2023
  • July 2023
  • June 2023
  • May 2023
  • April 2023
  • March 2023
  • February 2023
  • January 2023
  • December 2022
  • November 2022
  • October 2022
  • September 2022
  • August 2022
  • July 2022
  • June 2022
  • May 2022
  • April 2022
  • March 2022
  • February 2022
  • January 2022
  • December 2021
  • November 2021

Categories

  • Apollo Answers
  • Course Introductions
  • Economic Intelligence
  • Hide from Wordpress Search
  • Investment Knowledge
  • Perspectives
  • Redirecting
  • The Daily Spark
  • The View from Apollo
  • The Weekly Brief
  • Uncategorized
  • White Papers

This Is Not a Correction

The DeepSeek correction in tech stocks has not changed the overall concentration problem in the S&P 500, see chart below. Investors in the S&P 500 continue to be dramatically over-exposed to the tech sector. 

S&P 500 share of top 10 companies still high
Source: Bloomberg, Apollo Chief Economist

Download high-res chart

Recent Posts

  • 90% of US Power Capacity Installations Are Renewables
  • Comparing Wage Growth for Job Stayers and Job Switchers
  • Another Chance to Position Portfolios for Tariff Turmoil?
  • Different Retirement Systems in Europe
  • AI Bubble Today Is Bigger Than the IT Bubble in the 1990s

Recent Comments

No comments to show.

Archives

  • July 2025
  • June 2025
  • May 2025
  • April 2025
  • March 2025
  • February 2025
  • January 2025
  • December 2024
  • November 2024
  • October 2024
  • September 2024
  • August 2024
  • July 2024
  • June 2024
  • May 2024
  • April 2024
  • March 2024
  • February 2024
  • January 2024
  • December 2023
  • November 2023
  • October 2023
  • September 2023
  • August 2023
  • July 2023
  • June 2023
  • May 2023
  • April 2023
  • March 2023
  • February 2023
  • January 2023
  • December 2022
  • November 2022
  • October 2022
  • September 2022
  • August 2022
  • July 2022
  • June 2022
  • May 2022
  • April 2022
  • March 2022
  • February 2022
  • January 2022
  • December 2021
  • November 2021

Categories

  • Apollo Answers
  • Course Introductions
  • Economic Intelligence
  • Hide from Wordpress Search
  • Investment Knowledge
  • Perspectives
  • Redirecting
  • The Daily Spark
  • The View from Apollo
  • The Weekly Brief
  • Uncategorized
  • White Papers

The Evolution of Asset Allocation

Asset allocation has evolved from the 60/40 portfolio to the barbell portfolio to now focusing on fixed income replacement and equity replacement, see chart below.

The evolution of asset allocation
Source: Apollo Chief Economist

Download high-res chart

Recent Posts

  • 90% of US Power Capacity Installations Are Renewables
  • Comparing Wage Growth for Job Stayers and Job Switchers
  • Another Chance to Position Portfolios for Tariff Turmoil?
  • Different Retirement Systems in Europe
  • AI Bubble Today Is Bigger Than the IT Bubble in the 1990s

Recent Comments

No comments to show.

Archives

  • July 2025
  • June 2025
  • May 2025
  • April 2025
  • March 2025
  • February 2025
  • January 2025
  • December 2024
  • November 2024
  • October 2024
  • September 2024
  • August 2024
  • July 2024
  • June 2024
  • May 2024
  • April 2024
  • March 2024
  • February 2024
  • January 2024
  • December 2023
  • November 2023
  • October 2023
  • September 2023
  • August 2023
  • July 2023
  • June 2023
  • May 2023
  • April 2023
  • March 2023
  • February 2023
  • January 2023
  • December 2022
  • November 2022
  • October 2022
  • September 2022
  • August 2022
  • July 2022
  • June 2022
  • May 2022
  • April 2022
  • March 2022
  • February 2022
  • January 2022
  • December 2021
  • November 2021

Categories

  • Apollo Answers
  • Course Introductions
  • Economic Intelligence
  • Hide from Wordpress Search
  • Investment Knowledge
  • Perspectives
  • Redirecting
  • The Daily Spark
  • The View from Apollo
  • The Weekly Brief
  • Uncategorized
  • White Papers

Upside Risks to Inflation

The share of companies planning to raise prices remains elevated and has started to trend higher, see the first chart below.

Combined with the recent jump in ISM services prices paid, see the second chart, this points to upside risks to inflation going forward.

Upside risks to inflation
Source: NFIB, Haver Analytics, Apollo Chief Economist
ISM Services Price Paid index is a leading indicator for PCE
Source: BEA, ISM, Haver Analytics, Apollo Chief Economist

Download high-res charts

Recent Posts

  • 90% of US Power Capacity Installations Are Renewables
  • Comparing Wage Growth for Job Stayers and Job Switchers
  • Another Chance to Position Portfolios for Tariff Turmoil?
  • Different Retirement Systems in Europe
  • AI Bubble Today Is Bigger Than the IT Bubble in the 1990s

Recent Comments

No comments to show.

Archives

  • July 2025
  • June 2025
  • May 2025
  • April 2025
  • March 2025
  • February 2025
  • January 2025
  • December 2024
  • November 2024
  • October 2024
  • September 2024
  • August 2024
  • July 2024
  • June 2024
  • May 2024
  • April 2024
  • March 2024
  • February 2024
  • January 2024
  • December 2023
  • November 2023
  • October 2023
  • September 2023
  • August 2023
  • July 2023
  • June 2023
  • May 2023
  • April 2023
  • March 2023
  • February 2023
  • January 2023
  • December 2022
  • November 2022
  • October 2022
  • September 2022
  • August 2022
  • July 2022
  • June 2022
  • May 2022
  • April 2022
  • March 2022
  • February 2022
  • January 2022
  • December 2021
  • November 2021

Categories

  • Apollo Answers
  • Course Introductions
  • Economic Intelligence
  • Hide from Wordpress Search
  • Investment Knowledge
  • Perspectives
  • Redirecting
  • The Daily Spark
  • The View from Apollo
  • The Weekly Brief
  • Uncategorized
  • White Papers

Trends in US Immigration

We created a chart book looking at recent trends in US immigration. It is available here, with key charts inserted below.

US: 23% of the foreign-born population is unauthorized
Source: Pew Research Center, 2022, Apollo Chief Economist
Estimated unauthorized immigrant population, by country of birth
Note: Pew Research Center estimates based on augmented US Census Bureau data – American Community Survey, 2005-2022 (IPUMS); Current Population Survey, 1995-2004; Decennial Census 1990 from Warren and Warren (2013). Source: Pew Research Center, Apollo Chief Economist

Share of population that is unauthorized, by state
Note: Pew Research Center estimates based on augmented US Census Bureau data – American Community Survey, 2005-2022 (IPUMS); Current Population Survey, 1995-2004; Decennial Census 1990 from Warren and Warren (2013). Source: Pew Research Center, Apollo Chief Economist
Processing times for applications for US citizenship have declined from 12 months to 4 months
Note: Year indicates Fiscal Year. Source: US Citizenship and Immigration Services, Apollo Chief Economist
Working age immigrant population is up 6 million since the pandemic
Source: BLS, Haver Analytics, Apollo Chief Economist
Only 23 states use E-Verify
Note: E-Verify is a voluntary internet-based program to help employers verify the work authorization of all new hires. The program is administered by the US Department of Homeland Security in partnership with the Social Security Administration. Currently, 23 states require the use of E-Verify for at least some public and/or private employers. Source: NCSL, Apollo Chief Economist
Net migration is a key driver of labor force growth
Source: BLS, Haver Analytics, Apollo Chief Economist
Trends in US immigration

Download high-res chart book

Recent Posts

  • 90% of US Power Capacity Installations Are Renewables
  • Comparing Wage Growth for Job Stayers and Job Switchers
  • Another Chance to Position Portfolios for Tariff Turmoil?
  • Different Retirement Systems in Europe
  • AI Bubble Today Is Bigger Than the IT Bubble in the 1990s

Recent Comments

No comments to show.

Archives

  • July 2025
  • June 2025
  • May 2025
  • April 2025
  • March 2025
  • February 2025
  • January 2025
  • December 2024
  • November 2024
  • October 2024
  • September 2024
  • August 2024
  • July 2024
  • June 2024
  • May 2024
  • April 2024
  • March 2024
  • February 2024
  • January 2024
  • December 2023
  • November 2023
  • October 2023
  • September 2023
  • August 2023
  • July 2023
  • June 2023
  • May 2023
  • April 2023
  • March 2023
  • February 2023
  • January 2023
  • December 2022
  • November 2022
  • October 2022
  • September 2022
  • August 2022
  • July 2022
  • June 2022
  • May 2022
  • April 2022
  • March 2022
  • February 2022
  • January 2022
  • December 2021
  • November 2021

Categories

  • Apollo Answers
  • Course Introductions
  • Economic Intelligence
  • Hide from Wordpress Search
  • Investment Knowledge
  • Perspectives
  • Redirecting
  • The Daily Spark
  • The View from Apollo
  • The Weekly Brief
  • Uncategorized
  • White Papers

Interest Rates Higher for Longer Continues

The incoming data shows that weekly same-store retail sales are strong, daily debit card spending data is strong, daily TSA air travel data is strong, the JOLTS layoff rate is very low, WARN notices are low, jobless claims are low, and announced job cuts are very low.  

Combined with the latest Atlanta Fed GDP estimate at 3.0% and a boost coming to growth and inflation because of the Fed cutting interest rates since September and higher animal spirits since the election, the bottom line is that the US economy is entering 2025 with some really strong tailwinds, and the market is underestimating the risk that the Fed will have to hike interest rates later this year.

Our chart book with daily and weekly indicators for the US economy is available here.

Announced job cuts remain low
Source: Challenger, Gray & Christmas, Haver Analytics, Apollo Chief Economist
WARN data points to steady claims in coming months
Note: The Worker Adjustment and Retraining Notification (WARN) Act helps ensure 60 to 90 days advance notice in cases of qualified plant closings and mass layoffs. WARN factor is the Cleveland Fed estimate for WARN notices. Source: Department of Labor, Haver Analytics, Federal Reserve Bank of Cleveland, Apollo Chief Economist
Very low levels of layoffs
Source: BLS, Haver Analytics, Apollo Chief Economist

Daily data for US air travel
Source: TSA, Bloomberg, Apollo Chief Economist
Daily data for debit card transactions
Note: Consists largely of debit card transactions. Source: Bloomberg, Apollo Chief Economist
Weekly data for same-store retail sales
Source: Redbook, Haver Analytics, Apollo Chief Economist
Weekly initial jobless claims
Note: Some data not shown in chart due to significant variances in scale. Source: US Department of Labor, Apollo Chief Economist
Weekly continuing jobless claims
Note: Some data not shown in chart due to significant variances in scale. Source: US Department of Labor, Apollo Chief Economist
2024 Q4 GDP estimate from Atlanta Fed: 3.0%
Source: Federal Reserve Bank of Atlanta, Haver Analytics Apollo Chief Economist
Impact on GDP of Fed cuts and changes in financial conditions since the Fed started cutting interest rates in September 2024
Note: The following shocks are applied to Q4 2024: A 0.2%-point rise in inflation expectations, 7% appreciation in the exchange rate, 0.5 standard deviation fall in VIX, 30 bps tightening of credit spreads, -100 bps rate cuts and -50 bps forward guidance. Source: Bloomberg SHOK model, Apollo Chief Economist
Impact on inflation of Fed cuts and changes in financial conditions since the Fed started cutting interest rates in September 2024
Note: The following shocks are applied to Q4 2024: A 0.2%-point rise in inflation expectations, 7% appreciation in the exchange rate, 0.5 standard deviation fall in VIX, 30 bps tightening of credit spreads, -100 bps rate cuts and -50 bps forward guidance. Source: Bloomberg SHOK model, Apollo Chief Economist

Download high-res chart book

Recent Posts

  • 90% of US Power Capacity Installations Are Renewables
  • Comparing Wage Growth for Job Stayers and Job Switchers
  • Another Chance to Position Portfolios for Tariff Turmoil?
  • Different Retirement Systems in Europe
  • AI Bubble Today Is Bigger Than the IT Bubble in the 1990s

Recent Comments

No comments to show.

Archives

  • July 2025
  • June 2025
  • May 2025
  • April 2025
  • March 2025
  • February 2025
  • January 2025
  • December 2024
  • November 2024
  • October 2024
  • September 2024
  • August 2024
  • July 2024
  • June 2024
  • May 2024
  • April 2024
  • March 2024
  • February 2024
  • January 2024
  • December 2023
  • November 2023
  • October 2023
  • September 2023
  • August 2023
  • July 2023
  • June 2023
  • May 2023
  • April 2023
  • March 2023
  • February 2023
  • January 2023
  • December 2022
  • November 2022
  • October 2022
  • September 2022
  • August 2022
  • July 2022
  • June 2022
  • May 2022
  • April 2022
  • March 2022
  • February 2022
  • January 2022
  • December 2021
  • November 2021

Categories

  • Apollo Answers
  • Course Introductions
  • Economic Intelligence
  • Hide from Wordpress Search
  • Investment Knowledge
  • Perspectives
  • Redirecting
  • The Daily Spark
  • The View from Apollo
  • The Weekly Brief
  • Uncategorized
  • White Papers

Inflation Expectations by Political Party

Household inflation expectations have shifted completely after the election, see the chart below.

Inflation expectations, by political party
Source: University of Michigan, Bloomberg, Apollo Chief Economist

Download high-res chart

Recent Posts

  • 90% of US Power Capacity Installations Are Renewables
  • Comparing Wage Growth for Job Stayers and Job Switchers
  • Another Chance to Position Portfolios for Tariff Turmoil?
  • Different Retirement Systems in Europe
  • AI Bubble Today Is Bigger Than the IT Bubble in the 1990s

Recent Comments

No comments to show.

Archives

  • July 2025
  • June 2025
  • May 2025
  • April 2025
  • March 2025
  • February 2025
  • January 2025
  • December 2024
  • November 2024
  • October 2024
  • September 2024
  • August 2024
  • July 2024
  • June 2024
  • May 2024
  • April 2024
  • March 2024
  • February 2024
  • January 2024
  • December 2023
  • November 2023
  • October 2023
  • September 2023
  • August 2023
  • July 2023
  • June 2023
  • May 2023
  • April 2023
  • March 2023
  • February 2023
  • January 2023
  • December 2022
  • November 2022
  • October 2022
  • September 2022
  • August 2022
  • July 2022
  • June 2022
  • May 2022
  • April 2022
  • March 2022
  • February 2022
  • January 2022
  • December 2021
  • November 2021

Categories

  • Apollo Answers
  • Course Introductions
  • Economic Intelligence
  • Hide from Wordpress Search
  • Investment Knowledge
  • Perspectives
  • Redirecting
  • The Daily Spark
  • The View from Apollo
  • The Weekly Brief
  • Uncategorized
  • White Papers

2025 Credit Outlook: Defying Gravity

Following the strong performance of 2024, credit markets are entering 2025 in a solid position. While at first glance, it may appear that risks are one-sided, given that spreads are near multi-year tights across several segments of the credit market, we expect the fundamental and technical backdrop to remain strong.

Still, we believe there could be some headline risk associated with the implementation of the incoming US administration’s policies—from tariffs, immigration, and fiscal policy—which could potentially inject more volatility into markets.

We expect the relationship between banks and private credit firms will continue to turn more symbiotic through strategic alliances. Initially targeted at the sub-investment grade market, we expect these partnerships will eventually extend to investment grade (IG) companies as well: While public IG funding is widely accessible, the lack of flexible financing solutions available today can create an opportunity for private credit providers.

Another key theme for the new year will likely be the rising demand for data center capacity and associated infrastructure, which we estimate will require more than $2 trillion over the next five years. Given the sheer size and unique characteristics of many of these projects, we think that bespoke, privately originated IG financing will be part of the capital solution to finance this investment.

As 2025 progresses, we expect investors will turn their attention to the next sub-investment grade maturity wall, with over $620 billion of high yield bonds and loans set to come due in 2026 and 2027. We saw some notable differences in the way many of the 2024/25 maturities were addressed, which could suggest a large opportunity for private credit to reprise its role as an alternative financing option for companies with upcoming maturities.

Our 2025 Credit Outlook is available here.

Recent Posts

  • 90% of US Power Capacity Installations Are Renewables
  • Comparing Wage Growth for Job Stayers and Job Switchers
  • Another Chance to Position Portfolios for Tariff Turmoil?
  • Different Retirement Systems in Europe
  • AI Bubble Today Is Bigger Than the IT Bubble in the 1990s

Recent Comments

No comments to show.

Archives

  • July 2025
  • June 2025
  • May 2025
  • April 2025
  • March 2025
  • February 2025
  • January 2025
  • December 2024
  • November 2024
  • October 2024
  • September 2024
  • August 2024
  • July 2024
  • June 2024
  • May 2024
  • April 2024
  • March 2024
  • February 2024
  • January 2024
  • December 2023
  • November 2023
  • October 2023
  • September 2023
  • August 2023
  • July 2023
  • June 2023
  • May 2023
  • April 2023
  • March 2023
  • February 2023
  • January 2023
  • December 2022
  • November 2022
  • October 2022
  • September 2022
  • August 2022
  • July 2022
  • June 2022
  • May 2022
  • April 2022
  • March 2022
  • February 2022
  • January 2022
  • December 2021
  • November 2021

Categories

  • Apollo Answers
  • Course Introductions
  • Economic Intelligence
  • Hide from Wordpress Search
  • Investment Knowledge
  • Perspectives
  • Redirecting
  • The Daily Spark
  • The View from Apollo
  • The Weekly Brief
  • Uncategorized
  • White Papers

Posts navigation

Page 1 Page 2 … Page 4 Next page→
  • Privacy Notice
  • Terms of Use
  • Forward-Looking Statements
Apollo
© Apollo Global Management, Inc. All Rights Reserved.

The Apollo Academy is for informational and educational purposes only and nothing contained herein should be taken as investment advice or a recommendation to enter into any transaction. They are not an invitation by or on behalf of Apollo to any person to buy or sell any security or to adopt any investment strategy, and shall not form the basis of, nor may it accompany nor form part of, any right or contract to buy or sell any security or to adopt any investment strategy. There is no guarantee that the views and opinions expressed in this website will come to pass. For additional information, please see the disclaimers included in each piece of content or the legal page of our website here.