• Apollo.com
  • Login
  • Register Now
light site-logo
  • The Academy
  • Upcoming Events
        • Upcoming Events

  • Learning Center
        • New & UpdatedAlternative Investing Course 2.0

        • Alternative Investing Essentials Part OnePrivate Equity, Venture Capital, Private Credit
        • Alternative Investing Essentials Part TwoReal Estate, Infrastructure, Digital Assets, Hedge Funds
        • Practical ConsiderationsAsset Allocation, Risk Considerations, Fund Structures, Fees
        • Introductory Videos

          View All Videos

        •  Recent Classes & Videos

        • • Mid-Year Outlook: At the Crossroads of Stagflation — What’s Next?
        • • Hybrid Investments: Flexible Structures for Volatile Times
        • • Private Credit Investing in Volatile Times
        • • Potential Implications of the Latest US Administration Policy Proposals
        • • Beyond 60/40: Private Assets in an Era of High Public Valuations
        • • Investment Grade Private Credit as a Core Fixed Income Allocation
        • View All Classes

  • Alternative Perspectives
        • Investment Knowledge
        • The View from Apollo
          • Investment Knowledge White Papers

            Mid-Year Outlook: At the Crossroads of Stagflation—What’s Next?

            June 23, 2025
          • The View From Apollo

            Another Chance to Position Portfolios for Tariff Turmoil?

            July 17, 2025
          • Investment Knowledge White Papers

            The Continental Shift: Europe’s Private Credit Moment

            June 20, 2025
  • The Daily Spark
        • Read The Daily Spark Blog


        • Want it delivered daily to your inbox?
          • The Daily Spark

            Comparing Wage Growth for Job Stayers and Job Switchers

            July 18, 2025
          • The Daily Spark

            Different Retirement Systems in Europe

            July 17, 2025
          • The Daily Spark

            AI Bubble Today Is Bigger Than the IT Bubble in the 1990s

            July 16, 2025
  • Register for Apollo Academy: Alternative Investing Course
  • Login
  • About Apollo Academy
  • Upcoming Events
  • Learning Center
  • Alternative Perspectives
  • The Daily Spark
  • Register for Apollo Academy: Alternative Investing Course
  • Login
  • Alternative Investing Course 2.0
  • Mid-Year Outlook: At the Crossroads of Stagflation — What’s Next?
  • Hybrid Investments: Flexible Structures for Volatile Times
  • Private Credit Investing in Volatile Times
  • Potential Implications of the Latest US Administration Policy Proposals
  • Beyond 60/40: Private Assets in an Era of High Public Valuations
  • Investment Grade Private Credit as a Core Fixed Income Allocation
  • View All Classes
  • Introductory Videos
  • Alternative Investing Essentials Part One • Now Available On Demand
  • Alternative Investing Essentials Part Two • Now Available On Demand
  • Practical Considerations • Now Available On Demand
  • Investment Knowledge
  • The View from Apollo
Home May 2025

Outlook for Credit Markets

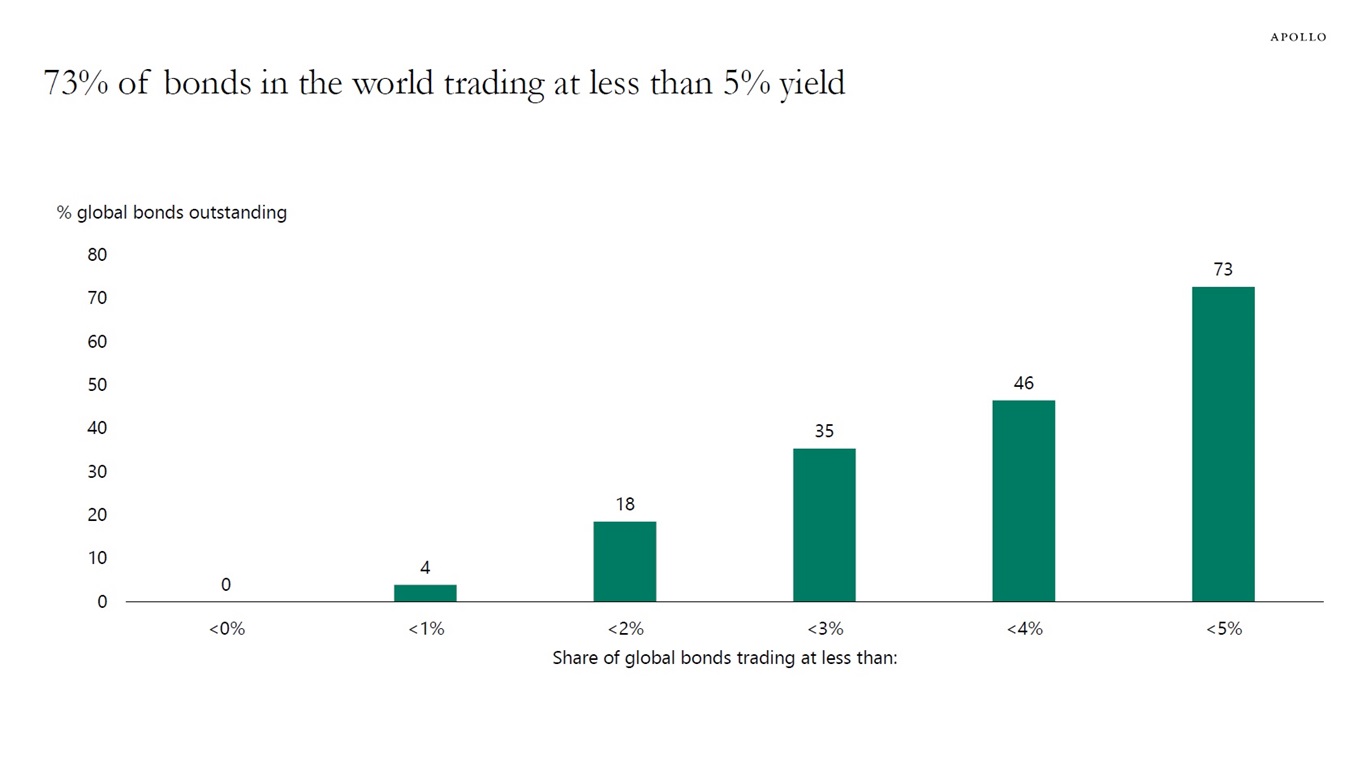
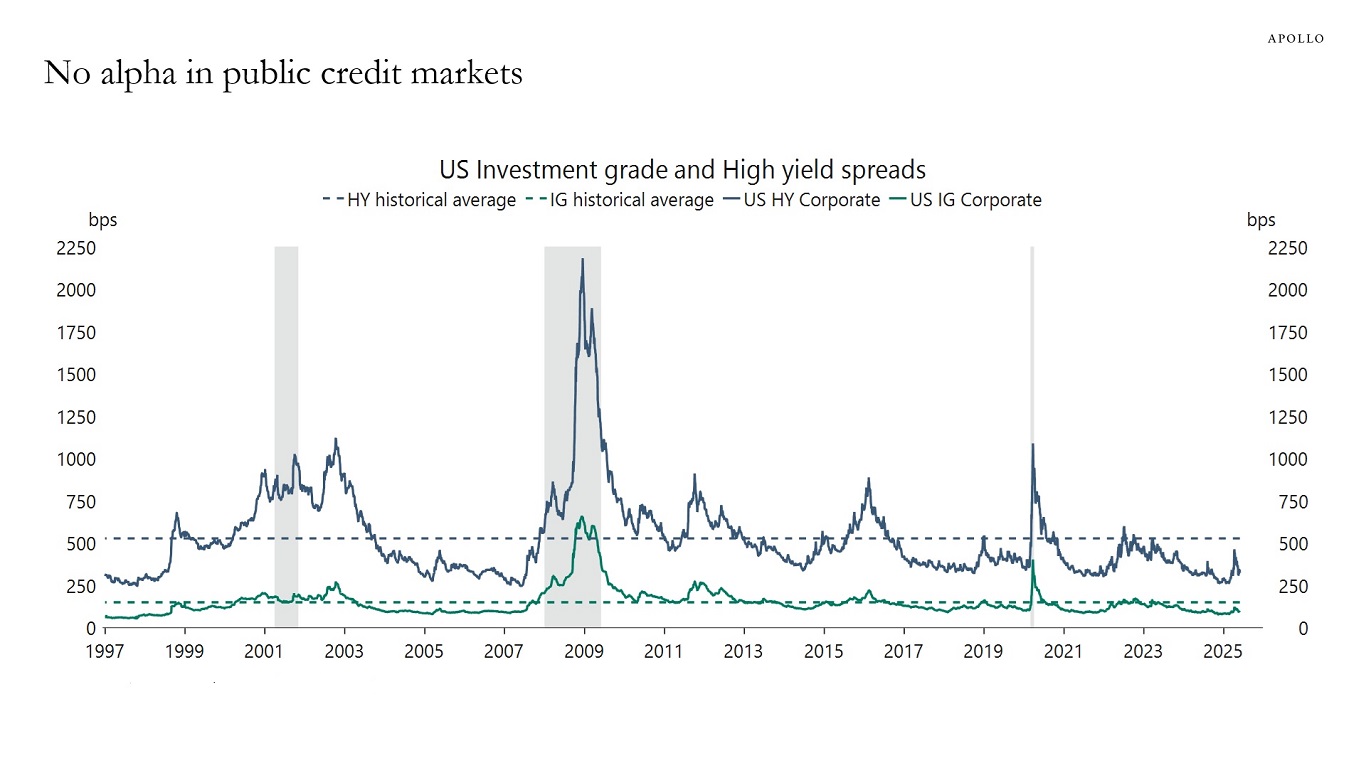
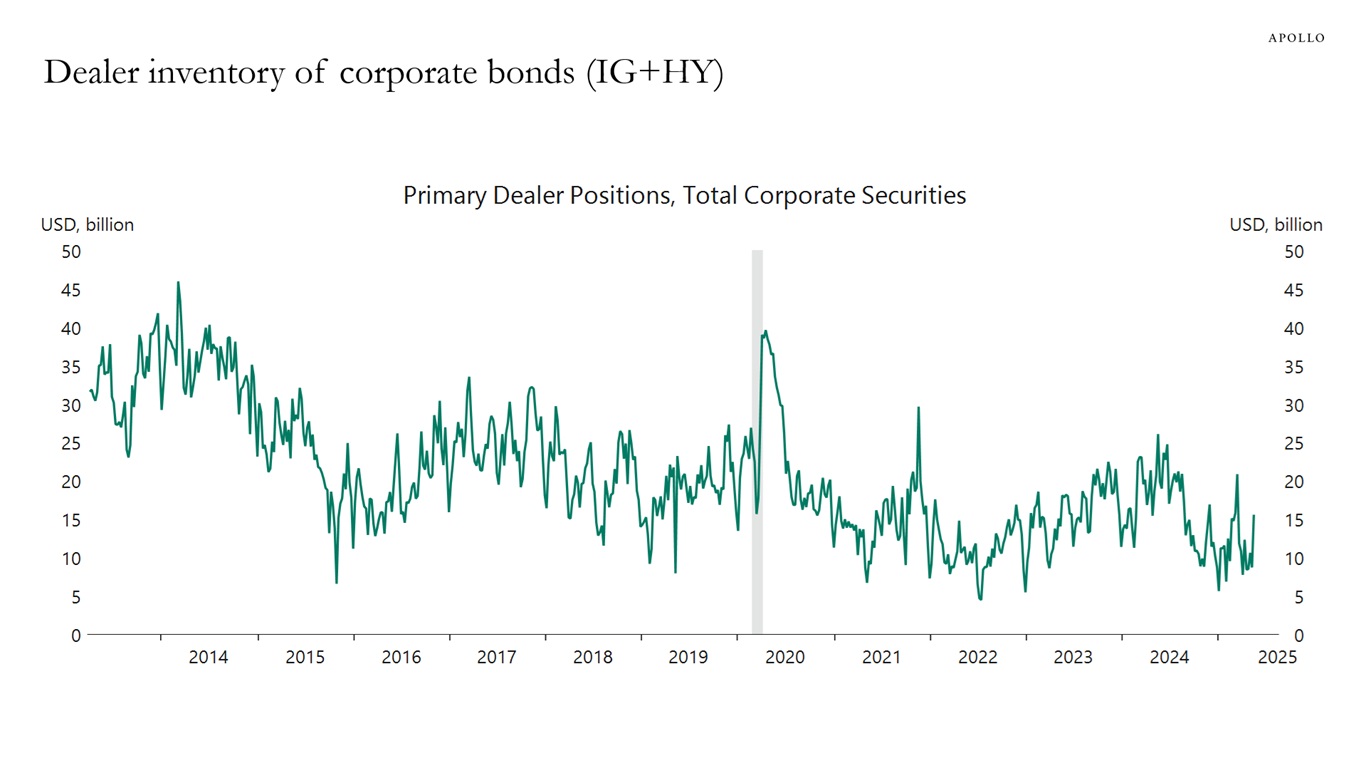
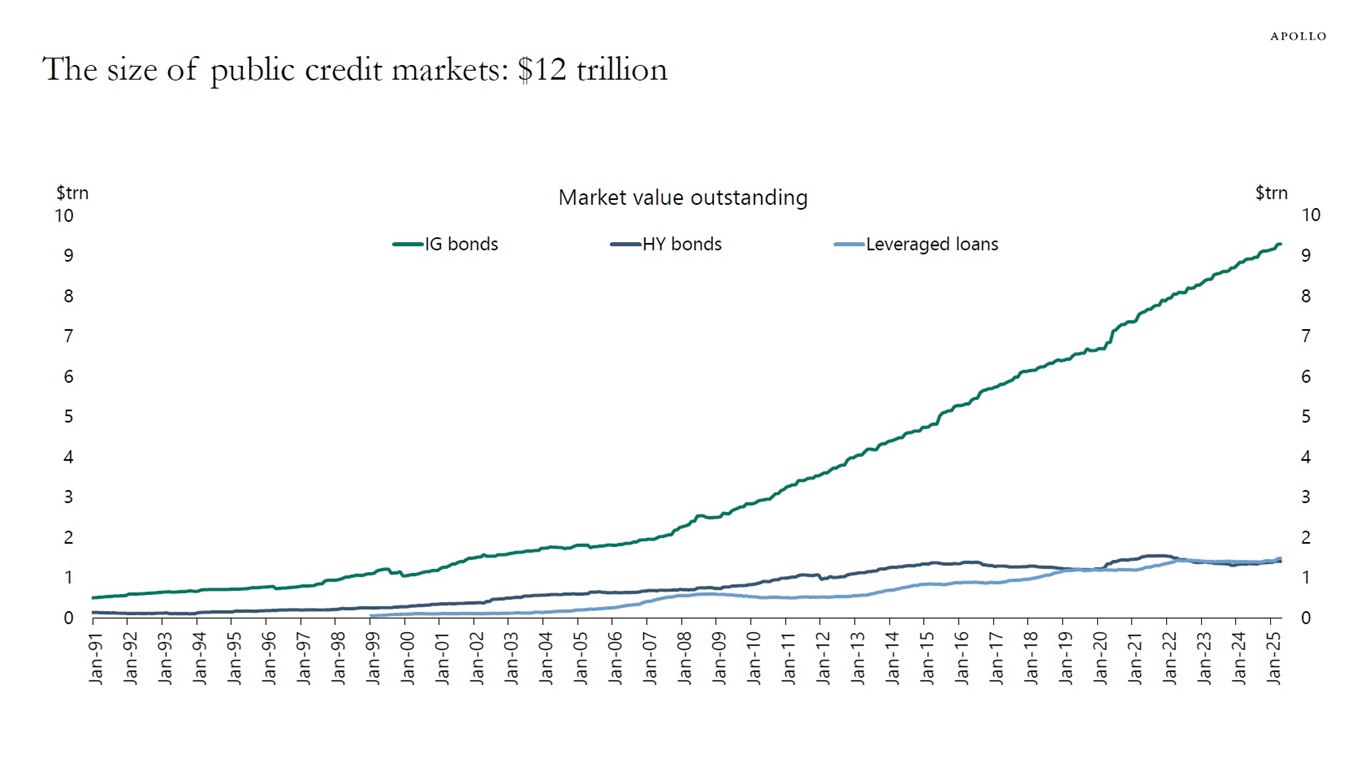
Seventy-three percent of bonds in the world trade at a yield of less than 5%, see chart below. There is only beta in public credit markets, and with the total amount of public credit outstanding at $12 trillion and only $15 billion in dealer inventory, there is little liquidity in public credit markets, see charts below. Our latest credit market outlook is available here.

73% of bonds in the world trading at less than 5% yield
Note: Data as of May 28, 2025. Sources: Bloomberg, Apollo Chief Economist
No alpha in public credit markets
Sources: ICE BofAML, Macrobond, Apollo Chief Economist
Dealer inventory of corporate bonds (IG+HY)
Sources: Federal Reserve Bank of New York, Macrobond, Apollo Chief Economist
The size of public credit markets: $12 trillion
Note: Ticker used for HY is H0A0 Index and for IG it is C0A0 Index and for Loans it is SPBDALB Index. Sources: ICE BofA, Bloomberg, PitchBook LCD, Apollo Chief Economist

Download high-res chart book

Recent Posts

  • Comparing Wage Growth for Job Stayers and Job Switchers
  • Another Chance to Position Portfolios for Tariff Turmoil?
  • Different Retirement Systems in Europe
  • AI Bubble Today Is Bigger Than the IT Bubble in the 1990s
  • 75% of Restaurant Orders Are Delivery Orders

Recent Comments

No comments to show.

Archives

  • July 2025
  • June 2025
  • May 2025
  • April 2025
  • March 2025
  • February 2025
  • January 2025
  • December 2024
  • November 2024
  • October 2024
  • September 2024
  • August 2024
  • July 2024
  • June 2024
  • May 2024
  • April 2024
  • March 2024
  • February 2024
  • January 2024
  • December 2023
  • November 2023
  • October 2023
  • September 2023
  • August 2023
  • July 2023
  • June 2023
  • May 2023
  • April 2023
  • March 2023
  • February 2023
  • January 2023
  • December 2022
  • November 2022
  • October 2022
  • September 2022
  • August 2022
  • July 2022
  • June 2022
  • May 2022
  • April 2022
  • March 2022
  • February 2022
  • January 2022
  • December 2021
  • November 2021

Categories

  • Apollo Answers
  • Course Introductions
  • Economic Intelligence
  • Hide from Wordpress Search
  • Investment Knowledge
  • Perspectives
  • Redirecting
  • The Daily Spark
  • The View from Apollo
  • The Weekly Brief
  • Uncategorized
  • White Papers

US Sovereign CDS Spread at BBB Levels

The US sovereign CDS spread is currently trading at levels similar to countries that are rated BBB+, such as Italy and Greece, see chart below. For solutions to the US fiscal challenges see here and here.

Sovereign CDS spreads vs sovereign credit rating
Data as of May 27, 2025. Sources: S&P Capital IQ, Bloomberg, Apollo Chief Economist

Download high-res chart

Recent Posts

  • Comparing Wage Growth for Job Stayers and Job Switchers
  • Another Chance to Position Portfolios for Tariff Turmoil?
  • Different Retirement Systems in Europe
  • AI Bubble Today Is Bigger Than the IT Bubble in the 1990s
  • 75% of Restaurant Orders Are Delivery Orders

Recent Comments

No comments to show.

Archives

  • July 2025
  • June 2025
  • May 2025
  • April 2025
  • March 2025
  • February 2025
  • January 2025
  • December 2024
  • November 2024
  • October 2024
  • September 2024
  • August 2024
  • July 2024
  • June 2024
  • May 2024
  • April 2024
  • March 2024
  • February 2024
  • January 2024
  • December 2023
  • November 2023
  • October 2023
  • September 2023
  • August 2023
  • July 2023
  • June 2023
  • May 2023
  • April 2023
  • March 2023
  • February 2023
  • January 2023
  • December 2022
  • November 2022
  • October 2022
  • September 2022
  • August 2022
  • July 2022
  • June 2022
  • May 2022
  • April 2022
  • March 2022
  • February 2022
  • January 2022
  • December 2021
  • November 2021

Categories

  • Apollo Answers
  • Course Introductions
  • Economic Intelligence
  • Hide from Wordpress Search
  • Investment Knowledge
  • Perspectives
  • Redirecting
  • The Daily Spark
  • The View from Apollo
  • The Weekly Brief
  • Uncategorized
  • White Papers

More Than 80% of Active Managers in Public Markets Underperform Their Index

The chart below shows the underperformance of active managers in public equities by strategy. The bottom line is that over the past 10 years, 80% to 90% of active managers have underperformed their benchmarks across all strategies. For more, see the S&P SPIVA data here.

Percentage of funds that underperformed their individual benchmark, by strategy
Note: Data as of December 31, 2024. Sources: SPIVA scorecard, Apollo Chief Economist

Download high-res chart

Recent Posts

  • Comparing Wage Growth for Job Stayers and Job Switchers
  • Another Chance to Position Portfolios for Tariff Turmoil?
  • Different Retirement Systems in Europe
  • AI Bubble Today Is Bigger Than the IT Bubble in the 1990s
  • 75% of Restaurant Orders Are Delivery Orders

Recent Comments

No comments to show.

Archives

  • July 2025
  • June 2025
  • May 2025
  • April 2025
  • March 2025
  • February 2025
  • January 2025
  • December 2024
  • November 2024
  • October 2024
  • September 2024
  • August 2024
  • July 2024
  • June 2024
  • May 2024
  • April 2024
  • March 2024
  • February 2024
  • January 2024
  • December 2023
  • November 2023
  • October 2023
  • September 2023
  • August 2023
  • July 2023
  • June 2023
  • May 2023
  • April 2023
  • March 2023
  • February 2023
  • January 2023
  • December 2022
  • November 2022
  • October 2022
  • September 2022
  • August 2022
  • July 2022
  • June 2022
  • May 2022
  • April 2022
  • March 2022
  • February 2022
  • January 2022
  • December 2021
  • November 2021

Categories

  • Apollo Answers
  • Course Introductions
  • Economic Intelligence
  • Hide from Wordpress Search
  • Investment Knowledge
  • Perspectives
  • Redirecting
  • The Daily Spark
  • The View from Apollo
  • The Weekly Brief
  • Uncategorized
  • White Papers

Private Credit Investing in Volatile Times

DOWNLOAD THE PAPER

Key Takeaways

  • While not immune to the shifts in policy and the macroeconomic outlook, we expect to see resilient demand for private credit as the need for direct, larger, and more flexible financing remains and is likely reinforced by economic uncertainty.
  • The leveraged credit market primarily finances domestic companies focused on sectors that are less directly impacted by tariffs—giving investors a chance to build portfolios that can better withstand periods of lower economic activity.
  • Sharp focus on senior secured, first-lien debt is always important but paramount in the current environment. Downside risks to the US economy mean increased cash-flow pressure and liquidity constraints across many segments of the market. 
  • Historically, private credit has shown resilience in times of market stress and provided relative downside protection with low correlation to other major asset classes. A focus on lending to large corporates can add another layer of protection, financing businesses with stronger cash flows, diversified earnings streams and well-established business models.  
  • Our work highlights a modern approach to core-plus allocations, showing that the addition of private credit to a portfolio of public fixed-income securities can enhance risk-adjusted returns.
DOWNLOAD THE PAPER

The information herein is provided for educational purposes only and should not be construed as financial or investment advice, nor should any information in this document be relied on when making an investment decision. Opinions and views expressed reflect the current opinions and views of the authors and Apollo Analysts as of the date hereof and are subject to change. Please see the end of this document for important disclosure information.


Important Disclosure Information

This presentation is for educational purposes only and should not be treated as research. This presentation may not be distributed, transmitted or otherwise communicated to others, in whole or in part, without the express written consent of Apollo Global Management, Inc. (together with its subsidiaries, “Apollo”).

The views and opinions expressed in this presentation are the views and opinions of the author(s) of the White Paper. They do not necessarily reflect the views and opinions of Apollo and are subject to change at any time without notice. Further, Apollo and its affiliates may have positions (long or short) or engage in securities transactions that are not consistent with the information and views expressed in this presentation. There can be no assurance that an investment strategy will be successful. Historic market trends are not reliable indicators of actual future market behavior or future performance of any particular investment which may differ materially, and should not be relied upon as such. Target allocations contained herein are subject to change. There is no assurance that the target allocations will be achieved, and actual allocations may be significantly different than that shown here. This presentation does not constitute an offer of any service or product of Apollo. It is not an invitation by or on behalf of Apollo to any person to buy or sell any security or to adopt any investment strategy, and shall not form the basis of, nor may it accompany nor form part of, any right or contract to buy or sell any security or to adopt any investment strategy. Nothing herein should be taken as investment advice or a recommendation to enter into any transaction.

Hyperlinks to third-party websites in this presentation are provided for reader convenience only. There can be no assurance that any trends discussed herein will continue. Unless otherwise noted, information included herein is presented as of the dates indicated. This presentation is not complete and the information contained herein may change at any time without notice. Apollo does not have any responsibility to update the presentation to account for such changes. Apollo has not made any representation or warranty, expressed or implied, with respect to fairness, correctness, accuracy, reasonableness, or completeness of any of the information contained herein, and expressly disclaims any responsibility or liability therefore. The information contained herein is not intended to provide, and should not be relied upon for, accounting, legal or tax advice or investment recommendations. Investors should make an independent investigation of the information contained herein, including consulting their tax, legal, accounting or other advisors about such information. Apollo does not act for you and is not responsible for providing you with the protections afforded to its clients.

Certain information contained herein may be “forward-looking” in nature. Due to various risks and uncertainties, actual events or results may differ materially from those reflected or contemplated in such forward-looking information. As such, undue reliance should not be placed on such information. Forward-looking statements may be identified by the use of terminology including, but not limited to, “may”, “will”, “should”, “expect”, “anticipate”, “target”, “project”, “estimate”, “intend”, “continue” or “believe” or the negatives thereof or other variations thereon or comparable terminology.

The Standard & Poor’s 500 (“S&P 500”) Index is a market-capitalization-weighted index of the 500 largest U.S. publicly traded companies by market value.

Additional information may be available upon request.

Recent Posts

  • Comparing Wage Growth for Job Stayers and Job Switchers
  • Another Chance to Position Portfolios for Tariff Turmoil?
  • Different Retirement Systems in Europe
  • AI Bubble Today Is Bigger Than the IT Bubble in the 1990s
  • 75% of Restaurant Orders Are Delivery Orders

Recent Comments

No comments to show.

Archives

  • July 2025
  • June 2025
  • May 2025
  • April 2025
  • March 2025
  • February 2025
  • January 2025
  • December 2024
  • November 2024
  • October 2024
  • September 2024
  • August 2024
  • July 2024
  • June 2024
  • May 2024
  • April 2024
  • March 2024
  • February 2024
  • January 2024
  • December 2023
  • November 2023
  • October 2023
  • September 2023
  • August 2023
  • July 2023
  • June 2023
  • May 2023
  • April 2023
  • March 2023
  • February 2023
  • January 2023
  • December 2022
  • November 2022
  • October 2022
  • September 2022
  • August 2022
  • July 2022
  • June 2022
  • May 2022
  • April 2022
  • March 2022
  • February 2022
  • January 2022
  • December 2021
  • November 2021

Categories

  • Apollo Answers
  • Course Introductions
  • Economic Intelligence
  • Hide from Wordpress Search
  • Investment Knowledge
  • Perspectives
  • Redirecting
  • The Daily Spark
  • The View from Apollo
  • The Weekly Brief
  • Uncategorized
  • White Papers

Data Center Construction Contributing One Percentage Point to GDP Growth

Data center construction added one percentage point to GDP growth in the first quarter, see chart below. This will be a strong tailwind to US economic growth over the coming years.

Data center investment added one percentage point to GDP growth in 2025 Q1
Note: pp = percentage points. Sources: Bloomberg, Macrobond, Apollo Chief Economist

Download high-res chart

Recent Posts

  • Comparing Wage Growth for Job Stayers and Job Switchers
  • Another Chance to Position Portfolios for Tariff Turmoil?
  • Different Retirement Systems in Europe
  • AI Bubble Today Is Bigger Than the IT Bubble in the 1990s
  • 75% of Restaurant Orders Are Delivery Orders

Recent Comments

No comments to show.

Archives

  • July 2025
  • June 2025
  • May 2025
  • April 2025
  • March 2025
  • February 2025
  • January 2025
  • December 2024
  • November 2024
  • October 2024
  • September 2024
  • August 2024
  • July 2024
  • June 2024
  • May 2024
  • April 2024
  • March 2024
  • February 2024
  • January 2024
  • December 2023
  • November 2023
  • October 2023
  • September 2023
  • August 2023
  • July 2023
  • June 2023
  • May 2023
  • April 2023
  • March 2023
  • February 2023
  • January 2023
  • December 2022
  • November 2022
  • October 2022
  • September 2022
  • August 2022
  • July 2022
  • June 2022
  • May 2022
  • April 2022
  • March 2022
  • February 2022
  • January 2022
  • December 2021
  • November 2021

Categories

  • Apollo Answers
  • Course Introductions
  • Economic Intelligence
  • Hide from Wordpress Search
  • Investment Knowledge
  • Perspectives
  • Redirecting
  • The Daily Spark
  • The View from Apollo
  • The Weekly Brief
  • Uncategorized
  • White Papers

Number of Days Working From Home per Week

American workers work from home on average 1.6 days per week, which is more than workers in Italy, France, and China, see chart below.

Average number of days working from home every week, by country
Sources: WFH Research, Apollo Chief Economist

Download high-res chart

Recent Posts

  • Comparing Wage Growth for Job Stayers and Job Switchers
  • Another Chance to Position Portfolios for Tariff Turmoil?
  • Different Retirement Systems in Europe
  • AI Bubble Today Is Bigger Than the IT Bubble in the 1990s
  • 75% of Restaurant Orders Are Delivery Orders

Recent Comments

No comments to show.

Archives

  • July 2025
  • June 2025
  • May 2025
  • April 2025
  • March 2025
  • February 2025
  • January 2025
  • December 2024
  • November 2024
  • October 2024
  • September 2024
  • August 2024
  • July 2024
  • June 2024
  • May 2024
  • April 2024
  • March 2024
  • February 2024
  • January 2024
  • December 2023
  • November 2023
  • October 2023
  • September 2023
  • August 2023
  • July 2023
  • June 2023
  • May 2023
  • April 2023
  • March 2023
  • February 2023
  • January 2023
  • December 2022
  • November 2022
  • October 2022
  • September 2022
  • August 2022
  • July 2022
  • June 2022
  • May 2022
  • April 2022
  • March 2022
  • February 2022
  • January 2022
  • December 2021
  • November 2021

Categories

  • Apollo Answers
  • Course Introductions
  • Economic Intelligence
  • Hide from Wordpress Search
  • Investment Knowledge
  • Perspectives
  • Redirecting
  • The Daily Spark
  • The View from Apollo
  • The Weekly Brief
  • Uncategorized
  • White Papers

Inflation Going Up

Inflation has for several years been moving down toward the Fed’s 2% inflation target. But the consensus now expects inflation to rise over the coming quarters, driven by tariffs and by upward pressure on housing inflation, see charts below.

Consensus expects inflation to rise over the coming quarters
Sources: Bloomberg, Apollo Chief Economist
Upward pressure on housing inflation
Sources: Federal National Mortgage Association (Fannie Mae), Federal Reserve Bank of New York, US Bureau of Labor Statistics (BLS), Macrobond, Apollo Chief Economist

Download high-res charts

Recent Posts

  • Comparing Wage Growth for Job Stayers and Job Switchers
  • Another Chance to Position Portfolios for Tariff Turmoil?
  • Different Retirement Systems in Europe
  • AI Bubble Today Is Bigger Than the IT Bubble in the 1990s
  • 75% of Restaurant Orders Are Delivery Orders

Recent Comments

No comments to show.

Archives

  • July 2025
  • June 2025
  • May 2025
  • April 2025
  • March 2025
  • February 2025
  • January 2025
  • December 2024
  • November 2024
  • October 2024
  • September 2024
  • August 2024
  • July 2024
  • June 2024
  • May 2024
  • April 2024
  • March 2024
  • February 2024
  • January 2024
  • December 2023
  • November 2023
  • October 2023
  • September 2023
  • August 2023
  • July 2023
  • June 2023
  • May 2023
  • April 2023
  • March 2023
  • February 2023
  • January 2023
  • December 2022
  • November 2022
  • October 2022
  • September 2022
  • August 2022
  • July 2022
  • June 2022
  • May 2022
  • April 2022
  • March 2022
  • February 2022
  • January 2022
  • December 2021
  • November 2021

Categories

  • Apollo Answers
  • Course Introductions
  • Economic Intelligence
  • Hide from Wordpress Search
  • Investment Knowledge
  • Perspectives
  • Redirecting
  • The Daily Spark
  • The View from Apollo
  • The Weekly Brief
  • Uncategorized
  • White Papers

No Rebound in US/China Container Traffic

It’s been nearly two weeks since the China/US trade deal, but container traffic from China to the US hasn’t shown a strong rebound, see chart below.

This raises the question: Are 30% tariffs on China still too high? Or are US companies simply waiting to see if tariffs will drop further before ramping up shipments?

Container departures from China to the US
Note: Displays the estimated number of container vessels departing China for the United States, focusing on dry cargo ships. Aggregates data using a 15-day moving average to reduce short-term volatility and to provide a clearer view of broader trends in vessel activity. Sources: Bloomberg, Macrobond, Apollo Chief Economist

Download high-res chart

Recent Posts

  • Comparing Wage Growth for Job Stayers and Job Switchers
  • Another Chance to Position Portfolios for Tariff Turmoil?
  • Different Retirement Systems in Europe
  • AI Bubble Today Is Bigger Than the IT Bubble in the 1990s
  • 75% of Restaurant Orders Are Delivery Orders

Recent Comments

No comments to show.

Archives

  • July 2025
  • June 2025
  • May 2025
  • April 2025
  • March 2025
  • February 2025
  • January 2025
  • December 2024
  • November 2024
  • October 2024
  • September 2024
  • August 2024
  • July 2024
  • June 2024
  • May 2024
  • April 2024
  • March 2024
  • February 2024
  • January 2024
  • December 2023
  • November 2023
  • October 2023
  • September 2023
  • August 2023
  • July 2023
  • June 2023
  • May 2023
  • April 2023
  • March 2023
  • February 2023
  • January 2023
  • December 2022
  • November 2022
  • October 2022
  • September 2022
  • August 2022
  • July 2022
  • June 2022
  • May 2022
  • April 2022
  • March 2022
  • February 2022
  • January 2022
  • December 2021
  • November 2021

Categories

  • Apollo Answers
  • Course Introductions
  • Economic Intelligence
  • Hide from Wordpress Search
  • Investment Knowledge
  • Perspectives
  • Redirecting
  • The Daily Spark
  • The View from Apollo
  • The Weekly Brief
  • Uncategorized
  • White Papers

Housing Slowing Down

Weekly data for homebuilder traffic points to a weak spring selling season, driven by mortgage rates near 7%, record-low consumer confidence, and a rising inventory of homes for sale, see chart below.

The 2025 spring selling season is weaker than in previous years
Sources: Zonda, Apollo Chief Economist

Download high-res chart

Recent Posts

  • Comparing Wage Growth for Job Stayers and Job Switchers
  • Another Chance to Position Portfolios for Tariff Turmoil?
  • Different Retirement Systems in Europe
  • AI Bubble Today Is Bigger Than the IT Bubble in the 1990s
  • 75% of Restaurant Orders Are Delivery Orders

Recent Comments

No comments to show.

Archives

  • July 2025
  • June 2025
  • May 2025
  • April 2025
  • March 2025
  • February 2025
  • January 2025
  • December 2024
  • November 2024
  • October 2024
  • September 2024
  • August 2024
  • July 2024
  • June 2024
  • May 2024
  • April 2024
  • March 2024
  • February 2024
  • January 2024
  • December 2023
  • November 2023
  • October 2023
  • September 2023
  • August 2023
  • July 2023
  • June 2023
  • May 2023
  • April 2023
  • March 2023
  • February 2023
  • January 2023
  • December 2022
  • November 2022
  • October 2022
  • September 2022
  • August 2022
  • July 2022
  • June 2022
  • May 2022
  • April 2022
  • March 2022
  • February 2022
  • January 2022
  • December 2021
  • November 2021

Categories

  • Apollo Answers
  • Course Introductions
  • Economic Intelligence
  • Hide from Wordpress Search
  • Investment Knowledge
  • Perspectives
  • Redirecting
  • The Daily Spark
  • The View from Apollo
  • The Weekly Brief
  • Uncategorized
  • White Papers

AI Bubble Fueled by Zero Interest Rates

When the Fed started raising interest rates in March 2022, the Magnificent 7 stopped hiring more workers, see chart below.

Why is the tech sector so vulnerable to higher interest rates? First, tech firms are priced to deliver cash flows far out in the future, which makes tech companies more vulnerable to changes in the discount rate. Second, tech firms often need to borrow to finance multi-year projects, which also makes them more vulnerable to higher interest rates. Third, when interest rates are high, general risk appetite among investors is low, as investors can generate higher returns in fixed income.

The bottom line is that the bubble in AI valuations was simply the result of a long period with zero interest rates.

With upward pressures on inflation coming from tariffs, deglobalization, and demographics, interest rates will remain high and continue to be a headwind to tech and growth for the coming years.

Growth in total employment in Apple, Microsoft, Alphabet, Amazon, Nvidia, Meta, and Tesla
Sources: Bloomberg, Apollo Chief Economist

Download high-res chart

Recent Posts

  • Comparing Wage Growth for Job Stayers and Job Switchers
  • Another Chance to Position Portfolios for Tariff Turmoil?
  • Different Retirement Systems in Europe
  • AI Bubble Today Is Bigger Than the IT Bubble in the 1990s
  • 75% of Restaurant Orders Are Delivery Orders

Recent Comments

No comments to show.

Archives

  • July 2025
  • June 2025
  • May 2025
  • April 2025
  • March 2025
  • February 2025
  • January 2025
  • December 2024
  • November 2024
  • October 2024
  • September 2024
  • August 2024
  • July 2024
  • June 2024
  • May 2024
  • April 2024
  • March 2024
  • February 2024
  • January 2024
  • December 2023
  • November 2023
  • October 2023
  • September 2023
  • August 2023
  • July 2023
  • June 2023
  • May 2023
  • April 2023
  • March 2023
  • February 2023
  • January 2023
  • December 2022
  • November 2022
  • October 2022
  • September 2022
  • August 2022
  • July 2022
  • June 2022
  • May 2022
  • April 2022
  • March 2022
  • February 2022
  • January 2022
  • December 2021
  • November 2021

Categories

  • Apollo Answers
  • Course Introductions
  • Economic Intelligence
  • Hide from Wordpress Search
  • Investment Knowledge
  • Perspectives
  • Redirecting
  • The Daily Spark
  • The View from Apollo
  • The Weekly Brief
  • Uncategorized
  • White Papers

Posts navigation

Page 1 Page 2 … Page 4 Next page→
  • Privacy Notice
  • Terms of Use
  • Forward-Looking Statements
Apollo
© Apollo Global Management, Inc. All Rights Reserved.

The Apollo Academy is for informational and educational purposes only and nothing contained herein should be taken as investment advice or a recommendation to enter into any transaction. They are not an invitation by or on behalf of Apollo to any person to buy or sell any security or to adopt any investment strategy, and shall not form the basis of, nor may it accompany nor form part of, any right or contract to buy or sell any security or to adopt any investment strategy. There is no guarantee that the views and opinions expressed in this website will come to pass. For additional information, please see the disclaimers included in each piece of content or the legal page of our website here.