• Apollo.com
  • Login
  • Register Now
light site-logo
  • The Academy
  • Upcoming Events
        • Upcoming Events

  • Learning Center
        • New & UpdatedAlternative Investing Course 2.0

        • Alternative Investing Essentials Part OnePrivate Equity, Venture Capital, Private Credit
        • Alternative Investing Essentials Part TwoReal Estate, Infrastructure, Digital Assets, Hedge Funds
        • Practical ConsiderationsAsset Allocation, Risk Considerations, Fund Structures, Fees
        • Introductory Videos

          View All Videos

        •  Recent Classes & Videos

        • • Mid-Year Outlook: At the Crossroads of Stagflation — What’s Next?
        • • Hybrid Investments: Flexible Structures for Volatile Times
        • • Private Credit Investing in Volatile Times
        • • Potential Implications of the Latest US Administration Policy Proposals
        • • Beyond 60/40: Private Assets in an Era of High Public Valuations
        • • Investment Grade Private Credit as a Core Fixed Income Allocation
        • View All Classes

  • Alternative Perspectives
        • Investment Knowledge
        • The View from Apollo
          • Investment Knowledge White Papers

            Mid-Year Outlook: At the Crossroads of Stagflation—What’s Next?

            June 23, 2025
          • The View From Apollo

            Mid-Year Outlook: At the Crossroads of Stagflation—What’s Next?

            June 27, 2025
          • Investment Knowledge White Papers

            The Continental Shift: Europe’s Private Credit Moment

            June 20, 2025
  • The Daily Spark
        • Read The Daily Spark Blog


        • Want it delivered daily to your inbox?
          • The Daily Spark

            Comparing Wage Growth for Job Stayers and Job Switchers

            July 18, 2025
          • The Daily Spark

            Different Retirement Systems in Europe

            July 17, 2025
          • The Daily Spark

            AI Bubble Today Is Bigger Than the IT Bubble in the 1990s

            July 16, 2025
  • Register for Apollo Academy: Alternative Investing Course
  • Login
  • About Apollo Academy
  • Upcoming Events
  • Learning Center
  • Alternative Perspectives
  • The Daily Spark
  • Register for Apollo Academy: Alternative Investing Course
  • Login
  • Alternative Investing Course 2.0
  • Mid-Year Outlook: At the Crossroads of Stagflation — What’s Next?
  • Hybrid Investments: Flexible Structures for Volatile Times
  • Private Credit Investing in Volatile Times
  • Potential Implications of the Latest US Administration Policy Proposals
  • Beyond 60/40: Private Assets in an Era of High Public Valuations
  • Investment Grade Private Credit as a Core Fixed Income Allocation
  • View All Classes
  • Introductory Videos
  • Alternative Investing Essentials Part One • Now Available On Demand
  • Alternative Investing Essentials Part Two • Now Available On Demand
  • Practical Considerations • Now Available On Demand
  • Investment Knowledge
  • The View from Apollo
Home November 2024

Inflation Is Low But Living Costs Are High

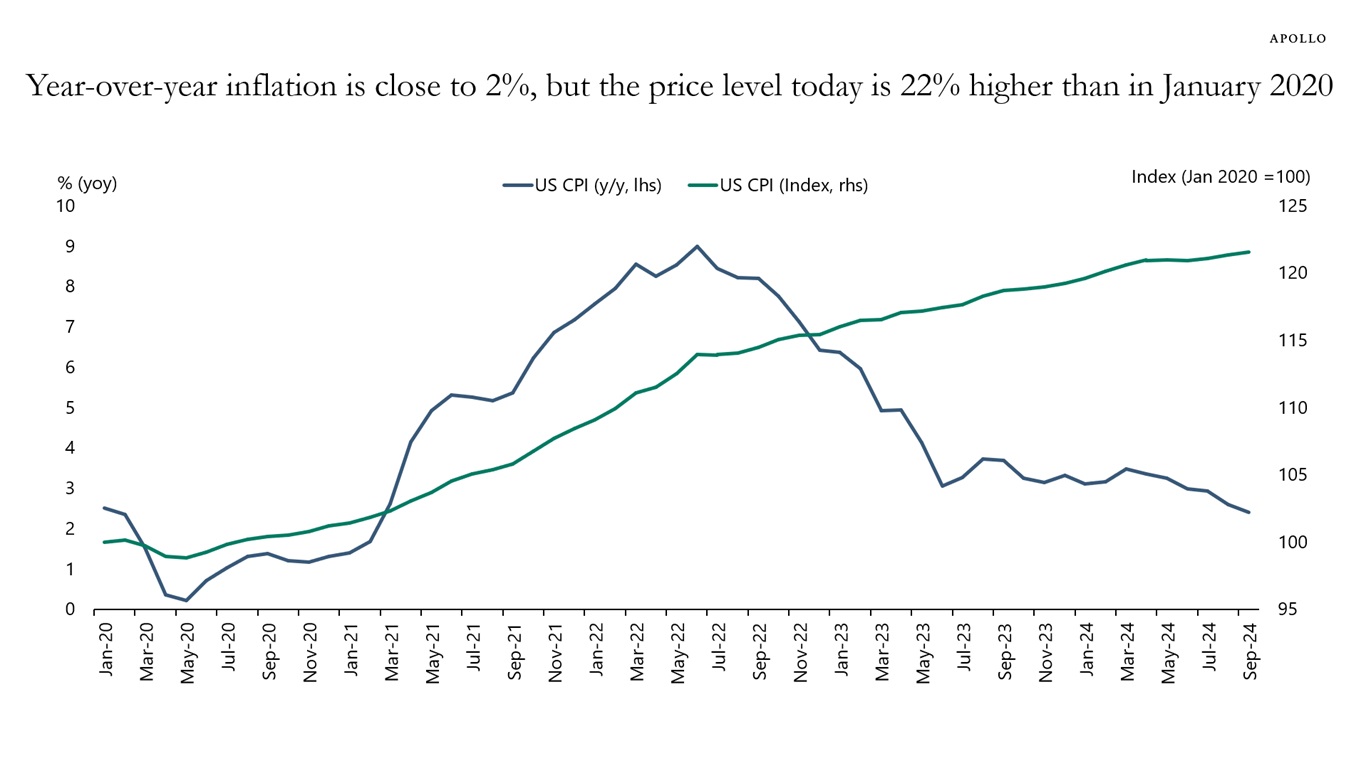
The Consumer Price Index is 22% higher than in January 2020, see chart below.

This means that the prices of all goods and services that consumers spend money on are up, on average, 22%.

For example, since January 2020, the price of cereal is 30% higher, household electricity is 32% higher, and car insurance is 52% higher.

The bottom line is that the Fed’s preferred measure of inflation, namely year-over-year inflation, may be back near 2%, but the living costs for households are still dramatically higher than four years ago.

Year-over-year inflation is close to 2%, but the price level today is 22% higher than in January 2020
Source: Bureau of Labor Statistics, Bloomberg, Apollo Chief Economist

Download high-res chart

Recent Posts

  • Comparing Wage Growth for Job Stayers and Job Switchers
  • Different Retirement Systems in Europe
  • AI Bubble Today Is Bigger Than the IT Bubble in the 1990s
  • 75% of Restaurant Orders Are Delivery Orders
  • Japan: Negative Population Growth = More Empty Homes

Recent Comments

No comments to show.

Archives

  • July 2025
  • June 2025
  • May 2025
  • April 2025
  • March 2025
  • February 2025
  • January 2025
  • December 2024
  • November 2024
  • October 2024
  • September 2024
  • August 2024
  • July 2024
  • June 2024
  • May 2024
  • April 2024
  • March 2024
  • February 2024
  • January 2024
  • December 2023
  • November 2023
  • October 2023
  • September 2023
  • August 2023
  • July 2023
  • June 2023
  • May 2023
  • April 2023
  • March 2023
  • February 2023
  • January 2023
  • December 2022
  • November 2022
  • October 2022
  • September 2022
  • August 2022
  • July 2022
  • June 2022
  • May 2022
  • April 2022
  • March 2022
  • February 2022
  • January 2022
  • December 2021
  • November 2021

Categories

  • Apollo Answers
  • Course Introductions
  • Economic Intelligence
  • Hide from Wordpress Search
  • Investment Knowledge
  • Perspectives
  • Redirecting
  • The Daily Spark
  • The View from Apollo
  • The Weekly Brief
  • Uncategorized
  • White Papers

Private Equity Dry Powder Declining

The amount of dry powder in global private equity has started to decline from the peak in 2023, see chart below.

Global private equity dry powder
Note: Data as of November 2024. Source: Preqin, Apollo Chief Economist

Download high-res chart

Recent Posts

  • Comparing Wage Growth for Job Stayers and Job Switchers
  • Different Retirement Systems in Europe
  • AI Bubble Today Is Bigger Than the IT Bubble in the 1990s
  • 75% of Restaurant Orders Are Delivery Orders
  • Japan: Negative Population Growth = More Empty Homes

Recent Comments

No comments to show.

Archives

  • July 2025
  • June 2025
  • May 2025
  • April 2025
  • March 2025
  • February 2025
  • January 2025
  • December 2024
  • November 2024
  • October 2024
  • September 2024
  • August 2024
  • July 2024
  • June 2024
  • May 2024
  • April 2024
  • March 2024
  • February 2024
  • January 2024
  • December 2023
  • November 2023
  • October 2023
  • September 2023
  • August 2023
  • July 2023
  • June 2023
  • May 2023
  • April 2023
  • March 2023
  • February 2023
  • January 2023
  • December 2022
  • November 2022
  • October 2022
  • September 2022
  • August 2022
  • July 2022
  • June 2022
  • May 2022
  • April 2022
  • March 2022
  • February 2022
  • January 2022
  • December 2021
  • November 2021

Categories

  • Apollo Answers
  • Course Introductions
  • Economic Intelligence
  • Hide from Wordpress Search
  • Investment Knowledge
  • Perspectives
  • Redirecting
  • The Daily Spark
  • The View from Apollo
  • The Weekly Brief
  • Uncategorized
  • White Papers

Retail Gas Prices Are Falling

Gas prices at the pump continue to decline, which is another tailwind to consumer spending, see chart below. The decline in oil prices is driven by significant supply and production in the US and lower growth in China.

Retail gas prices close to $3 a gallon
Source: AMA, Bloomberg, Apollo Chief Economist

Download high-res chart

Recent Posts

  • Comparing Wage Growth for Job Stayers and Job Switchers
  • Different Retirement Systems in Europe
  • AI Bubble Today Is Bigger Than the IT Bubble in the 1990s
  • 75% of Restaurant Orders Are Delivery Orders
  • Japan: Negative Population Growth = More Empty Homes

Recent Comments

No comments to show.

Archives

  • July 2025
  • June 2025
  • May 2025
  • April 2025
  • March 2025
  • February 2025
  • January 2025
  • December 2024
  • November 2024
  • October 2024
  • September 2024
  • August 2024
  • July 2024
  • June 2024
  • May 2024
  • April 2024
  • March 2024
  • February 2024
  • January 2024
  • December 2023
  • November 2023
  • October 2023
  • September 2023
  • August 2023
  • July 2023
  • June 2023
  • May 2023
  • April 2023
  • March 2023
  • February 2023
  • January 2023
  • December 2022
  • November 2022
  • October 2022
  • September 2022
  • August 2022
  • July 2022
  • June 2022
  • May 2022
  • April 2022
  • March 2022
  • February 2022
  • January 2022
  • December 2021
  • November 2021

Categories

  • Apollo Answers
  • Course Introductions
  • Economic Intelligence
  • Hide from Wordpress Search
  • Investment Knowledge
  • Perspectives
  • Redirecting
  • The Daily Spark
  • The View from Apollo
  • The Weekly Brief
  • Uncategorized
  • White Papers

Diverging Trends in CO2 Emissions

Total CO2 emissions from fossil fuels and industry in China are more than double the CO2 emissions in the US, see chart below, and six times bigger than CO2 emissions in Europe.

CO₂ emissions: China trending higher. US and Europe trending lower.
Note: t = metric tons. Source: OurWorldinData.org, Global Carbon Budget (2024), Apollo Chief Economist

Download high-res chart

Recent Posts

  • Comparing Wage Growth for Job Stayers and Job Switchers
  • Different Retirement Systems in Europe
  • AI Bubble Today Is Bigger Than the IT Bubble in the 1990s
  • 75% of Restaurant Orders Are Delivery Orders
  • Japan: Negative Population Growth = More Empty Homes

Recent Comments

No comments to show.

Archives

  • July 2025
  • June 2025
  • May 2025
  • April 2025
  • March 2025
  • February 2025
  • January 2025
  • December 2024
  • November 2024
  • October 2024
  • September 2024
  • August 2024
  • July 2024
  • June 2024
  • May 2024
  • April 2024
  • March 2024
  • February 2024
  • January 2024
  • December 2023
  • November 2023
  • October 2023
  • September 2023
  • August 2023
  • July 2023
  • June 2023
  • May 2023
  • April 2023
  • March 2023
  • February 2023
  • January 2023
  • December 2022
  • November 2022
  • October 2022
  • September 2022
  • August 2022
  • July 2022
  • June 2022
  • May 2022
  • April 2022
  • March 2022
  • February 2022
  • January 2022
  • December 2021
  • November 2021

Categories

  • Apollo Answers
  • Course Introductions
  • Economic Intelligence
  • Hide from Wordpress Search
  • Investment Knowledge
  • Perspectives
  • Redirecting
  • The Daily Spark
  • The View from Apollo
  • The Weekly Brief
  • Uncategorized
  • White Papers

US Housing Outlook

Our latest housing outlook is available here. Higher mortgage rates are weighing on demand, but the inventory of homes for sale remains very low, and housing demand is supported by solid wage growth, high stock prices, and high cash flows to owners of fixed income, including private credit.

10 facts about the US housing market
Source: Apollo Chief Economist

Download high-res chart book

Recent Posts

  • Comparing Wage Growth for Job Stayers and Job Switchers
  • Different Retirement Systems in Europe
  • AI Bubble Today Is Bigger Than the IT Bubble in the 1990s
  • 75% of Restaurant Orders Are Delivery Orders
  • Japan: Negative Population Growth = More Empty Homes

Recent Comments

No comments to show.

Archives

  • July 2025
  • June 2025
  • May 2025
  • April 2025
  • March 2025
  • February 2025
  • January 2025
  • December 2024
  • November 2024
  • October 2024
  • September 2024
  • August 2024
  • July 2024
  • June 2024
  • May 2024
  • April 2024
  • March 2024
  • February 2024
  • January 2024
  • December 2023
  • November 2023
  • October 2023
  • September 2023
  • August 2023
  • July 2023
  • June 2023
  • May 2023
  • April 2023
  • March 2023
  • February 2023
  • January 2023
  • December 2022
  • November 2022
  • October 2022
  • September 2022
  • August 2022
  • July 2022
  • June 2022
  • May 2022
  • April 2022
  • March 2022
  • February 2022
  • January 2022
  • December 2021
  • November 2021

Categories

  • Apollo Answers
  • Course Introductions
  • Economic Intelligence
  • Hide from Wordpress Search
  • Investment Knowledge
  • Perspectives
  • Redirecting
  • The Daily Spark
  • The View from Apollo
  • The Weekly Brief
  • Uncategorized
  • White Papers

Another Tailwind to Consumer Spending

As home prices continue to rise, more and more households are taking out HELOCs to finance consumer spending, see chart below.

In other words, homeowners are liquifying their home price gains and using the proceeds for consumption.

Combined with low jobless claims, strong wage growth, high stock prices, and solid cash flows from fixed income, including private credit, the US consumer continues to do well.

Home equity lines of credit (HELOC) balances have increased
Source: New York Fed Consumer Credit Panel/Equifax, Apollo Chief Economist

Download high-res chart

Recent Posts

  • Comparing Wage Growth for Job Stayers and Job Switchers
  • Different Retirement Systems in Europe
  • AI Bubble Today Is Bigger Than the IT Bubble in the 1990s
  • 75% of Restaurant Orders Are Delivery Orders
  • Japan: Negative Population Growth = More Empty Homes

Recent Comments

No comments to show.

Archives

  • July 2025
  • June 2025
  • May 2025
  • April 2025
  • March 2025
  • February 2025
  • January 2025
  • December 2024
  • November 2024
  • October 2024
  • September 2024
  • August 2024
  • July 2024
  • June 2024
  • May 2024
  • April 2024
  • March 2024
  • February 2024
  • January 2024
  • December 2023
  • November 2023
  • October 2023
  • September 2023
  • August 2023
  • July 2023
  • June 2023
  • May 2023
  • April 2023
  • March 2023
  • February 2023
  • January 2023
  • December 2022
  • November 2022
  • October 2022
  • September 2022
  • August 2022
  • July 2022
  • June 2022
  • May 2022
  • April 2022
  • March 2022
  • February 2022
  • January 2022
  • December 2021
  • November 2021

Categories

  • Apollo Answers
  • Course Introductions
  • Economic Intelligence
  • Hide from Wordpress Search
  • Investment Knowledge
  • Perspectives
  • Redirecting
  • The Daily Spark
  • The View from Apollo
  • The Weekly Brief
  • Uncategorized
  • White Papers

Stocks Are Expensive

When growth is strong, corporate earnings are high. When growth is weak, corporate earnings are low. This makes it difficult to find out if companies are cheap or expensive.

One way to analyze if stocks are cheap or expensive is to remove the business cycle by taking the 10-year average of earnings, and doing so shows that stocks are very expensive at the moment.

Specifically, the cyclically adjusted price earnings ratio at 38 is near all-time highs, significantly above its long-term average at 17, see chart below.

Cyclically adjusted price earnings ratio at near-record-high levels
Source: Robert J. Shiller, Apollo Chief Economist

Download high-res chart

Recent Posts

  • Comparing Wage Growth for Job Stayers and Job Switchers
  • Different Retirement Systems in Europe
  • AI Bubble Today Is Bigger Than the IT Bubble in the 1990s
  • 75% of Restaurant Orders Are Delivery Orders
  • Japan: Negative Population Growth = More Empty Homes

Recent Comments

No comments to show.

Archives

  • July 2025
  • June 2025
  • May 2025
  • April 2025
  • March 2025
  • February 2025
  • January 2025
  • December 2024
  • November 2024
  • October 2024
  • September 2024
  • August 2024
  • July 2024
  • June 2024
  • May 2024
  • April 2024
  • March 2024
  • February 2024
  • January 2024
  • December 2023
  • November 2023
  • October 2023
  • September 2023
  • August 2023
  • July 2023
  • June 2023
  • May 2023
  • April 2023
  • March 2023
  • February 2023
  • January 2023
  • December 2022
  • November 2022
  • October 2022
  • September 2022
  • August 2022
  • July 2022
  • June 2022
  • May 2022
  • April 2022
  • March 2022
  • February 2022
  • January 2022
  • December 2021
  • November 2021

Categories

  • Apollo Answers
  • Course Introductions
  • Economic Intelligence
  • Hide from Wordpress Search
  • Investment Knowledge
  • Perspectives
  • Redirecting
  • The Daily Spark
  • The View from Apollo
  • The Weekly Brief
  • Uncategorized
  • White Papers

US Households Have Never Been More Bullish on Equities

The Conference Board asks US households about their outlook for the stock market, and a record high of 51.4% say that stock prices will move higher, see chart below.

Our chart book with daily and weekly indicators for the US economy is available here.

A record high 51.4% of Americans think stock prices will move higher
Source: Conference Board, Haver Analytics, Apollo Chief Economist

Download high-res chart book

Recent Posts

  • Comparing Wage Growth for Job Stayers and Job Switchers
  • Different Retirement Systems in Europe
  • AI Bubble Today Is Bigger Than the IT Bubble in the 1990s
  • 75% of Restaurant Orders Are Delivery Orders
  • Japan: Negative Population Growth = More Empty Homes

Recent Comments

No comments to show.

Archives

  • July 2025
  • June 2025
  • May 2025
  • April 2025
  • March 2025
  • February 2025
  • January 2025
  • December 2024
  • November 2024
  • October 2024
  • September 2024
  • August 2024
  • July 2024
  • June 2024
  • May 2024
  • April 2024
  • March 2024
  • February 2024
  • January 2024
  • December 2023
  • November 2023
  • October 2023
  • September 2023
  • August 2023
  • July 2023
  • June 2023
  • May 2023
  • April 2023
  • March 2023
  • February 2023
  • January 2023
  • December 2022
  • November 2022
  • October 2022
  • September 2022
  • August 2022
  • July 2022
  • June 2022
  • May 2022
  • April 2022
  • March 2022
  • February 2022
  • January 2022
  • December 2021
  • November 2021

Categories

  • Apollo Answers
  • Course Introductions
  • Economic Intelligence
  • Hide from Wordpress Search
  • Investment Knowledge
  • Perspectives
  • Redirecting
  • The Daily Spark
  • The View from Apollo
  • The Weekly Brief
  • Uncategorized
  • White Papers

The Impact of Passive Investing

The rise of passive investing has had a significant impact on financial markets in the last three decades, especially on its contribution to higher asset-price volatility, reduced liquidity, and possible contribution to heightened market concentration. By analyzing the substantial shift of assets from active to passive strategies—particularly through the growth of ETFs and retirement-savings plans, such as a 401(k)—this paper illustrates how passive investors, who primarily track major indices, have contributed to reduced price elasticity and market responsiveness, which, in turn, have led to amplified price movements, decreased liquidity, potential macroeconomic inefficiencies, and a disproportionate concentration of market influence in a few dominant stocks, such as the Magnificent Seven.

Active funds have lagged respective benchmarks
Source: Morningstar, Apollo Chief Economist

Download paper

Recent Posts

  • Comparing Wage Growth for Job Stayers and Job Switchers
  • Different Retirement Systems in Europe
  • AI Bubble Today Is Bigger Than the IT Bubble in the 1990s
  • 75% of Restaurant Orders Are Delivery Orders
  • Japan: Negative Population Growth = More Empty Homes

Recent Comments

No comments to show.

Archives

  • July 2025
  • June 2025
  • May 2025
  • April 2025
  • March 2025
  • February 2025
  • January 2025
  • December 2024
  • November 2024
  • October 2024
  • September 2024
  • August 2024
  • July 2024
  • June 2024
  • May 2024
  • April 2024
  • March 2024
  • February 2024
  • January 2024
  • December 2023
  • November 2023
  • October 2023
  • September 2023
  • August 2023
  • July 2023
  • June 2023
  • May 2023
  • April 2023
  • March 2023
  • February 2023
  • January 2023
  • December 2022
  • November 2022
  • October 2022
  • September 2022
  • August 2022
  • July 2022
  • June 2022
  • May 2022
  • April 2022
  • March 2022
  • February 2022
  • January 2022
  • December 2021
  • November 2021

Categories

  • Apollo Answers
  • Course Introductions
  • Economic Intelligence
  • Hide from Wordpress Search
  • Investment Knowledge
  • Perspectives
  • Redirecting
  • The Daily Spark
  • The View from Apollo
  • The Weekly Brief
  • Uncategorized
  • White Papers

Fed Cuts Boosting M&A and IPOs

Fed cuts, tight credit spreads, and higher animal spirits will boost M&A and IPO activity over the coming quarters, see charts below.

Fed cuts will boost IPO activity
Note: IPO as of announced date. Source: Bloomberg, Apollo Chief Economist
Fed cuts will boost M&A transactions
Note: M&A announced transactions, US/Europe, is the daily sum of mergers, acquisitions, divestitures, self-tenders and spin-offs announced involving either a US/Europe target or acquirer. Source: Bloomberg, Apollo Chief Economist

Download high-res charts

Recent Posts

  • Comparing Wage Growth for Job Stayers and Job Switchers
  • Different Retirement Systems in Europe
  • AI Bubble Today Is Bigger Than the IT Bubble in the 1990s
  • 75% of Restaurant Orders Are Delivery Orders
  • Japan: Negative Population Growth = More Empty Homes

Recent Comments

No comments to show.

Archives

  • July 2025
  • June 2025
  • May 2025
  • April 2025
  • March 2025
  • February 2025
  • January 2025
  • December 2024
  • November 2024
  • October 2024
  • September 2024
  • August 2024
  • July 2024
  • June 2024
  • May 2024
  • April 2024
  • March 2024
  • February 2024
  • January 2024
  • December 2023
  • November 2023
  • October 2023
  • September 2023
  • August 2023
  • July 2023
  • June 2023
  • May 2023
  • April 2023
  • March 2023
  • February 2023
  • January 2023
  • December 2022
  • November 2022
  • October 2022
  • September 2022
  • August 2022
  • July 2022
  • June 2022
  • May 2022
  • April 2022
  • March 2022
  • February 2022
  • January 2022
  • December 2021
  • November 2021

Categories

  • Apollo Answers
  • Course Introductions
  • Economic Intelligence
  • Hide from Wordpress Search
  • Investment Knowledge
  • Perspectives
  • Redirecting
  • The Daily Spark
  • The View from Apollo
  • The Weekly Brief
  • Uncategorized
  • White Papers

Posts navigation

Page 1 Page 2 … Page 4 Next page→
  • Privacy Notice
  • Terms of Use
  • Forward-Looking Statements
Apollo
© Apollo Global Management, Inc. All Rights Reserved.

The Apollo Academy is for informational and educational purposes only and nothing contained herein should be taken as investment advice or a recommendation to enter into any transaction. They are not an invitation by or on behalf of Apollo to any person to buy or sell any security or to adopt any investment strategy, and shall not form the basis of, nor may it accompany nor form part of, any right or contract to buy or sell any security or to adopt any investment strategy. There is no guarantee that the views and opinions expressed in this website will come to pass. For additional information, please see the disclaimers included in each piece of content or the legal page of our website here.