• Apollo.com
  • Login
  • Register Now
light site-logo
  • The Academy
  • Upcoming Events
        • Upcoming Events

  • Learning Center
        • New & UpdatedAlternative Investing Course 2.0

        • Alternative Investing Essentials Part OnePrivate Equity, Venture Capital, Private Credit
        • Alternative Investing Essentials Part TwoReal Estate, Infrastructure, Digital Assets, Hedge Funds
        • Practical ConsiderationsAsset Allocation, Risk Considerations, Fund Structures, Fees
        • Introductory Videos

          View All Videos

        •  Recent Classes & Videos

        • • Mid-Year Outlook: At the Crossroads of Stagflation — What’s Next?
        • • Hybrid Investments: Flexible Structures for Volatile Times
        • • Private Credit Investing in Volatile Times
        • • Potential Implications of the Latest US Administration Policy Proposals
        • • Beyond 60/40: Private Assets in an Era of High Public Valuations
        • • Investment Grade Private Credit as a Core Fixed Income Allocation
        • View All Classes

  • Alternative Perspectives
        • Investment Knowledge
        • The View from Apollo
          • Investment Knowledge White Papers

            Mid-Year Outlook: At the Crossroads of Stagflation—What’s Next?

            June 23, 2025
          • The View From Apollo

            Mid-Year Outlook: At the Crossroads of Stagflation—What’s Next?

            June 27, 2025
          • Investment Knowledge White Papers

            The Continental Shift: Europe’s Private Credit Moment

            June 20, 2025
  • The Daily Spark
        • Read The Daily Spark Blog


        • Want it delivered daily to your inbox?
          • The Daily Spark

            Comparing Wage Growth for Job Stayers and Job Switchers

            July 18, 2025
          • The Daily Spark

            Different Retirement Systems in Europe

            July 17, 2025
          • The Daily Spark

            AI Bubble Today Is Bigger Than the IT Bubble in the 1990s

            July 16, 2025
  • Register for Apollo Academy: Alternative Investing Course
  • Login
  • About Apollo Academy
  • Upcoming Events
  • Learning Center
  • Alternative Perspectives
  • The Daily Spark
  • Register for Apollo Academy: Alternative Investing Course
  • Login
  • Alternative Investing Course 2.0
  • Mid-Year Outlook: At the Crossroads of Stagflation — What’s Next?
  • Hybrid Investments: Flexible Structures for Volatile Times
  • Private Credit Investing in Volatile Times
  • Potential Implications of the Latest US Administration Policy Proposals
  • Beyond 60/40: Private Assets in an Era of High Public Valuations
  • Investment Grade Private Credit as a Core Fixed Income Allocation
  • View All Classes
  • Introductory Videos
  • Alternative Investing Essentials Part One • Now Available On Demand
  • Alternative Investing Essentials Part Two • Now Available On Demand
  • Practical Considerations • Now Available On Demand
  • Investment Knowledge
  • The View from Apollo
Home December 2023

A Second Mountain in Inflation?

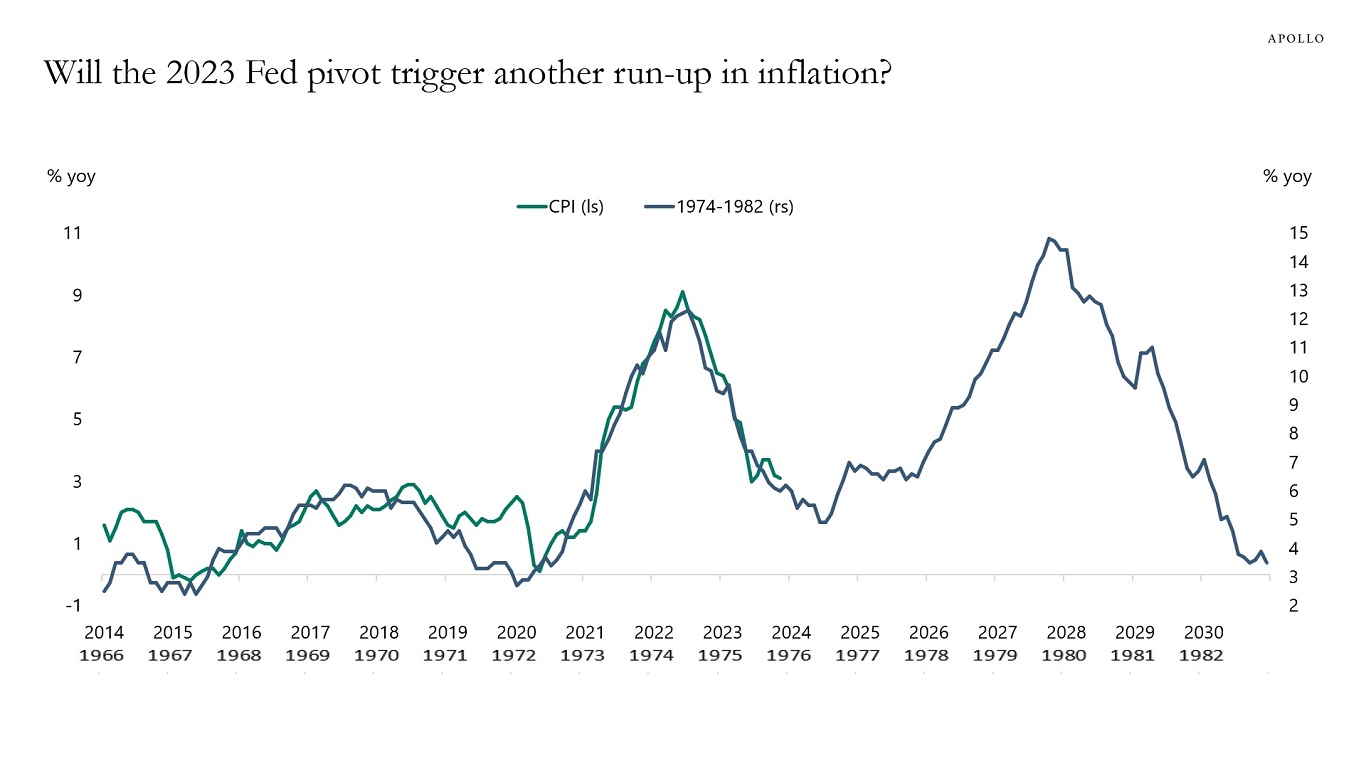
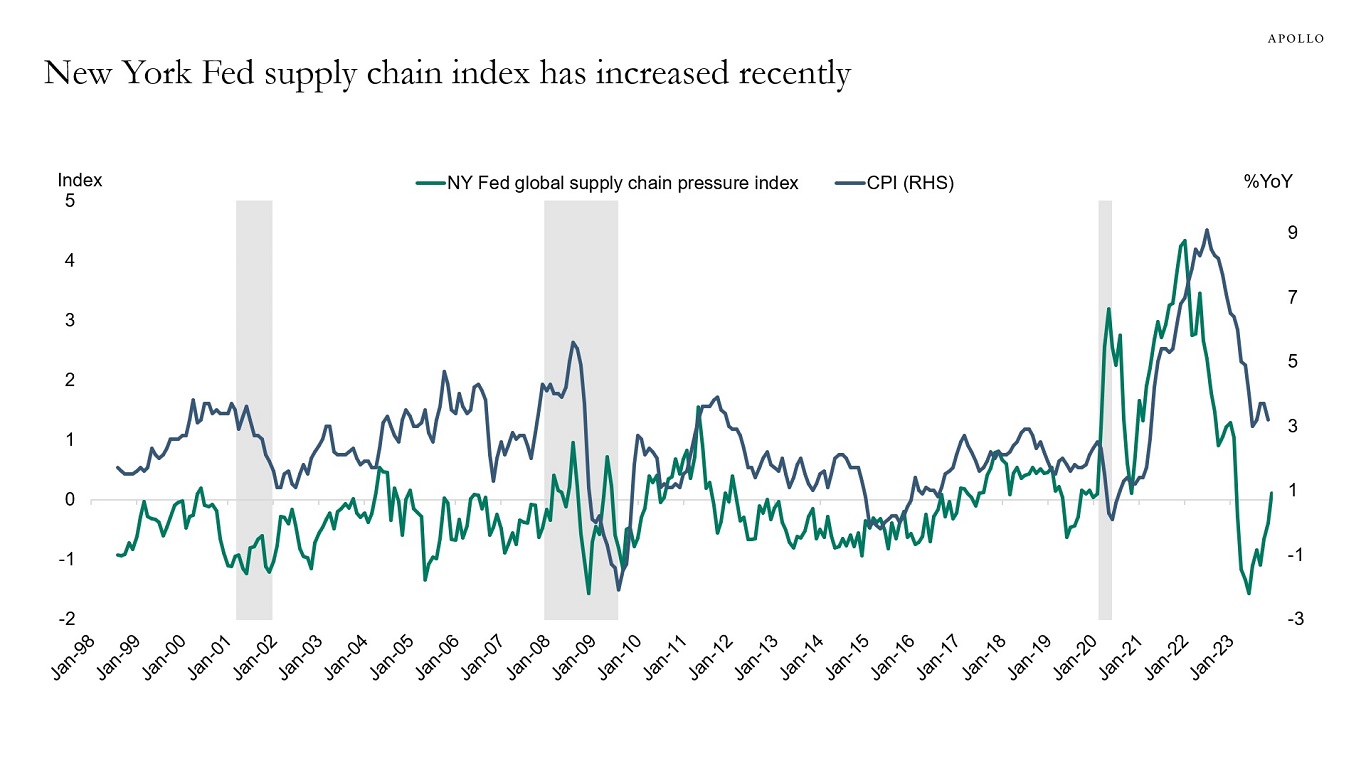
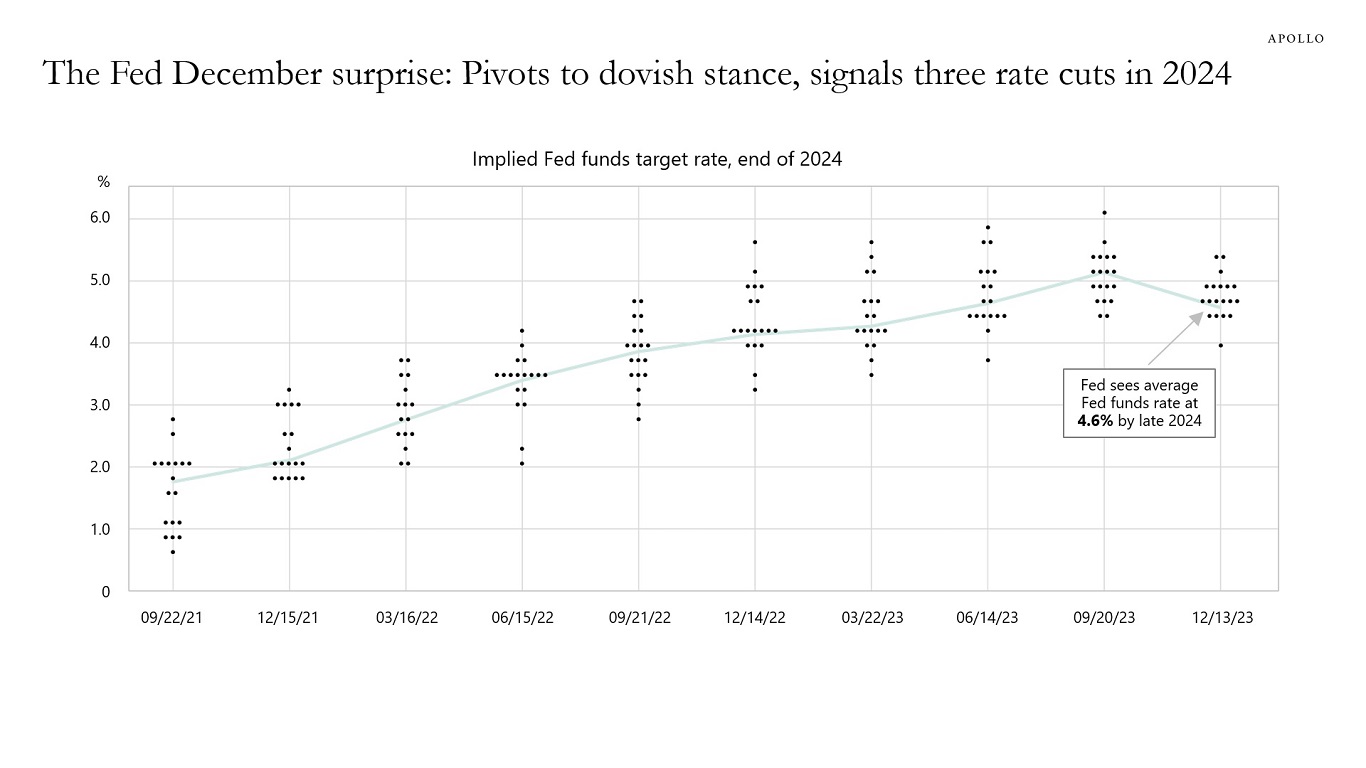
With the Fed worrying less about inflation and more about growth, the risks are rising that easier financial conditions triggered by the Fed’s pivot could start another rise in inflation driven by higher prices on housing, labor, services, and goods, see chart below.

Will the 2023 Fed pivot trigger another run-up in inflation?
Source: BLS, Haver Analytics, Apollo Chief Economist

Download hi-res chart(s)

Recent Posts

  • Comparing Wage Growth for Job Stayers and Job Switchers
  • Different Retirement Systems in Europe
  • AI Bubble Today Is Bigger Than the IT Bubble in the 1990s
  • 75% of Restaurant Orders Are Delivery Orders
  • Japan: Negative Population Growth = More Empty Homes

Recent Comments

No comments to show.

Archives

  • July 2025
  • June 2025
  • May 2025
  • April 2025
  • March 2025
  • February 2025
  • January 2025
  • December 2024
  • November 2024
  • October 2024
  • September 2024
  • August 2024
  • July 2024
  • June 2024
  • May 2024
  • April 2024
  • March 2024
  • February 2024
  • January 2024
  • December 2023
  • November 2023
  • October 2023
  • September 2023
  • August 2023
  • July 2023
  • June 2023
  • May 2023
  • April 2023
  • March 2023
  • February 2023
  • January 2023
  • December 2022
  • November 2022
  • October 2022
  • September 2022
  • August 2022
  • July 2022
  • June 2022
  • May 2022
  • April 2022
  • March 2022
  • February 2022
  • January 2022
  • December 2021
  • November 2021

Categories

  • Apollo Answers
  • Course Introductions
  • Economic Intelligence
  • Hide from Wordpress Search
  • Investment Knowledge
  • Perspectives
  • Redirecting
  • The Daily Spark
  • The View from Apollo
  • The Weekly Brief
  • Uncategorized
  • White Papers

New White Paper: 2024 Outlook: What’s Next After the “Fed Pivot”?

The “Fed pivot” on December 13 to a dovish stance underscored the rapidly shifting outlook for both growth and inflation. Markets have reacted in kind. But the bottom line is that going into 2024, we still see upside risks to inflation, downside risks to growth, and expect rates to stay higher and for longer than the rest of the market does.

We published our consolidated views in my newest white paper, 2024 Economic and Capital Markets Outlook: What’s Next After the “Fed Pivot”? You can download it here.

I will also be discussing the contents of the paper and my views in detail in an Apollo Academy class today, Dec. 20, at 11:00 ET (eligible for a CE credit). Register here.

Recent Posts

  • Comparing Wage Growth for Job Stayers and Job Switchers
  • Different Retirement Systems in Europe
  • AI Bubble Today Is Bigger Than the IT Bubble in the 1990s
  • 75% of Restaurant Orders Are Delivery Orders
  • Japan: Negative Population Growth = More Empty Homes

Recent Comments

No comments to show.

Archives

  • July 2025
  • June 2025
  • May 2025
  • April 2025
  • March 2025
  • February 2025
  • January 2025
  • December 2024
  • November 2024
  • October 2024
  • September 2024
  • August 2024
  • July 2024
  • June 2024
  • May 2024
  • April 2024
  • March 2024
  • February 2024
  • January 2024
  • December 2023
  • November 2023
  • October 2023
  • September 2023
  • August 2023
  • July 2023
  • June 2023
  • May 2023
  • April 2023
  • March 2023
  • February 2023
  • January 2023
  • December 2022
  • November 2022
  • October 2022
  • September 2022
  • August 2022
  • July 2022
  • June 2022
  • May 2022
  • April 2022
  • March 2022
  • February 2022
  • January 2022
  • December 2021
  • November 2021

Categories

  • Apollo Answers
  • Course Introductions
  • Economic Intelligence
  • Hide from Wordpress Search
  • Investment Knowledge
  • Perspectives
  • Redirecting
  • The Daily Spark
  • The View from Apollo
  • The Weekly Brief
  • Uncategorized
  • White Papers

2024 Outlook: What’s Next After the “Fed Pivot”?

The “Fed pivot” in December to a dovish stance underscores the rapidly shifting outlook for both growth and inflation. Going into 2024, we still see upside risks to inflation, downside risks to growth, and expect rates to stay higher and for longer than the rest of the market does. In this paper and on-demand class, Chief Economist Torsten Sløk will discuss the implications for corporate growth, banking, consumer spending, and financial markets.

DOWNLOAD THE PAPER
WATCH THE CLASS

Key Takeaways

  • The members of the Federal Reserve Open Market Committee (FOMC) “pivoted” to a more dovish stance in their last meeting of the year on December 13, holding rates steady and signaling that the inflation outlook has improved more quickly than anticipated. They also suggested three potential rate cuts in 2024.
    • The “Fed pivot” underscores the rapidly shifting outlook for both growth and inflation. Going into the new year, we still see upside risks to inflation and downside risks to growth. Because:
    • Despite signaled Fed rate cuts in 2024, we expect interest rates to stay higher and for longer than the rest of the market does. We arrive at our thesis through a combination of cyclical and secular drivers, including still-tight Federal Reserve monetary policy, higher borrowing needs by the US Treasury, the loosening of yield-curve control policy in Japan, and reduced buying and diminished inventory of US debt held by China and others.
    • Two major factors driving consumer spending are largely unrelated to current Fed policy: Households are running out of excess savings and student-loan payments are restarting. The combination of these two dynamics increases the odds of a meaningful slowdown in consumer expenditures, a key driver of US growth.
    • We see many signs that the Fed’s rate hikes are working to cool off the economy. Consumers are already feeling the pinch, with increased delinquencies in both credit-card debt and auto loans. Similarly, a corporate default cycle has started, and employment is beginning to soften. Finally, bank-loan growth has been slowing sharply in recent months.
    • Despite the Fed’s aggressive tightening campaign, inflation remains above the central bank’s 2% annual target. We’ve long argued that rates will stay higher and for longer than the market expects. But, if above-target inflation persists, they may go higher yet.
    • All that said, we do not entirely discount the possibility of upside economic surprise. This idiosyncratic economy has defied consensus predictions for some time now, and it may continue to do so. A soft landing is not out of the question.
  • The implications for capital markets?
    • We believe private credit offers an attractive opportunity today given higher yields in general and on senior secured debt in particular—allowing investors to boost income generation in their portfolios with downside protection.
    • Opportunities in private equity are likely to continue to emerge among potential distressed companies that come along with the combination of slowing growth and high rates. Moreover, we see opportunities in assets that can offer some level of inflation protection, such as infrastructure.
    • In real assets, particularly real estate, we see more compelling risk-adjusted return opportunities in credit than in equity at this stage of the economic cycle.
    • Public equities are as unappealing as they have been in 20 years due to stretched valuations. Public bonds—with risk-free yields on 10-year Treasuries hovering around 4.0% as of this writing—appear attractive to investors interested in “locking” higher rates in their fixed-income portfolios. That said, attention to duration risk remains warranted.
DOWNLOAD THE PAPER
WATCH THE CLASS

The information herein is provided for educational purposes only and should not be construed as financial or investment advice, nor should any information in this document be relied on when making an investment decision. Opinions and views expressed reflect the current opinions and views of the authors and Apollo Analysts as of the date hereof and are subject to change. Please see the end of this document for important disclosure information.


Important Disclosure Information

This presentation is for educational purposes only and should not be treated as research. This presentation may not be distributed, transmitted or otherwise communicated to others, in whole or in part, without the express written consent of Apollo Global Management, Inc. (together with its subsidiaries, “Apollo”).

The views and opinions expressed in this presentation are the views and opinions of the author(s) of the White Paper. They do not necessarily reflect the views and opinions of Apollo and are subject to change at any time without notice. Further, Apollo and its affiliates may have positions (long or short) or engage in securities transactions that are not consistent with the information and views expressed in this presentation. There can be no assurance that an investment strategy will be successful. Historic market trends are not reliable indicators of actual future market behavior or future performance of any particular investment which may differ materially, and should not be relied upon as such. Target allocations contained herein are subject to change. There is no assurance that the target allocations will be achieved, and actual allocations may be significantly different than that shown here. This presentation does not constitute an offer of any service or product of Apollo. It is not an invitation by or on behalf of Apollo to any person to buy or sell any security or to adopt any investment strategy, and shall not form the basis of, nor may it accompany nor form part of, any right or contract to buy or sell any security or to adopt any investment strategy. Nothing herein should be taken as investment advice or a recommendation to enter into any transaction.

Hyperlinks to third-party websites in this presentation are provided for reader convenience only. There can be no assurance that any trends discussed herein will continue. Unless otherwise noted, information included herein is presented as of the dates indicated. This presentation is not complete and the information contained herein may change at any time without notice. Apollo does not have any responsibility to update the presentation to account for such changes. Apollo has not made any representation or warranty, expressed or implied, with respect to fairness, correctness, accuracy, reasonableness, or completeness of any of the information contained herein, and expressly disclaims any responsibility or liability therefore. The information contained herein is not intended to provide, and should not be relied upon for, accounting, legal or tax advice or investment recommendations. Investors should make an independent investigation of the information contained herein, including consulting their tax, legal, accounting or other advisors about such information. Apollo does not act for you and is not responsible for providing you with the protections afforded to its clients.

Certain information contained herein may be “forward-looking” in nature. Due to various risks and uncertainties, actual events or results may differ materially from those reflected or contemplated in such forward-looking information. As such, undue reliance should not be placed on such information. Forward-looking statements may be identified by the use of terminology including, but not limited to, “may”, “will”, “should”, “expect”, “anticipate”, “target”, “project”, “estimate”, “intend”, “continue” or “believe” or the negatives thereof or other variations thereon or comparable terminology.

The Standard & Poor’s 500 (“S&P 500”) Index is a market-capitalization-weighted index of the 500 largest U.S. publicly traded companies by market value.

Additional information may be available upon request.

Recent Posts

  • Comparing Wage Growth for Job Stayers and Job Switchers
  • Different Retirement Systems in Europe
  • AI Bubble Today Is Bigger Than the IT Bubble in the 1990s
  • 75% of Restaurant Orders Are Delivery Orders
  • Japan: Negative Population Growth = More Empty Homes

Recent Comments

No comments to show.

Archives

  • July 2025
  • June 2025
  • May 2025
  • April 2025
  • March 2025
  • February 2025
  • January 2025
  • December 2024
  • November 2024
  • October 2024
  • September 2024
  • August 2024
  • July 2024
  • June 2024
  • May 2024
  • April 2024
  • March 2024
  • February 2024
  • January 2024
  • December 2023
  • November 2023
  • October 2023
  • September 2023
  • August 2023
  • July 2023
  • June 2023
  • May 2023
  • April 2023
  • March 2023
  • February 2023
  • January 2023
  • December 2022
  • November 2022
  • October 2022
  • September 2022
  • August 2022
  • July 2022
  • June 2022
  • May 2022
  • April 2022
  • March 2022
  • February 2022
  • January 2022
  • December 2021
  • November 2021

Categories

  • Apollo Answers
  • Course Introductions
  • Economic Intelligence
  • Hide from Wordpress Search
  • Investment Knowledge
  • Perspectives
  • Redirecting
  • The Daily Spark
  • The View from Apollo
  • The Weekly Brief
  • Uncategorized
  • White Papers

Fed Pivot Pushing the US Economy Back to No Landing Scenario

Last week, the Fed went from expecting another 25-basis point hike to now expecting 75-basis point cuts in 2024, and the chart below quantifies the impact of this 100-basis point pivot on the economy. At the same time, the market now expects 150 basis points in Fed cuts in 2024, and 10-year interest rates have declined by 100 basis points since they peaked at 5% in October.

The Fed pivot combined with a one standard deviation decline in VIX, a 60-basis point tightening in IG spreads since March, and a $20 decrease in oil prices since September will boost GDP growth by 1.5% over the coming quarters, see chart below.

The CBO estimates that potential growth in the US is 2%, so a 1.5% boost to GDP is significant. Stronger GDP growth will boost demand for housing, labor, airlines, hotels, restaurants, and goods, which ultimately will put renewed upward pressure on inflation.

The conclusion for markets is that the Fed pivot last week complicates the Fed’s goal of getting inflation back to 2%, and as we enter 2024, the pendulum will soon swing back from a dovish Fed to a more hawkish Fed.

The impact of the Fed pivot on GDP growth
Source: Bloomberg SHOK, Apollo Chief Economist. Note: $20 oil price decline, 60bps tighter IG spreads, 1std decline in VIX, and 100bps lower rates via changed Fed forward guidance.

Download hi-res chart(s)

Recent Posts

  • Comparing Wage Growth for Job Stayers and Job Switchers
  • Different Retirement Systems in Europe
  • AI Bubble Today Is Bigger Than the IT Bubble in the 1990s
  • 75% of Restaurant Orders Are Delivery Orders
  • Japan: Negative Population Growth = More Empty Homes

Recent Comments

No comments to show.

Archives

  • July 2025
  • June 2025
  • May 2025
  • April 2025
  • March 2025
  • February 2025
  • January 2025
  • December 2024
  • November 2024
  • October 2024
  • September 2024
  • August 2024
  • July 2024
  • June 2024
  • May 2024
  • April 2024
  • March 2024
  • February 2024
  • January 2024
  • December 2023
  • November 2023
  • October 2023
  • September 2023
  • August 2023
  • July 2023
  • June 2023
  • May 2023
  • April 2023
  • March 2023
  • February 2023
  • January 2023
  • December 2022
  • November 2022
  • October 2022
  • September 2022
  • August 2022
  • July 2022
  • June 2022
  • May 2022
  • April 2022
  • March 2022
  • February 2022
  • January 2022
  • December 2021
  • November 2021

Categories

  • Apollo Answers
  • Course Introductions
  • Economic Intelligence
  • Hide from Wordpress Search
  • Investment Knowledge
  • Perspectives
  • Redirecting
  • The Daily Spark
  • The View from Apollo
  • The Weekly Brief
  • Uncategorized
  • White Papers

Supply Chains Back to Normal

All supply chain indicators are now back near 2019 levels, see charts below and in this chart book.

The price of transporting a container from China is back at pre-pandemic levels
Source: Freightos, Bloomberg, Apollo Chief Economist
Container freight rates from China
Source: WCI, Bloomberg, Apollo Chief Economist
Baltic Exchange indexes have increased in recent weeks
Source: Bloomberg, Apollo Chief Economist
New York Fed supply chain index has increased recently
Source: NY Fed, BLS, Haver Analytics, Apollo Chief Economist

Download hi-res chart(s)

Recent Posts

  • Comparing Wage Growth for Job Stayers and Job Switchers
  • Different Retirement Systems in Europe
  • AI Bubble Today Is Bigger Than the IT Bubble in the 1990s
  • 75% of Restaurant Orders Are Delivery Orders
  • Japan: Negative Population Growth = More Empty Homes

Recent Comments

No comments to show.

Archives

  • July 2025
  • June 2025
  • May 2025
  • April 2025
  • March 2025
  • February 2025
  • January 2025
  • December 2024
  • November 2024
  • October 2024
  • September 2024
  • August 2024
  • July 2024
  • June 2024
  • May 2024
  • April 2024
  • March 2024
  • February 2024
  • January 2024
  • December 2023
  • November 2023
  • October 2023
  • September 2023
  • August 2023
  • July 2023
  • June 2023
  • May 2023
  • April 2023
  • March 2023
  • February 2023
  • January 2023
  • December 2022
  • November 2022
  • October 2022
  • September 2022
  • August 2022
  • July 2022
  • June 2022
  • May 2022
  • April 2022
  • March 2022
  • February 2022
  • January 2022
  • December 2021
  • November 2021

Categories

  • Apollo Answers
  • Course Introductions
  • Economic Intelligence
  • Hide from Wordpress Search
  • Investment Knowledge
  • Perspectives
  • Redirecting
  • The Daily Spark
  • The View from Apollo
  • The Weekly Brief
  • Uncategorized
  • White Papers

What Comes After the Fed Pivot?

FOMC members have since 2021 steadily been revising up their forecasts for where they think the Fed funds rate will be by the end of 2024, see chart below. This changed at their meeting earlier this week, where the Fed signaled that they now see interest rates in 2024 lower than they thought in September.

This pivot in communication, however, does not suggest that the inflation problem has been solved. Looking into 2024, there are upside risks to inflation (from a recovering housing market and easier financial conditions) and downside risks to growth (from the lagged effects of Fed hikes on consumers, firms, and banks).

The bottom line is that they may have pivoted their communication, but the Fed is not yet out of the woods, and the upside risks to inflation and downside risks to growth remain significant.

I will discuss the Fed pivot and our outlook for markets in 2024 in detail in an Apollo Academy class on Wednesday, December 20 at 11 am (eligible for 1 CE credit). Register today.

The Fed December surprise: Pivots to dovish stance, signals three rate cuts in 2024
Source: Bloomberg, Federal Reserve Board. Data as of December 14, 2023.

Download hi-res chart(s)

Recent Posts

  • Comparing Wage Growth for Job Stayers and Job Switchers
  • Different Retirement Systems in Europe
  • AI Bubble Today Is Bigger Than the IT Bubble in the 1990s
  • 75% of Restaurant Orders Are Delivery Orders
  • Japan: Negative Population Growth = More Empty Homes

Recent Comments

No comments to show.

Archives

  • July 2025
  • June 2025
  • May 2025
  • April 2025
  • March 2025
  • February 2025
  • January 2025
  • December 2024
  • November 2024
  • October 2024
  • September 2024
  • August 2024
  • July 2024
  • June 2024
  • May 2024
  • April 2024
  • March 2024
  • February 2024
  • January 2024
  • December 2023
  • November 2023
  • October 2023
  • September 2023
  • August 2023
  • July 2023
  • June 2023
  • May 2023
  • April 2023
  • March 2023
  • February 2023
  • January 2023
  • December 2022
  • November 2022
  • October 2022
  • September 2022
  • August 2022
  • July 2022
  • June 2022
  • May 2022
  • April 2022
  • March 2022
  • February 2022
  • January 2022
  • December 2021
  • November 2021

Categories

  • Apollo Answers
  • Course Introductions
  • Economic Intelligence
  • Hide from Wordpress Search
  • Investment Knowledge
  • Perspectives
  • Redirecting
  • The Daily Spark
  • The View from Apollo
  • The Weekly Brief
  • Uncategorized
  • White Papers

Uneven Transmission of Monetary Policy in Europe

Data from the ECB shows that ECB rate hikes have had a very uneven impact on euro area countries with interest rates for firms increasing much more in periphery countries than in core countries.

For example, interest rates on outstanding loans to non-financial corporations in Ireland and Portugal are currently around 5.6% versus 3.3% in Germany and France, see chart below.

The bottom line is that ECB rate hikes negatively impact the periphery more than the core.

ECB: Uneven transmission mechanism of monetary policy
Source: ECB, Bloomberg, Apollo Chief Economist

Download high-res chart(s)

Recent Posts

  • Comparing Wage Growth for Job Stayers and Job Switchers
  • Different Retirement Systems in Europe
  • AI Bubble Today Is Bigger Than the IT Bubble in the 1990s
  • 75% of Restaurant Orders Are Delivery Orders
  • Japan: Negative Population Growth = More Empty Homes

Recent Comments

No comments to show.

Archives

  • July 2025
  • June 2025
  • May 2025
  • April 2025
  • March 2025
  • February 2025
  • January 2025
  • December 2024
  • November 2024
  • October 2024
  • September 2024
  • August 2024
  • July 2024
  • June 2024
  • May 2024
  • April 2024
  • March 2024
  • February 2024
  • January 2024
  • December 2023
  • November 2023
  • October 2023
  • September 2023
  • August 2023
  • July 2023
  • June 2023
  • May 2023
  • April 2023
  • March 2023
  • February 2023
  • January 2023
  • December 2022
  • November 2022
  • October 2022
  • September 2022
  • August 2022
  • July 2022
  • June 2022
  • May 2022
  • April 2022
  • March 2022
  • February 2022
  • January 2022
  • December 2021
  • November 2021

Categories

  • Apollo Answers
  • Course Introductions
  • Economic Intelligence
  • Hide from Wordpress Search
  • Investment Knowledge
  • Perspectives
  • Redirecting
  • The Daily Spark
  • The View from Apollo
  • The Weekly Brief
  • Uncategorized
  • White Papers

Daily Average Trading Volumes for IG

Trading volume in investment grade bonds was at post-Covid highs in November and significantly above 2019 levels, see chart below.

Investment grade trading volume was very high in November
Source: FINRA TRACE, Haver Analytics, Apollo Chief Economist

Download high-res chart(s)

Recent Posts

  • Comparing Wage Growth for Job Stayers and Job Switchers
  • Different Retirement Systems in Europe
  • AI Bubble Today Is Bigger Than the IT Bubble in the 1990s
  • 75% of Restaurant Orders Are Delivery Orders
  • Japan: Negative Population Growth = More Empty Homes

Recent Comments

No comments to show.

Archives

  • July 2025
  • June 2025
  • May 2025
  • April 2025
  • March 2025
  • February 2025
  • January 2025
  • December 2024
  • November 2024
  • October 2024
  • September 2024
  • August 2024
  • July 2024
  • June 2024
  • May 2024
  • April 2024
  • March 2024
  • February 2024
  • January 2024
  • December 2023
  • November 2023
  • October 2023
  • September 2023
  • August 2023
  • July 2023
  • June 2023
  • May 2023
  • April 2023
  • March 2023
  • February 2023
  • January 2023
  • December 2022
  • November 2022
  • October 2022
  • September 2022
  • August 2022
  • July 2022
  • June 2022
  • May 2022
  • April 2022
  • March 2022
  • February 2022
  • January 2022
  • December 2021
  • November 2021

Categories

  • Apollo Answers
  • Course Introductions
  • Economic Intelligence
  • Hide from Wordpress Search
  • Investment Knowledge
  • Perspectives
  • Redirecting
  • The Daily Spark
  • The View from Apollo
  • The Weekly Brief
  • Uncategorized
  • White Papers

Significant Increase in the Number of Men Age 55 to 64 Joining the Labor Force

In recent months, we have seen a significant increase in the number of men age 55 to 64 joining the workforce, see chart below.

Significant Increase in the Number of Men Age 55 to 64 Joining the Labor Force
Source: BLS, Haver Analytics, Apollo Chief Economist

Download high-res chart(s)

Recent Posts

  • Comparing Wage Growth for Job Stayers and Job Switchers
  • Different Retirement Systems in Europe
  • AI Bubble Today Is Bigger Than the IT Bubble in the 1990s
  • 75% of Restaurant Orders Are Delivery Orders
  • Japan: Negative Population Growth = More Empty Homes

Recent Comments

No comments to show.

Archives

  • July 2025
  • June 2025
  • May 2025
  • April 2025
  • March 2025
  • February 2025
  • January 2025
  • December 2024
  • November 2024
  • October 2024
  • September 2024
  • August 2024
  • July 2024
  • June 2024
  • May 2024
  • April 2024
  • March 2024
  • February 2024
  • January 2024
  • December 2023
  • November 2023
  • October 2023
  • September 2023
  • August 2023
  • July 2023
  • June 2023
  • May 2023
  • April 2023
  • March 2023
  • February 2023
  • January 2023
  • December 2022
  • November 2022
  • October 2022
  • September 2022
  • August 2022
  • July 2022
  • June 2022
  • May 2022
  • April 2022
  • March 2022
  • February 2022
  • January 2022
  • December 2021
  • November 2021

Categories

  • Apollo Answers
  • Course Introductions
  • Economic Intelligence
  • Hide from Wordpress Search
  • Investment Knowledge
  • Perspectives
  • Redirecting
  • The Daily Spark
  • The View from Apollo
  • The Weekly Brief
  • Uncategorized
  • White Papers

Busiest Bankruptcy Courts

There are more Chapter 11 bankruptcy filings in Texas, New Jersey, Delaware, and New York than in other states, see map below.

The busiest bankruptcy courts are in Texas, New Jersey, Delaware, and New York
Source: Epiq bankruptcy, Apollo Chief Economist. Data from January 1, 2023 to December 8, 2023.

Download high-res chart(s)

Recent Posts

  • Comparing Wage Growth for Job Stayers and Job Switchers
  • Different Retirement Systems in Europe
  • AI Bubble Today Is Bigger Than the IT Bubble in the 1990s
  • 75% of Restaurant Orders Are Delivery Orders
  • Japan: Negative Population Growth = More Empty Homes

Recent Comments

No comments to show.

Archives

  • July 2025
  • June 2025
  • May 2025
  • April 2025
  • March 2025
  • February 2025
  • January 2025
  • December 2024
  • November 2024
  • October 2024
  • September 2024
  • August 2024
  • July 2024
  • June 2024
  • May 2024
  • April 2024
  • March 2024
  • February 2024
  • January 2024
  • December 2023
  • November 2023
  • October 2023
  • September 2023
  • August 2023
  • July 2023
  • June 2023
  • May 2023
  • April 2023
  • March 2023
  • February 2023
  • January 2023
  • December 2022
  • November 2022
  • October 2022
  • September 2022
  • August 2022
  • July 2022
  • June 2022
  • May 2022
  • April 2022
  • March 2022
  • February 2022
  • January 2022
  • December 2021
  • November 2021

Categories

  • Apollo Answers
  • Course Introductions
  • Economic Intelligence
  • Hide from Wordpress Search
  • Investment Knowledge
  • Perspectives
  • Redirecting
  • The Daily Spark
  • The View from Apollo
  • The Weekly Brief
  • Uncategorized
  • White Papers

Posts navigation

←Previous page Page 1 Page 2 Page 3 Page 4 Next page→
  • Privacy Notice
  • Terms of Use
  • Forward-Looking Statements
Apollo
© Apollo Global Management, Inc. All Rights Reserved.

The Apollo Academy is for informational and educational purposes only and nothing contained herein should be taken as investment advice or a recommendation to enter into any transaction. They are not an invitation by or on behalf of Apollo to any person to buy or sell any security or to adopt any investment strategy, and shall not form the basis of, nor may it accompany nor form part of, any right or contract to buy or sell any security or to adopt any investment strategy. There is no guarantee that the views and opinions expressed in this website will come to pass. For additional information, please see the disclaimers included in each piece of content or the legal page of our website here.