• Apollo.com
  • Login
  • Register Now
light site-logo
  • The Academy
  • Upcoming Events
        • Upcoming Events

        • 2026 OutlookTuesday, December 16, 2025 • 11:00am ET
  • Learning Center
        • New & UpdatedAlternative Investing Course 2.0

        • Alternative Investing Essentials Part OnePrivate Equity, Venture Capital, Private Credit
        • Alternative Investing Essentials Part TwoReal Estate, Infrastructure, Digital Assets, Hedge Funds
        • Practical ConsiderationsAsset Allocation, Risk Considerations, Fund Structures, Fees
        • Introductory Videos

          View All Videos

        •  Recent Classes & Videos

        • • Private Equity’s Edge: Delivering Alpha in a Changing Market
        • • Powering Innovation: Infrastructure Investing Across the AI Value Chain
        • • Mid-Year Outlook: At the Crossroads of Stagflation — What’s Next?
        • • Hybrid Investments: Flexible Structures for Volatile Times
        • • Private Credit Investing in Volatile Times
        • • Potential Implications of the Latest US Administration Policy Proposals
        • View All Classes

  • Alternative Perspectives
        • Investment Knowledge
        • The View from Apollo
          • Investment Knowledge

            Hybrid in Action: Delivering Bespoke Capital Solutions in a New Market Paradigm

            December 4, 2025
          • The View From Apollo

            Private Equity: Alpha in an Evolving Market

            November 24, 2025
          • Apollo Answers Investment Knowledge

            Apollo Answers: What’s Missing in Private Credit? Integrating Asset-Backed Finance

            October 27, 2025
  • The Daily Spark
        • Read The Daily Spark Blog


        • Want it delivered daily to your inbox?
          • The Daily Spark

            The Duration Mismatch in the Banking Sector Is a Risk to Financial Stability

            December 6, 2025
          • The Daily Spark

            Default Rates Are Falling

            December 5, 2025
          • The Daily Spark

            Top 5 Risks in 2026

            December 4, 2025
  • Register for Apollo Academy: Alternative Investing Course
  • Login
  • About Apollo Academy
  • Upcoming Events
  • Learning Center
  • Alternative Perspectives
  • The Daily Spark
  • Register for Apollo Academy: Alternative Investing Course
  • Login
  • 2026 Outlook
  • Alternative Investing Course 2.0
  • Private Equity’s Edge: Delivering Alpha in a Changing Market
  • Powering Innovation: Infrastructure Investing Across the AI Value Chain
  • Mid-Year Outlook: At the Crossroads of Stagflation — What’s Next?
  • Hybrid Investments: Flexible Structures for Volatile Times
  • Private Credit Investing in Volatile Times
  • Potential Implications of the Latest US Administration Policy Proposals
  • View All Classes
  • Introductory Videos
  • Alternative Investing Essentials Part One • Now Available On Demand
  • Alternative Investing Essentials Part Two • Now Available On Demand
  • Practical Considerations • Now Available On Demand
  • Investment Knowledge
  • The View from Apollo
Home May 2022

Slowdown Watch: Still No Signs of the Economy Slowing

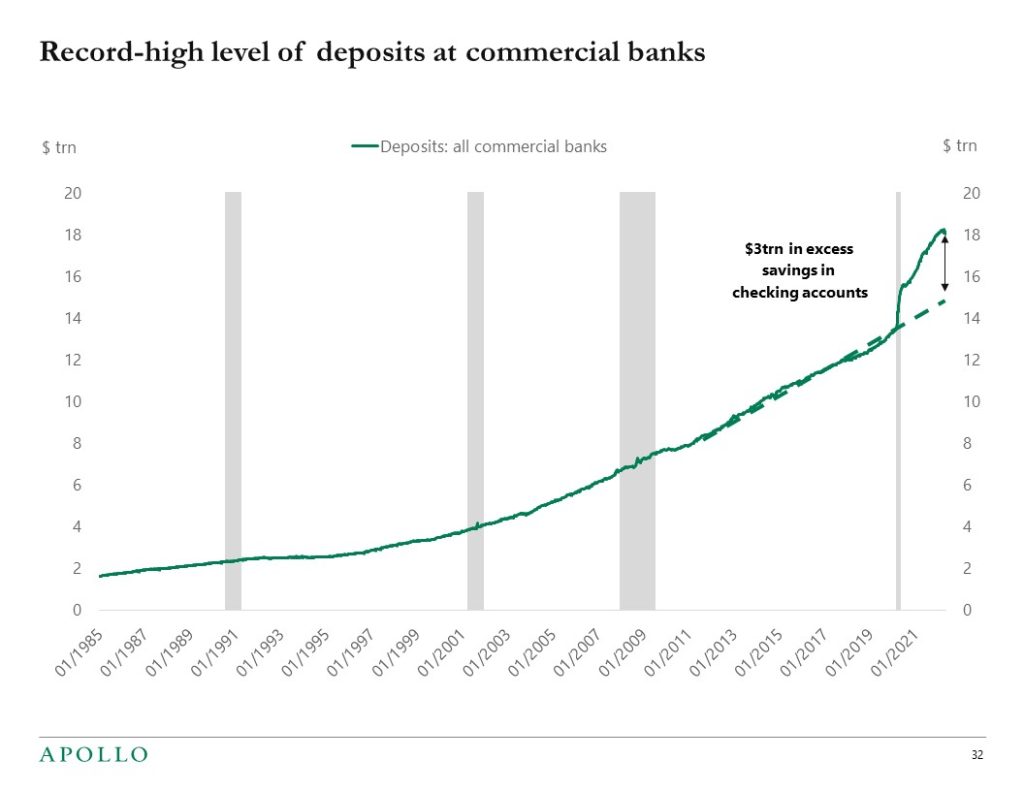
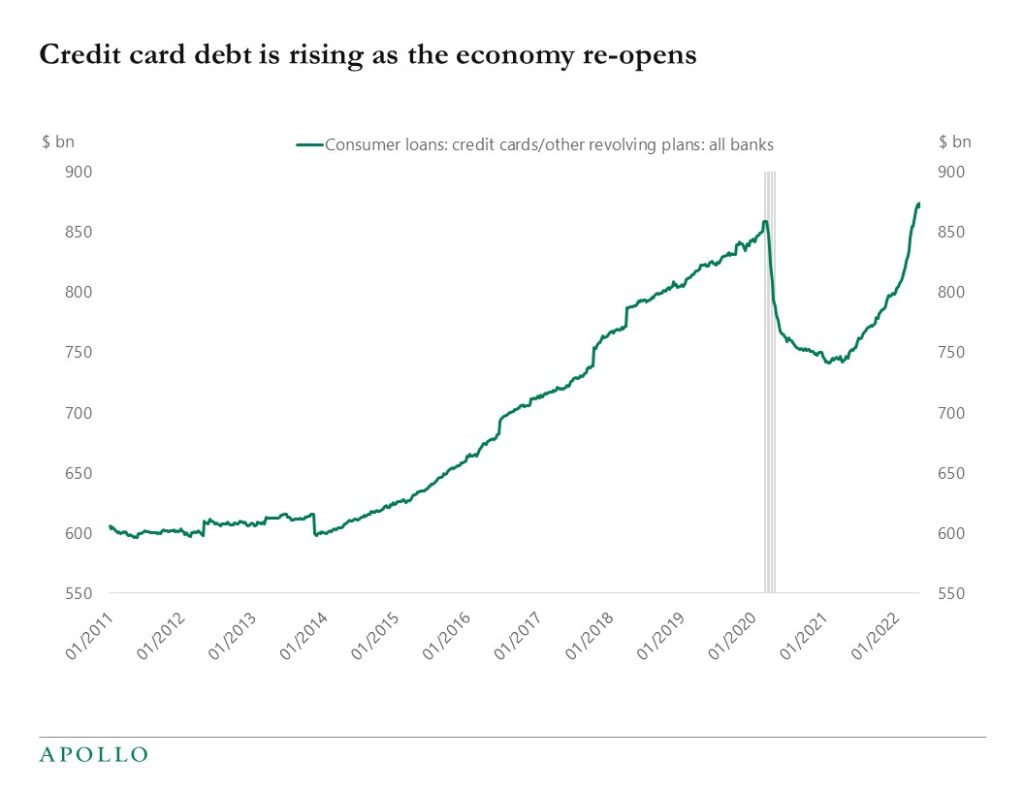
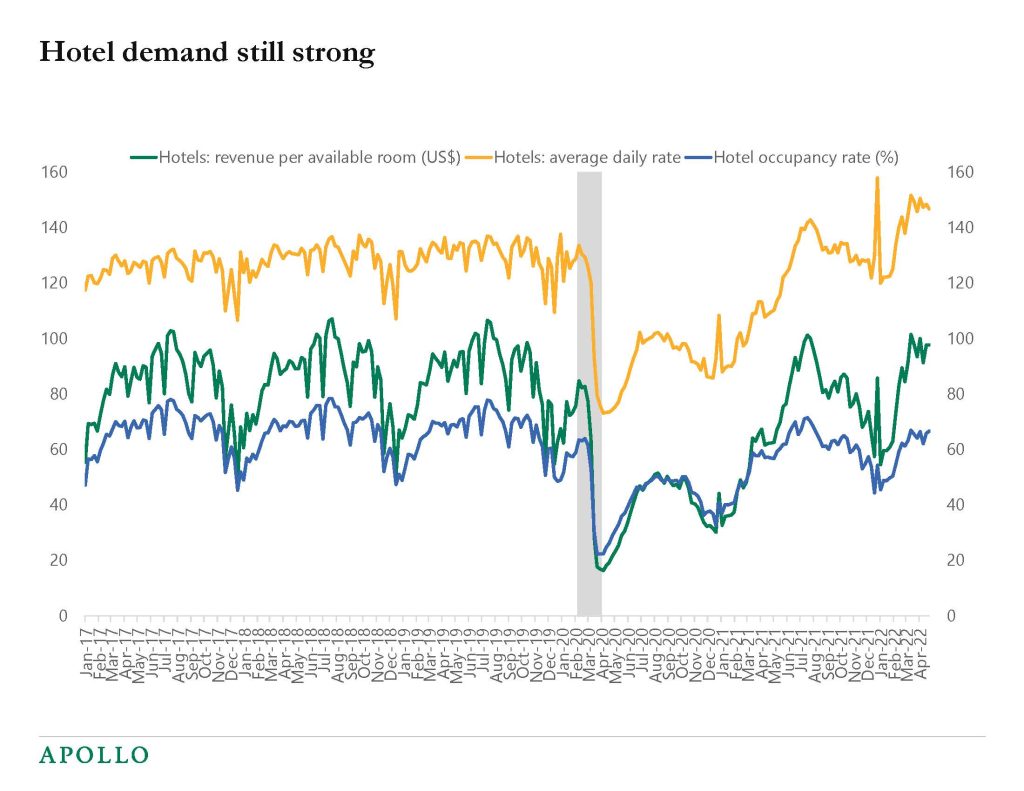
Our chartbook with daily and weekly economic indicators is available here, and while financial conditions continue to tighten, there are still no signs of the economy slowing down. Importantly, consumers and corporates hold about $4trn extra in cash, see the first chart below, which is very supportive for US consumer spending. Note also that the recent increase in the level of credit card debt seen in the second chart is NOT because consumers are running out of cash but simply because the virus is subsiding, and more people are going out to shop, eat at restaurants, and stay at hotels etc. The bottom line for markets is that the Fed still has a lot of work to do to slow this economy down. In plain English: Demand in the economy is simply too strong.

Chart showing record deposits at commercial banks, which supports consumer spending
Source: FRB, Haver, Apollo Chief Economist
Chart showing a jump in credit card debt as the economy rebounds from the pandemic
Source: FRB, Haver, Apollo Chief Economist

Recent Posts

  • The Duration Mismatch in the Banking Sector Is a Risk to Financial Stability
  • Default Rates Are Falling
  • Hybrid in Action: Delivering Bespoke Capital Solutions in a New Market Paradigm
  • Top 5 Risks in 2026
  • Swaption Volatility Remains Remarkably Low Despite Ongoing Fed Debate

Recent Comments

No comments to show.

Archives

  • December 2025
  • November 2025
  • October 2025
  • September 2025
  • August 2025
  • July 2025
  • June 2025
  • May 2025
  • April 2025
  • March 2025
  • February 2025
  • January 2025
  • December 2024
  • November 2024
  • October 2024
  • September 2024
  • August 2024
  • July 2024
  • June 2024
  • May 2024
  • April 2024
  • March 2024
  • February 2024
  • January 2024
  • December 2023
  • November 2023
  • October 2023
  • September 2023
  • August 2023
  • July 2023
  • June 2023
  • May 2023
  • April 2023
  • March 2023
  • February 2023
  • January 2023
  • December 2022
  • November 2022
  • October 2022
  • September 2022
  • August 2022
  • July 2022
  • June 2022
  • May 2022
  • April 2022
  • March 2022
  • February 2022
  • January 2022
  • December 2021
  • November 2021

Categories

  • Apollo Answers
  • Course Introductions
  • Economic Intelligence
  • Hide from Wordpress Search
  • Investment Knowledge
  • Perspectives
  • Redirecting
  • The Daily Spark
  • The View from Apollo
  • The Weekly Brief
  • Uncategorized
  • White Papers

Comparing the Sell-Off in Credit Markets vs Equity Markets

Once the Fed succeeds in slowing down the economy, we will begin to see more differentiation in credit markets, see chart below. So far, the sell-off in credit markets has been remarkably synchronized compared with the significant differences in returns seen in tech and value in equity markets. With inflation above 8% and projected to be 5% by the end of the year, the correction in risk assets continues.

Chart showing that credit markets are largely correcting in line with each other
Source: Bloomberg, Apollo Chief Economist

Recent Posts

  • The Duration Mismatch in the Banking Sector Is a Risk to Financial Stability
  • Default Rates Are Falling
  • Hybrid in Action: Delivering Bespoke Capital Solutions in a New Market Paradigm
  • Top 5 Risks in 2026
  • Swaption Volatility Remains Remarkably Low Despite Ongoing Fed Debate

Recent Comments

No comments to show.

Archives

  • December 2025
  • November 2025
  • October 2025
  • September 2025
  • August 2025
  • July 2025
  • June 2025
  • May 2025
  • April 2025
  • March 2025
  • February 2025
  • January 2025
  • December 2024
  • November 2024
  • October 2024
  • September 2024
  • August 2024
  • July 2024
  • June 2024
  • May 2024
  • April 2024
  • March 2024
  • February 2024
  • January 2024
  • December 2023
  • November 2023
  • October 2023
  • September 2023
  • August 2023
  • July 2023
  • June 2023
  • May 2023
  • April 2023
  • March 2023
  • February 2023
  • January 2023
  • December 2022
  • November 2022
  • October 2022
  • September 2022
  • August 2022
  • July 2022
  • June 2022
  • May 2022
  • April 2022
  • March 2022
  • February 2022
  • January 2022
  • December 2021
  • November 2021

Categories

  • Apollo Answers
  • Course Introductions
  • Economic Intelligence
  • Hide from Wordpress Search
  • Investment Knowledge
  • Perspectives
  • Redirecting
  • The Daily Spark
  • The View from Apollo
  • The Weekly Brief
  • Uncategorized
  • White Papers

Most IG Bonds Trading Below Par

The Bloomberg US IG Aggregate Bond Index includes Treasuries, corporate bonds, and MBS, and currently, 80% of the index is trading below par.

Chart showing the percentage of US investment grade bonds trading below par has surged to 80%
Source: Bloomberg, Apollo Chief Economist. Note: Data used for members in the LBUSTRUU Index as of 11th May 2022.

Recent Posts

  • The Duration Mismatch in the Banking Sector Is a Risk to Financial Stability
  • Default Rates Are Falling
  • Hybrid in Action: Delivering Bespoke Capital Solutions in a New Market Paradigm
  • Top 5 Risks in 2026
  • Swaption Volatility Remains Remarkably Low Despite Ongoing Fed Debate

Recent Comments

No comments to show.

Archives

  • December 2025
  • November 2025
  • October 2025
  • September 2025
  • August 2025
  • July 2025
  • June 2025
  • May 2025
  • April 2025
  • March 2025
  • February 2025
  • January 2025
  • December 2024
  • November 2024
  • October 2024
  • September 2024
  • August 2024
  • July 2024
  • June 2024
  • May 2024
  • April 2024
  • March 2024
  • February 2024
  • January 2024
  • December 2023
  • November 2023
  • October 2023
  • September 2023
  • August 2023
  • July 2023
  • June 2023
  • May 2023
  • April 2023
  • March 2023
  • February 2023
  • January 2023
  • December 2022
  • November 2022
  • October 2022
  • September 2022
  • August 2022
  • July 2022
  • June 2022
  • May 2022
  • April 2022
  • March 2022
  • February 2022
  • January 2022
  • December 2021
  • November 2021

Categories

  • Apollo Answers
  • Course Introductions
  • Economic Intelligence
  • Hide from Wordpress Search
  • Investment Knowledge
  • Perspectives
  • Redirecting
  • The Daily Spark
  • The View from Apollo
  • The Weekly Brief
  • Uncategorized
  • White Papers

Serious Turbulence in Venture Capital

The venture capital index seen in the chart below measures the value of the US-based venture capital private company universe in which venture capital funds invest. It shows that venture capital valuations have so far fallen 56% from their peak. And there is likely more downside over the coming quarters given the consensus expectation that inflation at the end of 2022 will be 5%, which is still significantly above the Fed’s 2% inflation target. The bottom line for markets is that as long as inflation is meaningfully above the Fed’s target, we will continue to see turbulence in markets, particularly in long-duration assets such as tech and venture capital.

Chart showing a steep dive back to pre-pandemic levels for venture capital valuations
Source: Bloomberg, Apollo Chief economist. Note: The Refinitiv Venture Capital Index is designed to measure the value of the US-based venture capital private company universe in which venture capital funds invest.

Recent Posts

  • The Duration Mismatch in the Banking Sector Is a Risk to Financial Stability
  • Default Rates Are Falling
  • Hybrid in Action: Delivering Bespoke Capital Solutions in a New Market Paradigm
  • Top 5 Risks in 2026
  • Swaption Volatility Remains Remarkably Low Despite Ongoing Fed Debate

Recent Comments

No comments to show.

Archives

  • December 2025
  • November 2025
  • October 2025
  • September 2025
  • August 2025
  • July 2025
  • June 2025
  • May 2025
  • April 2025
  • March 2025
  • February 2025
  • January 2025
  • December 2024
  • November 2024
  • October 2024
  • September 2024
  • August 2024
  • July 2024
  • June 2024
  • May 2024
  • April 2024
  • March 2024
  • February 2024
  • January 2024
  • December 2023
  • November 2023
  • October 2023
  • September 2023
  • August 2023
  • July 2023
  • June 2023
  • May 2023
  • April 2023
  • March 2023
  • February 2023
  • January 2023
  • December 2022
  • November 2022
  • October 2022
  • September 2022
  • August 2022
  • July 2022
  • June 2022
  • May 2022
  • April 2022
  • March 2022
  • February 2022
  • January 2022
  • December 2021
  • November 2021

Categories

  • Apollo Answers
  • Course Introductions
  • Economic Intelligence
  • Hide from Wordpress Search
  • Investment Knowledge
  • Perspectives
  • Redirecting
  • The Daily Spark
  • The View from Apollo
  • The Weekly Brief
  • Uncategorized
  • White Papers

Fed’s Goal is to Cool Down the E in the P/E Ratio

The P/E ratio for the S&P500 is today about 30% above its historical average, see the first chart. And the Shiller Cyclically-Adjusted P/E ratio, which adjusts earnings for inflation, is about 50% above its historical average, see the second chart.

The problem for the stock market is inflation. As long as inflation is significantly above the Fed’s 2% target, the FOMC will remain hawkish and try to tighten financial conditions to slow down growth, which is negative for the equity market.

The consensus currently expects CPI and PCE inflation at the end of this year to be between 4% and 6%, which suggests that we will have to get into 2023 before we know that we are not in a new regime with permanently higher inflation.

The key question for all markets is the following: How will the Fed respond later this year when the unemployment rate begins to move higher if inflation is still around 5%, as the consensus expects? And if the Fed turns dovish later this year in response to rising unemployment, how will long rates and breakevens then respond? It will ultimately be a test whether the Fed will put more weight on rising unemployment or on too high inflation.

Chart showing the S&P500's P/E ratio is still 30% above its historical average
Source: Robert Shiller, Apollo Chief Economist. Note: Price to earnings ratio, based on trailing twelve months “as reported” earnings.
Chart showing the S&P500's cyclically adjusted P/E is still well above its long-term average.
Robert Shiller, Apollo Chief Economist. Note: Price to earnings ratio, based on trailing twelve months “as reported” earnings.

Recent Posts

  • The Duration Mismatch in the Banking Sector Is a Risk to Financial Stability
  • Default Rates Are Falling
  • Hybrid in Action: Delivering Bespoke Capital Solutions in a New Market Paradigm
  • Top 5 Risks in 2026
  • Swaption Volatility Remains Remarkably Low Despite Ongoing Fed Debate

Recent Comments

No comments to show.

Archives

  • December 2025
  • November 2025
  • October 2025
  • September 2025
  • August 2025
  • July 2025
  • June 2025
  • May 2025
  • April 2025
  • March 2025
  • February 2025
  • January 2025
  • December 2024
  • November 2024
  • October 2024
  • September 2024
  • August 2024
  • July 2024
  • June 2024
  • May 2024
  • April 2024
  • March 2024
  • February 2024
  • January 2024
  • December 2023
  • November 2023
  • October 2023
  • September 2023
  • August 2023
  • July 2023
  • June 2023
  • May 2023
  • April 2023
  • March 2023
  • February 2023
  • January 2023
  • December 2022
  • November 2022
  • October 2022
  • September 2022
  • August 2022
  • July 2022
  • June 2022
  • May 2022
  • April 2022
  • March 2022
  • February 2022
  • January 2022
  • December 2021
  • November 2021

Categories

  • Apollo Answers
  • Course Introductions
  • Economic Intelligence
  • Hide from Wordpress Search
  • Investment Knowledge
  • Perspectives
  • Redirecting
  • The Daily Spark
  • The View from Apollo
  • The Weekly Brief
  • Uncategorized
  • White Papers

The Post-Pandemic Labor Market

During the pandemic, the US economy lost 22 million jobs, and two years later, we have now re-created 21 million of those jobs, see the first chart below. The second and third charts show the sector distribution of the rebound in jobs. The level of employment in sectors within leisure and hospitality is still below pre-pandemic levels. In contrast, employment in industries such as air transportation, warehouses, and construction is now above pre-pandemic levels. The bottom line is that during the pandemic, we have seen a change in the composition of employment with solid growth in jobs in the goods sector and, more recently, strong growth in employment in the service sector. View our full employment report.

Chart showing the economy has regained nearly all jobs lost in the pandemic
Source: BLS, Apollo Chief Economist
Chart No. 1 showing job recoveries in various sectors
Source: BLS, Apollo Chief Economist
Chart No. 2 showing job recoveries in various sectors
Source: BLS, Apollo Chief Economist

Recent Posts

  • The Duration Mismatch in the Banking Sector Is a Risk to Financial Stability
  • Default Rates Are Falling
  • Hybrid in Action: Delivering Bespoke Capital Solutions in a New Market Paradigm
  • Top 5 Risks in 2026
  • Swaption Volatility Remains Remarkably Low Despite Ongoing Fed Debate

Recent Comments

No comments to show.

Archives

  • December 2025
  • November 2025
  • October 2025
  • September 2025
  • August 2025
  • July 2025
  • June 2025
  • May 2025
  • April 2025
  • March 2025
  • February 2025
  • January 2025
  • December 2024
  • November 2024
  • October 2024
  • September 2024
  • August 2024
  • July 2024
  • June 2024
  • May 2024
  • April 2024
  • March 2024
  • February 2024
  • January 2024
  • December 2023
  • November 2023
  • October 2023
  • September 2023
  • August 2023
  • July 2023
  • June 2023
  • May 2023
  • April 2023
  • March 2023
  • February 2023
  • January 2023
  • December 2022
  • November 2022
  • October 2022
  • September 2022
  • August 2022
  • July 2022
  • June 2022
  • May 2022
  • April 2022
  • March 2022
  • February 2022
  • January 2022
  • December 2021
  • November 2021

Categories

  • Apollo Answers
  • Course Introductions
  • Economic Intelligence
  • Hide from Wordpress Search
  • Investment Knowledge
  • Perspectives
  • Redirecting
  • The Daily Spark
  • The View from Apollo
  • The Weekly Brief
  • Uncategorized
  • White Papers

Slowdown Watch

Our chartbook with daily and weekly indicators for the US economy is available here, and the bottom line is that there are basically no signs of the economy slowing down. The chart of the week is the weekly hotel data, and it shows that RevPAR and the occupancy rate continue to move higher, see chart below.


Chart showing key hotel metrics such as occupancy, average daily rates and revenue per available room remain strong
Source: STR, Haver Analytics, Apollo Chief Economist

Recent Posts

  • The Duration Mismatch in the Banking Sector Is a Risk to Financial Stability
  • Default Rates Are Falling
  • Hybrid in Action: Delivering Bespoke Capital Solutions in a New Market Paradigm
  • Top 5 Risks in 2026
  • Swaption Volatility Remains Remarkably Low Despite Ongoing Fed Debate

Recent Comments

No comments to show.

Archives

  • December 2025
  • November 2025
  • October 2025
  • September 2025
  • August 2025
  • July 2025
  • June 2025
  • May 2025
  • April 2025
  • March 2025
  • February 2025
  • January 2025
  • December 2024
  • November 2024
  • October 2024
  • September 2024
  • August 2024
  • July 2024
  • June 2024
  • May 2024
  • April 2024
  • March 2024
  • February 2024
  • January 2024
  • December 2023
  • November 2023
  • October 2023
  • September 2023
  • August 2023
  • July 2023
  • June 2023
  • May 2023
  • April 2023
  • March 2023
  • February 2023
  • January 2023
  • December 2022
  • November 2022
  • October 2022
  • September 2022
  • August 2022
  • July 2022
  • June 2022
  • May 2022
  • April 2022
  • March 2022
  • February 2022
  • January 2022
  • December 2021
  • November 2021

Categories

  • Apollo Answers
  • Course Introductions
  • Economic Intelligence
  • Hide from Wordpress Search
  • Investment Knowledge
  • Perspectives
  • Redirecting
  • The Daily Spark
  • The View from Apollo
  • The Weekly Brief
  • Uncategorized
  • White Papers

Labor Market is Overheated

The first chart below shows that there are currently 11.5 million job openings and 6 million unemployed. The second chart shows that in leisure and hospitality there are more than two job openings per unemployed. The last graph shows that most job openings are in small firms with less than 250 employees. This data points to an overheated labor market with significant upward wage pressure. With this backdrop, the Fed will continue to push up short rates and long rates (via QT) to cool down labor demand, and it could take several quarters before the labor market cools enough for the Fed to turn less hawkish.

Chart showing a sharp downturn in the number of unemployed people per job opening
Source: BLS, Haver Analytics, Apollo Chief Economist
Chart showing two job openings per unemployed in leisure and hospitality
Source: BLS, Haver Analytics, Apollo Chief Economist
Chart showing a spike in job openings at small firms
Source: BLS, Haver Analytics, Apollo Chief Economist

Recent Posts

  • The Duration Mismatch in the Banking Sector Is a Risk to Financial Stability
  • Default Rates Are Falling
  • Hybrid in Action: Delivering Bespoke Capital Solutions in a New Market Paradigm
  • Top 5 Risks in 2026
  • Swaption Volatility Remains Remarkably Low Despite Ongoing Fed Debate

Recent Comments

No comments to show.

Archives

  • December 2025
  • November 2025
  • October 2025
  • September 2025
  • August 2025
  • July 2025
  • June 2025
  • May 2025
  • April 2025
  • March 2025
  • February 2025
  • January 2025
  • December 2024
  • November 2024
  • October 2024
  • September 2024
  • August 2024
  • July 2024
  • June 2024
  • May 2024
  • April 2024
  • March 2024
  • February 2024
  • January 2024
  • December 2023
  • November 2023
  • October 2023
  • September 2023
  • August 2023
  • July 2023
  • June 2023
  • May 2023
  • April 2023
  • March 2023
  • February 2023
  • January 2023
  • December 2022
  • November 2022
  • October 2022
  • September 2022
  • August 2022
  • July 2022
  • June 2022
  • May 2022
  • April 2022
  • March 2022
  • February 2022
  • January 2022
  • December 2021
  • November 2021

Categories

  • Apollo Answers
  • Course Introductions
  • Economic Intelligence
  • Hide from Wordpress Search
  • Investment Knowledge
  • Perspectives
  • Redirecting
  • The Daily Spark
  • The View from Apollo
  • The Weekly Brief
  • Uncategorized
  • White Papers

Credit Market Outlook

Fed Chair Powell said yesterday that the FOMC wants to tighten financial conditions. Investors must monitor to what degree this policy goal is achieved through wider credit spreads, lower equities, and/or higher interest rates.

This chart book looks at recent trends in credit markets, and the conclusion is that yield levels are rising, and IG spreads and HY spreads have widened. But with unemployment at 3.6% and inflation at 8.5%, there is still some way to go before the economy begins to cool down. The bottom line is that the Fed needs to continue to tighten financial conditions because of significantly elevated inflation levels, and some of this tightening will come in the form of wider credit spreads. As a result, the ongoing turbulence in markets is likely to continue until we begin to see inflation trend meaningfully lower.

Chart showing widening spreads between investment grade and high yield bonds
Source: Bloomberg, Apollo Chief Economist. Note: Tickers used are HYG US Equity and LQD US Equity.

Recent Posts

  • The Duration Mismatch in the Banking Sector Is a Risk to Financial Stability
  • Default Rates Are Falling
  • Hybrid in Action: Delivering Bespoke Capital Solutions in a New Market Paradigm
  • Top 5 Risks in 2026
  • Swaption Volatility Remains Remarkably Low Despite Ongoing Fed Debate

Recent Comments

No comments to show.

Archives

  • December 2025
  • November 2025
  • October 2025
  • September 2025
  • August 2025
  • July 2025
  • June 2025
  • May 2025
  • April 2025
  • March 2025
  • February 2025
  • January 2025
  • December 2024
  • November 2024
  • October 2024
  • September 2024
  • August 2024
  • July 2024
  • June 2024
  • May 2024
  • April 2024
  • March 2024
  • February 2024
  • January 2024
  • December 2023
  • November 2023
  • October 2023
  • September 2023
  • August 2023
  • July 2023
  • June 2023
  • May 2023
  • April 2023
  • March 2023
  • February 2023
  • January 2023
  • December 2022
  • November 2022
  • October 2022
  • September 2022
  • August 2022
  • July 2022
  • June 2022
  • May 2022
  • April 2022
  • March 2022
  • February 2022
  • January 2022
  • December 2021
  • November 2021

Categories

  • Apollo Answers
  • Course Introductions
  • Economic Intelligence
  • Hide from Wordpress Search
  • Investment Knowledge
  • Perspectives
  • Redirecting
  • The Daily Spark
  • The View from Apollo
  • The Weekly Brief
  • Uncategorized
  • White Papers

Supply Chain Problems Show Signs of Easing

This chart book looks at a broad range of supply chain indicators, and the conclusion is that things are getting better. So far, there are no signs that lockdowns in Beijing and Shanghai are having a major negative impact on global supply chains.

Recent Posts

  • The Duration Mismatch in the Banking Sector Is a Risk to Financial Stability
  • Default Rates Are Falling
  • Hybrid in Action: Delivering Bespoke Capital Solutions in a New Market Paradigm
  • Top 5 Risks in 2026
  • Swaption Volatility Remains Remarkably Low Despite Ongoing Fed Debate

Recent Comments

No comments to show.

Archives

  • December 2025
  • November 2025
  • October 2025
  • September 2025
  • August 2025
  • July 2025
  • June 2025
  • May 2025
  • April 2025
  • March 2025
  • February 2025
  • January 2025
  • December 2024
  • November 2024
  • October 2024
  • September 2024
  • August 2024
  • July 2024
  • June 2024
  • May 2024
  • April 2024
  • March 2024
  • February 2024
  • January 2024
  • December 2023
  • November 2023
  • October 2023
  • September 2023
  • August 2023
  • July 2023
  • June 2023
  • May 2023
  • April 2023
  • March 2023
  • February 2023
  • January 2023
  • December 2022
  • November 2022
  • October 2022
  • September 2022
  • August 2022
  • July 2022
  • June 2022
  • May 2022
  • April 2022
  • March 2022
  • February 2022
  • January 2022
  • December 2021
  • November 2021

Categories

  • Apollo Answers
  • Course Introductions
  • Economic Intelligence
  • Hide from Wordpress Search
  • Investment Knowledge
  • Perspectives
  • Redirecting
  • The Daily Spark
  • The View from Apollo
  • The Weekly Brief
  • Uncategorized
  • White Papers

Posts navigation

←Previous page Page 1 Page 2 Page 3 Page 4 Next page→
  • Privacy Notice
  • Terms of Use
  • Forward-Looking Statements
Apollo
© Apollo Global Management, Inc. All Rights Reserved.

The Apollo Academy is for informational and educational purposes only and nothing contained herein should be taken as investment advice or a recommendation to enter into any transaction. They are not an invitation by or on behalf of Apollo to any person to buy or sell any security or to adopt any investment strategy, and shall not form the basis of, nor may it accompany nor form part of, any right or contract to buy or sell any security or to adopt any investment strategy. There is no guarantee that the views and opinions expressed in this website will come to pass. For additional information, please see the disclaimers included in each piece of content or the legal page of our website here.