• Apollo.com
  • Login
  • Register Now
light site-logo
  • The Academy
  • Upcoming Events
        • Upcoming Events

        • 2026 OutlookTuesday, December 16, 2025 • 11:00am ET
  • Learning Center
        • New & UpdatedAlternative Investing Course 2.0

        • Alternative Investing Essentials Part OnePrivate Equity, Venture Capital, Private Credit
        • Alternative Investing Essentials Part TwoReal Estate, Infrastructure, Digital Assets, Hedge Funds
        • Practical ConsiderationsAsset Allocation, Risk Considerations, Fund Structures, Fees
        • Introductory Videos

          View All Videos

        •  Recent Classes & Videos

        • • Private Equity’s Edge: Delivering Alpha in a Changing Market
        • • Powering Innovation: Infrastructure Investing Across the AI Value Chain
        • • Mid-Year Outlook: At the Crossroads of Stagflation — What’s Next?
        • • Hybrid Investments: Flexible Structures for Volatile Times
        • • Private Credit Investing in Volatile Times
        • • Potential Implications of the Latest US Administration Policy Proposals
        • View All Classes

  • Alternative Perspectives
        • Investment Knowledge
        • The View from Apollo
          • Investment Knowledge

            Hybrid in Action: Delivering Bespoke Capital Solutions in a New Market Paradigm

            December 4, 2025
          • The View From Apollo

            Private Equity: Alpha in an Evolving Market

            November 24, 2025
          • Apollo Answers Investment Knowledge

            Apollo Answers: What’s Missing in Private Credit? Integrating Asset-Backed Finance

            October 27, 2025
  • The Daily Spark
        • Read The Daily Spark Blog


        • Want it delivered daily to your inbox?
          • The Daily Spark

            The Duration Mismatch in the Banking Sector Is a Risk to Financial Stability

            December 6, 2025
          • The Daily Spark

            Default Rates Are Falling

            December 5, 2025
          • The Daily Spark

            Top 5 Risks in 2026

            December 4, 2025
  • Register for Apollo Academy: Alternative Investing Course
  • Login
  • About Apollo Academy
  • Upcoming Events
  • Learning Center
  • Alternative Perspectives
  • The Daily Spark
  • Register for Apollo Academy: Alternative Investing Course
  • Login
  • 2026 Outlook
  • Alternative Investing Course 2.0
  • Private Equity’s Edge: Delivering Alpha in a Changing Market
  • Powering Innovation: Infrastructure Investing Across the AI Value Chain
  • Mid-Year Outlook: At the Crossroads of Stagflation — What’s Next?
  • Hybrid Investments: Flexible Structures for Volatile Times
  • Private Credit Investing in Volatile Times
  • Potential Implications of the Latest US Administration Policy Proposals
  • View All Classes
  • Introductory Videos
  • Alternative Investing Essentials Part One • Now Available On Demand
  • Alternative Investing Essentials Part Two • Now Available On Demand
  • Practical Considerations • Now Available On Demand
  • Investment Knowledge
  • The View from Apollo
Home November 2023

Rates Higher for Longer Continues

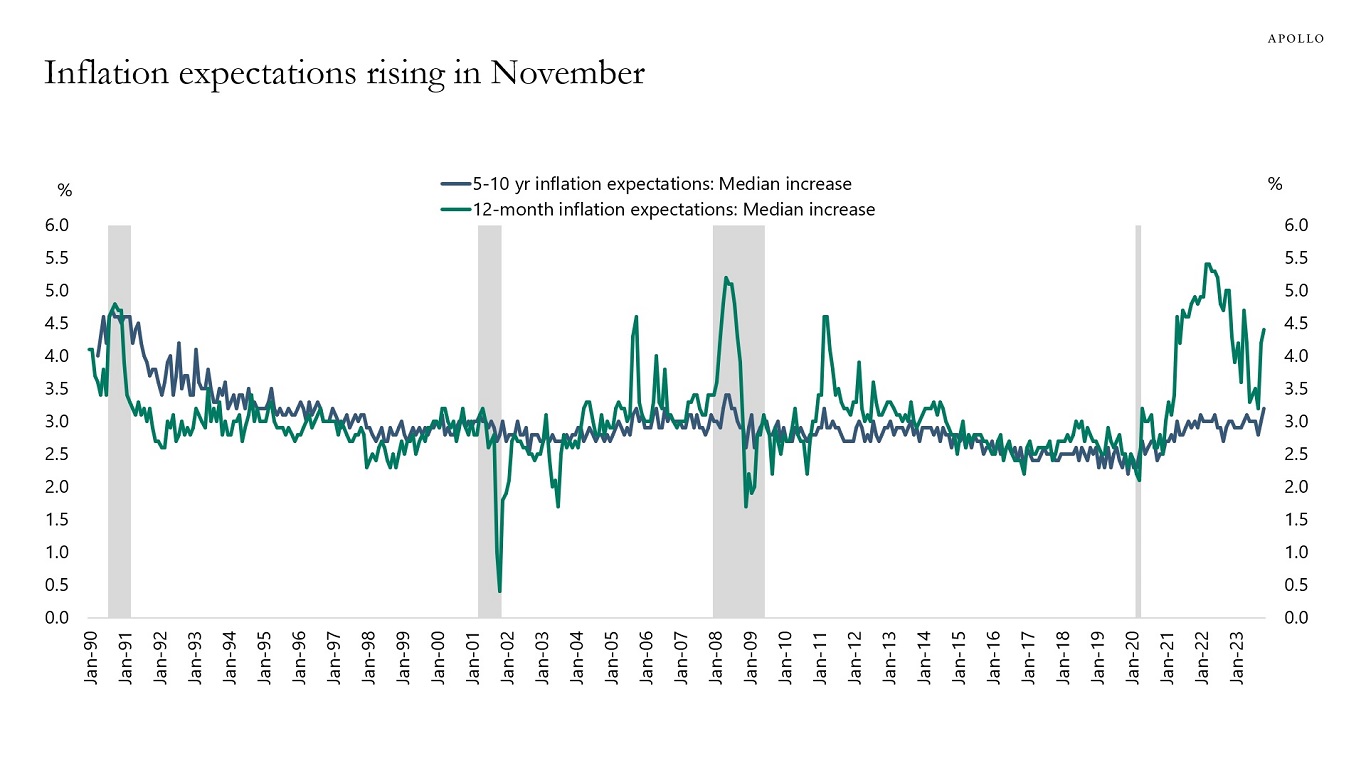
The Fed cannot begin to send dovish signals when inflation expectations jump higher the way they have done recently, see chart below.

Inflation expectations rising in November
Source: University of Michigan, Haver Analytics, Apollo Chief Economist

Download hi-res chart(s)

Recent Posts

  • The Duration Mismatch in the Banking Sector Is a Risk to Financial Stability
  • Default Rates Are Falling
  • Hybrid in Action: Delivering Bespoke Capital Solutions in a New Market Paradigm
  • Top 5 Risks in 2026
  • Swaption Volatility Remains Remarkably Low Despite Ongoing Fed Debate

Recent Comments

No comments to show.

Archives

  • December 2025
  • November 2025
  • October 2025
  • September 2025
  • August 2025
  • July 2025
  • June 2025
  • May 2025
  • April 2025
  • March 2025
  • February 2025
  • January 2025
  • December 2024
  • November 2024
  • October 2024
  • September 2024
  • August 2024
  • July 2024
  • June 2024
  • May 2024
  • April 2024
  • March 2024
  • February 2024
  • January 2024
  • December 2023
  • November 2023
  • October 2023
  • September 2023
  • August 2023
  • July 2023
  • June 2023
  • May 2023
  • April 2023
  • March 2023
  • February 2023
  • January 2023
  • December 2022
  • November 2022
  • October 2022
  • September 2022
  • August 2022
  • July 2022
  • June 2022
  • May 2022
  • April 2022
  • March 2022
  • February 2022
  • January 2022
  • December 2021
  • November 2021

Categories

  • Apollo Answers
  • Course Introductions
  • Economic Intelligence
  • Hide from Wordpress Search
  • Investment Knowledge
  • Perspectives
  • Redirecting
  • The Daily Spark
  • The View from Apollo
  • The Weekly Brief
  • Uncategorized
  • White Papers

Restaurant Demand Slows

Last week, we got two important data points: CPI inflation and retail sales. Both core and headline inflation came in under expectations, the latest indication that inflation is trending in the right direction. But there’s still more work to do to get inflation down to the Federal Reserve’s 2% target. Retail sales were weaker than expected in October, likely impacted by the restart of student loan payments on October 1. In taking a closer look at what’s happening with consumer services, we’re seeing a notable decline in demand in areas like restaurant spending. This softening is likely the combined impact of interest rate hikes, student loan payments restarting, and households running low on excess savings. Taken together, we’re seeing more pressure on consumer spending as we head into the holiday season.


This presentation may not be distributed, transmitted or otherwise communicated to others in whole or in part without the express consent of Apollo Global Management, Inc. (together with its subsidiaries, “Apollo”).  

Apollo makes no representation or warranty, expressed or implied, with respect to the accuracy, reasonableness, or completeness of any of the statements made during this presentation, including, but not limited to, statements obtained from third parties. Opinions, estimates and projections constitute the current judgment of the speaker as of the date indicated. They do not necessarily reflect the views and opinions of Apollo and are subject to change at any time without notice. Apollo does not have any responsibility to update this presentation to account for such changes. There can be no assurance that any trends discussed during this presentation will continue.   

Statements made throughout this presentation are not intended to provide, and should not be relied upon for, accounting, legal or tax advice and do not constitute an investment recommendation or investment advice. Investors should make an independent investigation of the information discussed during this presentation, including consulting their tax, legal, accounting or other advisors about such information. Apollo does not act for you and is not responsible for providing you with the protections afforded to its clients. This presentation does not constitute an offer to sell, or the solicitation of an offer to buy, any security, product or service, including interest in any investment product or fund or account managed or advised by Apollo. 

Certain statements made throughout this presentation may be “forward-looking” in nature. Due to various risks and uncertainties, actual events or results may differ materially from those reflected or contemplated in such forward-looking information. As such, undue reliance should not be placed on such statements. Forward-looking statements may be identified by the use of terminology including, but not limited to, “may”, “will”, “should”, “expect”, “anticipate”, “target”, “project”, “estimate”, “intend”, “continue” or “believe” or the negatives thereof or other variations thereon or comparable terminology.

Recent Posts

  • The Duration Mismatch in the Banking Sector Is a Risk to Financial Stability
  • Default Rates Are Falling
  • Hybrid in Action: Delivering Bespoke Capital Solutions in a New Market Paradigm
  • Top 5 Risks in 2026
  • Swaption Volatility Remains Remarkably Low Despite Ongoing Fed Debate

Recent Comments

No comments to show.

Archives

  • December 2025
  • November 2025
  • October 2025
  • September 2025
  • August 2025
  • July 2025
  • June 2025
  • May 2025
  • April 2025
  • March 2025
  • February 2025
  • January 2025
  • December 2024
  • November 2024
  • October 2024
  • September 2024
  • August 2024
  • July 2024
  • June 2024
  • May 2024
  • April 2024
  • March 2024
  • February 2024
  • January 2024
  • December 2023
  • November 2023
  • October 2023
  • September 2023
  • August 2023
  • July 2023
  • June 2023
  • May 2023
  • April 2023
  • March 2023
  • February 2023
  • January 2023
  • December 2022
  • November 2022
  • October 2022
  • September 2022
  • August 2022
  • July 2022
  • June 2022
  • May 2022
  • April 2022
  • March 2022
  • February 2022
  • January 2022
  • December 2021
  • November 2021

Categories

  • Apollo Answers
  • Course Introductions
  • Economic Intelligence
  • Hide from Wordpress Search
  • Investment Knowledge
  • Perspectives
  • Redirecting
  • The Daily Spark
  • The View from Apollo
  • The Weekly Brief
  • Uncategorized
  • White Papers

The US Fiscal Situation and Markets

There is a lot of discussion in markets about the implications of the US fiscal situation.

Three areas to watch for investors are 1) debt ceiling and shutdown risk, 2) Treasury auctions, and 3) US downgrade risk. The complication for markets is that the debt ceiling and shutdown come and go with months between, but Treasury auctions happen every week, and a notice from a rating agency about the US fiscal situation can come with no warning.

In other words, for investors, the fiscal situation is not like watching quarterly earnings but instead a topic constantly lingering in the background that can impact markets with little or no warning—if, for example, a Treasury auction tails or rating agencies issue a statement.

The fundamental question remains: Who is going to buy the growing supply of Treasuries, and at what price?

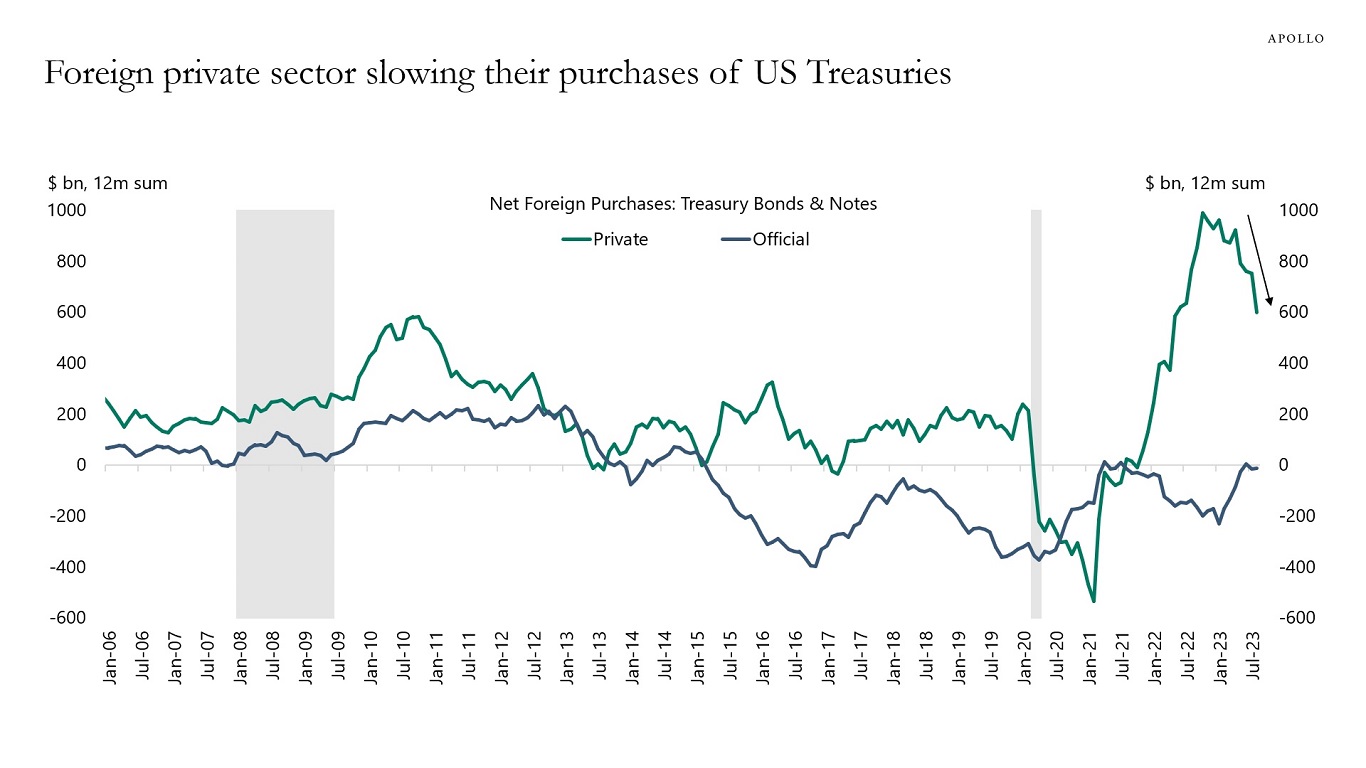
Looking at net foreign purchases of Treasuries shows that foreign official institutions, i.e., central banks and sovereign wealth funds, have been net sellers of Treasuries since 2015, see chart below.

Foreign private buyers, on the other hand, stepped up purchases when the Fed raised interest rates in 2022. But in 2023 with rates peaking, they have been slowing their purchases, see again the chart below.

The bottom line is that investors across all asset classes need to spend some time not only on who is buying Treasuries—including whether it is yield-sensitive or yield-insensitive buyers—but also on Treasury auction metrics and what the rating agencies are saying and doing.

Foreign private sector slowing their purchases of US Treasuries
Source: Treasury, Haver Analytics, Apollo Chief Economist

Download hi-res chart(s)

Recent Posts

  • The Duration Mismatch in the Banking Sector Is a Risk to Financial Stability
  • Default Rates Are Falling
  • Hybrid in Action: Delivering Bespoke Capital Solutions in a New Market Paradigm
  • Top 5 Risks in 2026
  • Swaption Volatility Remains Remarkably Low Despite Ongoing Fed Debate

Recent Comments

No comments to show.

Archives

  • December 2025
  • November 2025
  • October 2025
  • September 2025
  • August 2025
  • July 2025
  • June 2025
  • May 2025
  • April 2025
  • March 2025
  • February 2025
  • January 2025
  • December 2024
  • November 2024
  • October 2024
  • September 2024
  • August 2024
  • July 2024
  • June 2024
  • May 2024
  • April 2024
  • March 2024
  • February 2024
  • January 2024
  • December 2023
  • November 2023
  • October 2023
  • September 2023
  • August 2023
  • July 2023
  • June 2023
  • May 2023
  • April 2023
  • March 2023
  • February 2023
  • January 2023
  • December 2022
  • November 2022
  • October 2022
  • September 2022
  • August 2022
  • July 2022
  • June 2022
  • May 2022
  • April 2022
  • March 2022
  • February 2022
  • January 2022
  • December 2021
  • November 2021

Categories

  • Apollo Answers
  • Course Introductions
  • Economic Intelligence
  • Hide from Wordpress Search
  • Investment Knowledge
  • Perspectives
  • Redirecting
  • The Daily Spark
  • The View from Apollo
  • The Weekly Brief
  • Uncategorized
  • White Papers

Stocks Are Stories, Bonds and Credit Are Contracts

Stocks are driven by stories. Stories such as AI, weight-loss medication, or CRE being a headwind for regional banks.

The bond market, on the other hand, is different. Bonds and credit are contracts. Contracts are formal and legally binding agreements about delivering future cash flows to investors.

The most remarkable difference between stocks and bonds is how unquantifiable stories are, how stories come and go, and how stories involve selecting certain facts and ignoring other facts.

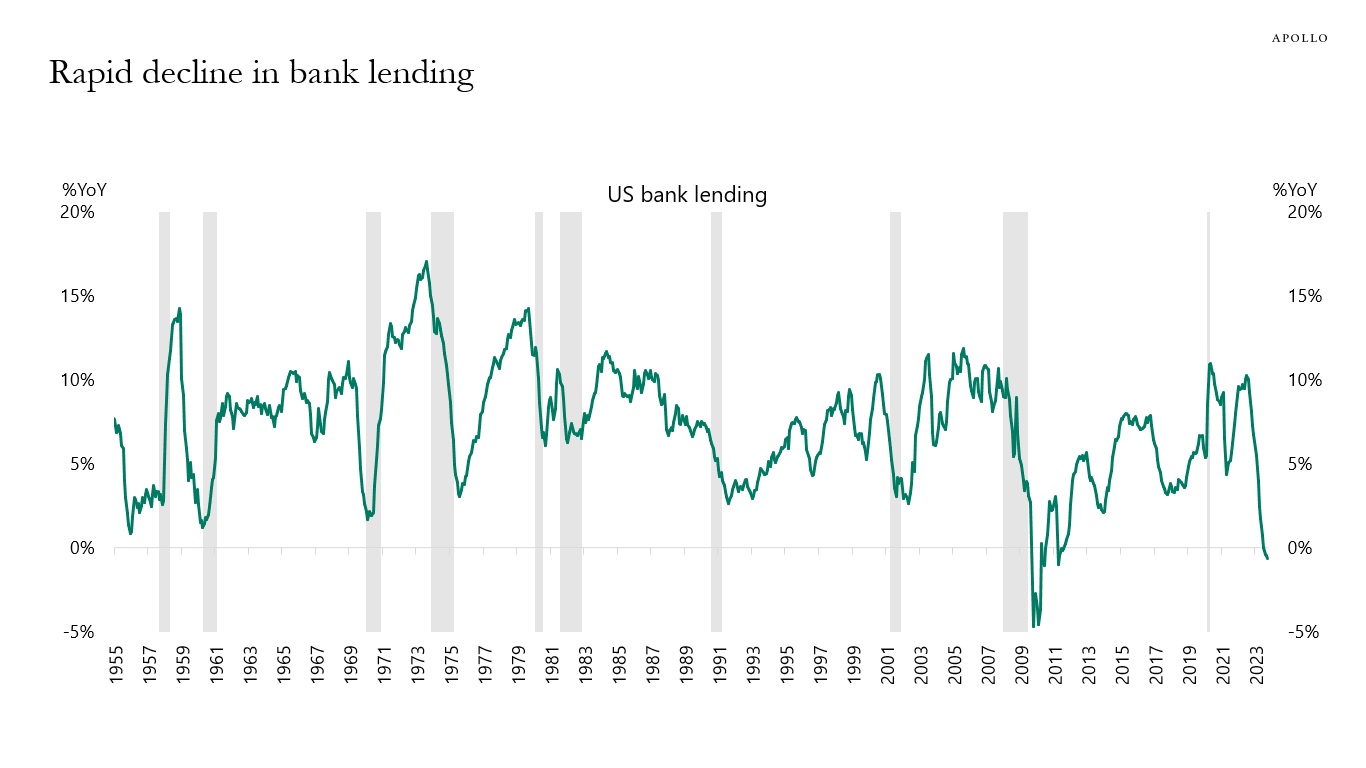
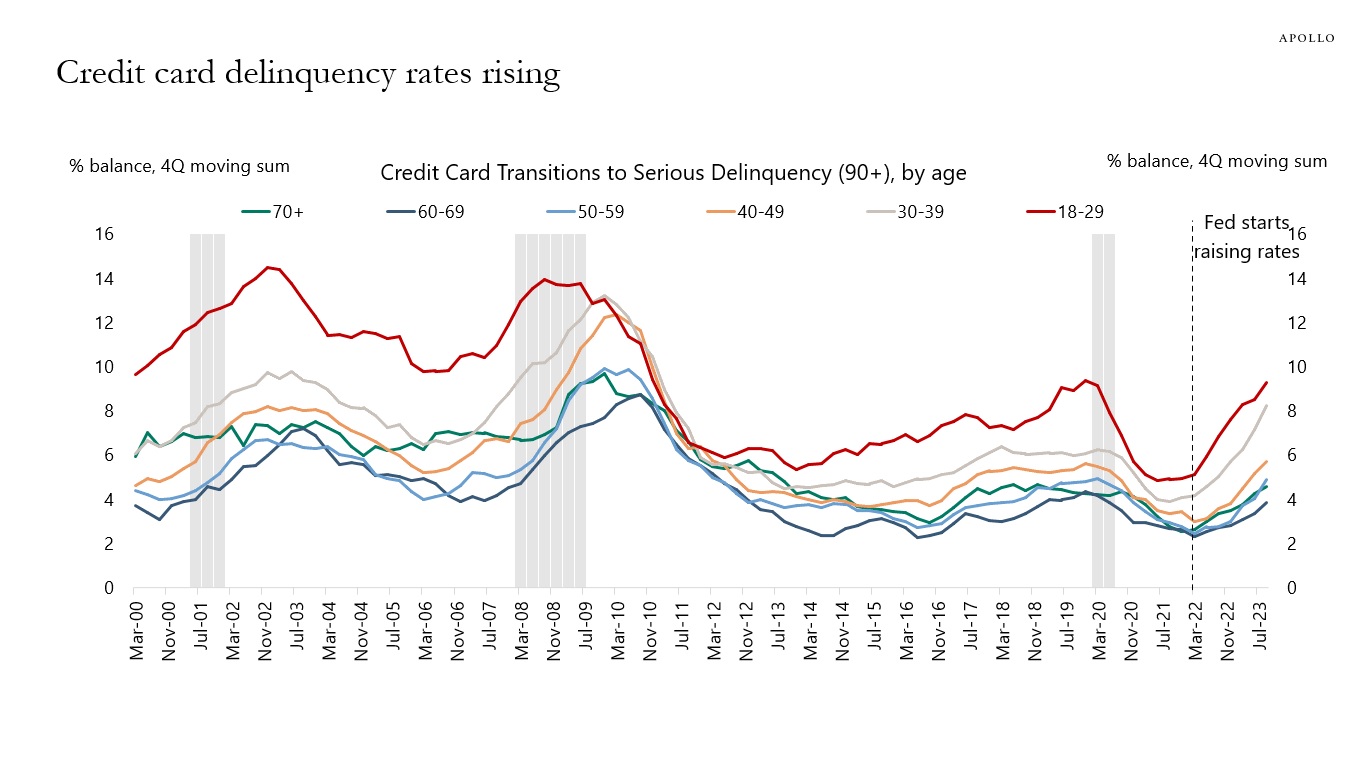
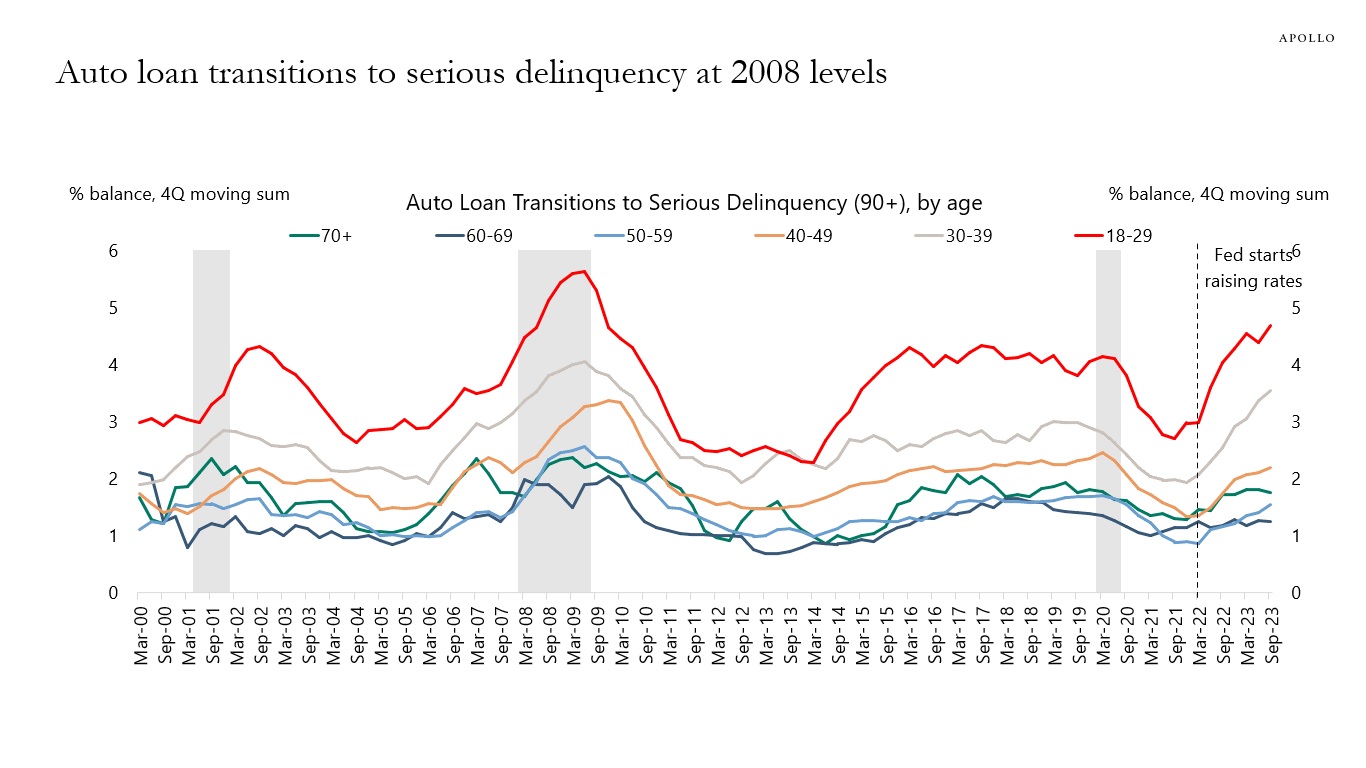
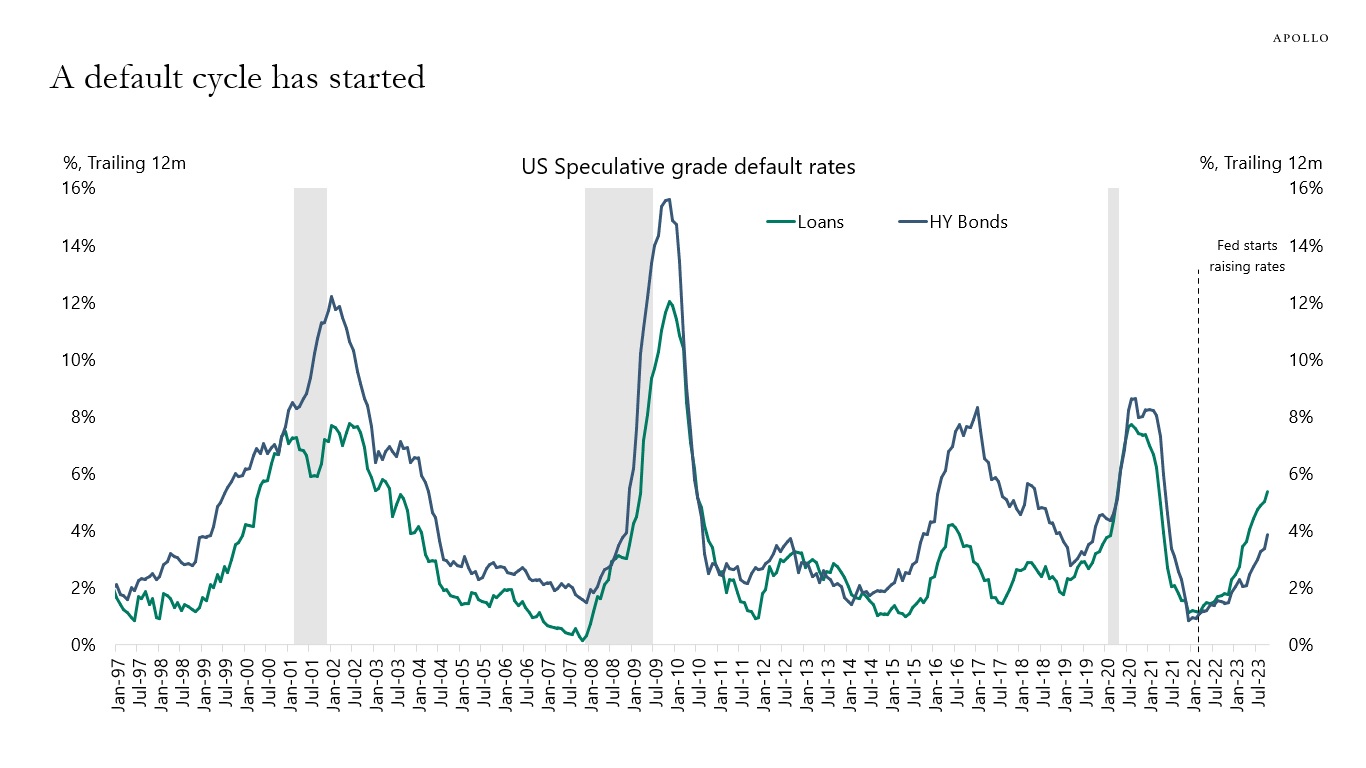
At the moment, stocks are focusing on the rapid decline in inflation. But stocks could also have chosen to focus on rising delinquency rates on credit cards and auto loans, the rise in HY default rates, or the rapid decline in bank lending, see charts below. But these facts are complicated. So, for now, the stock market is holding on to the simple story that inflation is falling. Without the nuance that a rapid decline in inflation would often be driven by a rapid decline in the economy.

With Fed hikes every day biting harder and harder on consumers, firms, and banks, and rates staying high at least until the middle of 2024, the risks are rising that we over the next six months will get a soft landing in inflation and a hard landing in the labor market.

Rapid decline in bank lending
Source: FRB, Haver Analytics, Apollo Chief Economist
Credit card delinquency rates rising
Source: New York Fed Consumer Credit Panel / Equifax, Apollo Chief Economist
Auto loan transitions to serious delinquency at 2008 levels
Source: FRBNY Consumer Credit Panel, Equifax, Haver Analytics, Apollo Chief Economist
A default cycle has started
Source: Moody’s Analytics, Apollo Chief Economist

Download high-res chart(s)

Recent Posts

  • The Duration Mismatch in the Banking Sector Is a Risk to Financial Stability
  • Default Rates Are Falling
  • Hybrid in Action: Delivering Bespoke Capital Solutions in a New Market Paradigm
  • Top 5 Risks in 2026
  • Swaption Volatility Remains Remarkably Low Despite Ongoing Fed Debate

Recent Comments

No comments to show.

Archives

  • December 2025
  • November 2025
  • October 2025
  • September 2025
  • August 2025
  • July 2025
  • June 2025
  • May 2025
  • April 2025
  • March 2025
  • February 2025
  • January 2025
  • December 2024
  • November 2024
  • October 2024
  • September 2024
  • August 2024
  • July 2024
  • June 2024
  • May 2024
  • April 2024
  • March 2024
  • February 2024
  • January 2024
  • December 2023
  • November 2023
  • October 2023
  • September 2023
  • August 2023
  • July 2023
  • June 2023
  • May 2023
  • April 2023
  • March 2023
  • February 2023
  • January 2023
  • December 2022
  • November 2022
  • October 2022
  • September 2022
  • August 2022
  • July 2022
  • June 2022
  • May 2022
  • April 2022
  • March 2022
  • February 2022
  • January 2022
  • December 2021
  • November 2021

Categories

  • Apollo Answers
  • Course Introductions
  • Economic Intelligence
  • Hide from Wordpress Search
  • Investment Knowledge
  • Perspectives
  • Redirecting
  • The Daily Spark
  • The View from Apollo
  • The Weekly Brief
  • Uncategorized
  • White Papers

40% of Companies in Russell 2000 Have Negative Earnings

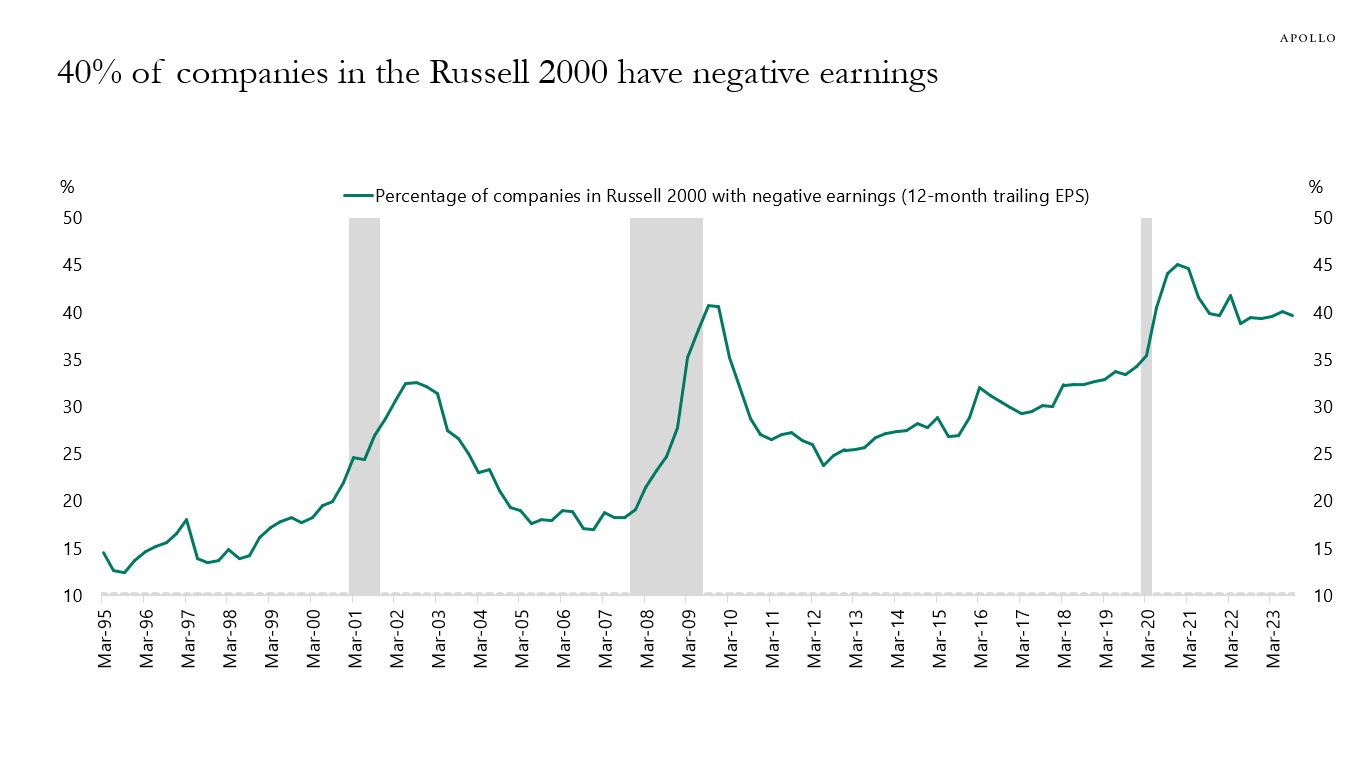
During recessions, the share of unprofitable firms rises. This is not surprising.

But even before the economy has entered a recession, the share of companies in the Russell 2000 with no earnings is at 40%, see chart below.

The bottom line is that if the economy enters a recession, a lot of middle-market companies will be vulnerable to the combination of high rates and slowing growth.

40% of companies in the Russell 2000 have negative earnings
Source: Bloomberg, Apollo Chief Economist

Download high-res chart(s)

Recent Posts

  • The Duration Mismatch in the Banking Sector Is a Risk to Financial Stability
  • Default Rates Are Falling
  • Hybrid in Action: Delivering Bespoke Capital Solutions in a New Market Paradigm
  • Top 5 Risks in 2026
  • Swaption Volatility Remains Remarkably Low Despite Ongoing Fed Debate

Recent Comments

No comments to show.

Archives

  • December 2025
  • November 2025
  • October 2025
  • September 2025
  • August 2025
  • July 2025
  • June 2025
  • May 2025
  • April 2025
  • March 2025
  • February 2025
  • January 2025
  • December 2024
  • November 2024
  • October 2024
  • September 2024
  • August 2024
  • July 2024
  • June 2024
  • May 2024
  • April 2024
  • March 2024
  • February 2024
  • January 2024
  • December 2023
  • November 2023
  • October 2023
  • September 2023
  • August 2023
  • July 2023
  • June 2023
  • May 2023
  • April 2023
  • March 2023
  • February 2023
  • January 2023
  • December 2022
  • November 2022
  • October 2022
  • September 2022
  • August 2022
  • July 2022
  • June 2022
  • May 2022
  • April 2022
  • March 2022
  • February 2022
  • January 2022
  • December 2021
  • November 2021

Categories

  • Apollo Answers
  • Course Introductions
  • Economic Intelligence
  • Hide from Wordpress Search
  • Investment Knowledge
  • Perspectives
  • Redirecting
  • The Daily Spark
  • The View from Apollo
  • The Weekly Brief
  • Uncategorized
  • White Papers

Residential Investment as a Share of GDP Is Low

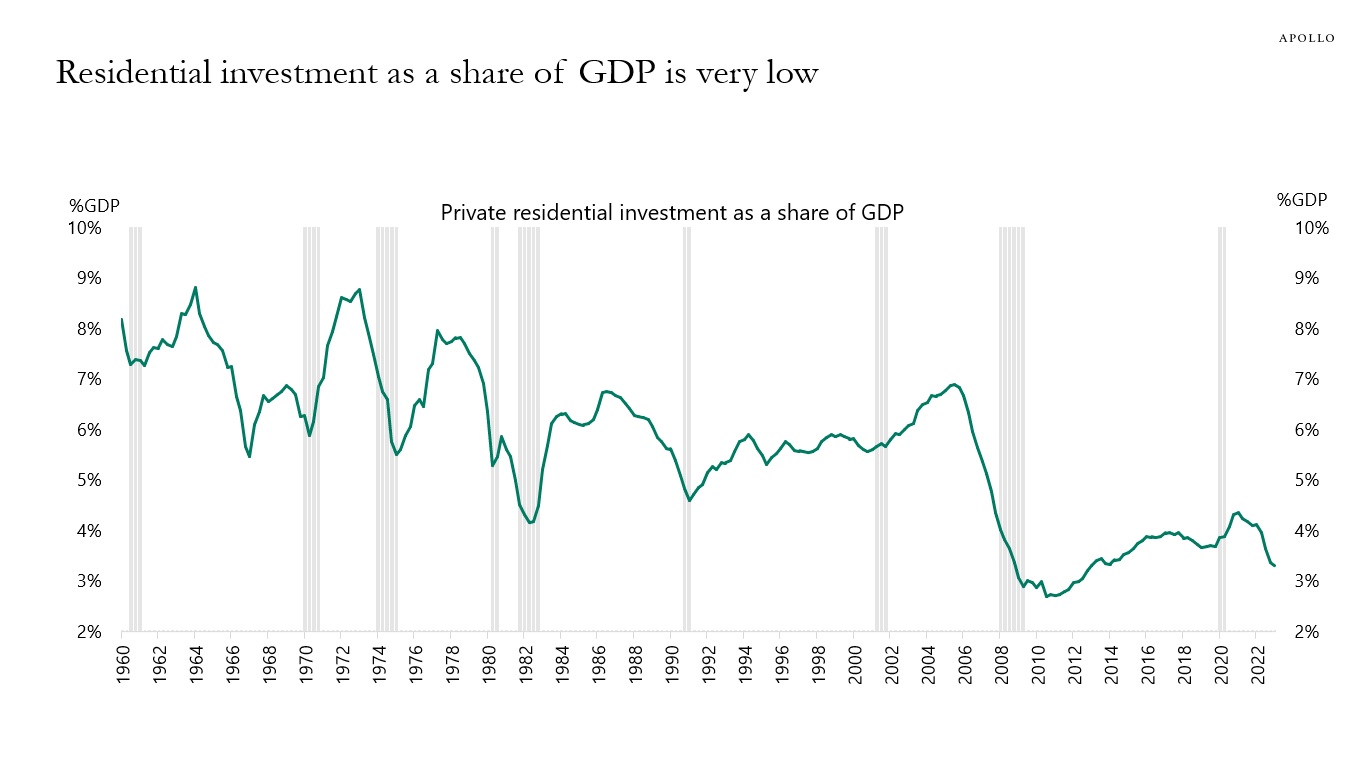
Housing construction as a share of GDP is near all-time low levels, see chart below.

Combined with a very low inventory of homes for sale, the implication for investors is that the downside risks to the economy from housing are limited despite high mortgage rates.

In other words, there is a limit to how much a decline in housing construction can subtract from GDP growth when the level of residential investment is already low.

Residential investment as a share of GDP is very low
Source: BEA, Haver Analytics, Apollo Chief Economist

Download high-res chart(s)

Recent Posts

  • The Duration Mismatch in the Banking Sector Is a Risk to Financial Stability
  • Default Rates Are Falling
  • Hybrid in Action: Delivering Bespoke Capital Solutions in a New Market Paradigm
  • Top 5 Risks in 2026
  • Swaption Volatility Remains Remarkably Low Despite Ongoing Fed Debate

Recent Comments

No comments to show.

Archives

  • December 2025
  • November 2025
  • October 2025
  • September 2025
  • August 2025
  • July 2025
  • June 2025
  • May 2025
  • April 2025
  • March 2025
  • February 2025
  • January 2025
  • December 2024
  • November 2024
  • October 2024
  • September 2024
  • August 2024
  • July 2024
  • June 2024
  • May 2024
  • April 2024
  • March 2024
  • February 2024
  • January 2024
  • December 2023
  • November 2023
  • October 2023
  • September 2023
  • August 2023
  • July 2023
  • June 2023
  • May 2023
  • April 2023
  • March 2023
  • February 2023
  • January 2023
  • December 2022
  • November 2022
  • October 2022
  • September 2022
  • August 2022
  • July 2022
  • June 2022
  • May 2022
  • April 2022
  • March 2022
  • February 2022
  • January 2022
  • December 2021
  • November 2021

Categories

  • Apollo Answers
  • Course Introductions
  • Economic Intelligence
  • Hide from Wordpress Search
  • Investment Knowledge
  • Perspectives
  • Redirecting
  • The Daily Spark
  • The View from Apollo
  • The Weekly Brief
  • Uncategorized
  • White Papers

Japan: 10% of the Population Are over 80 Years Old

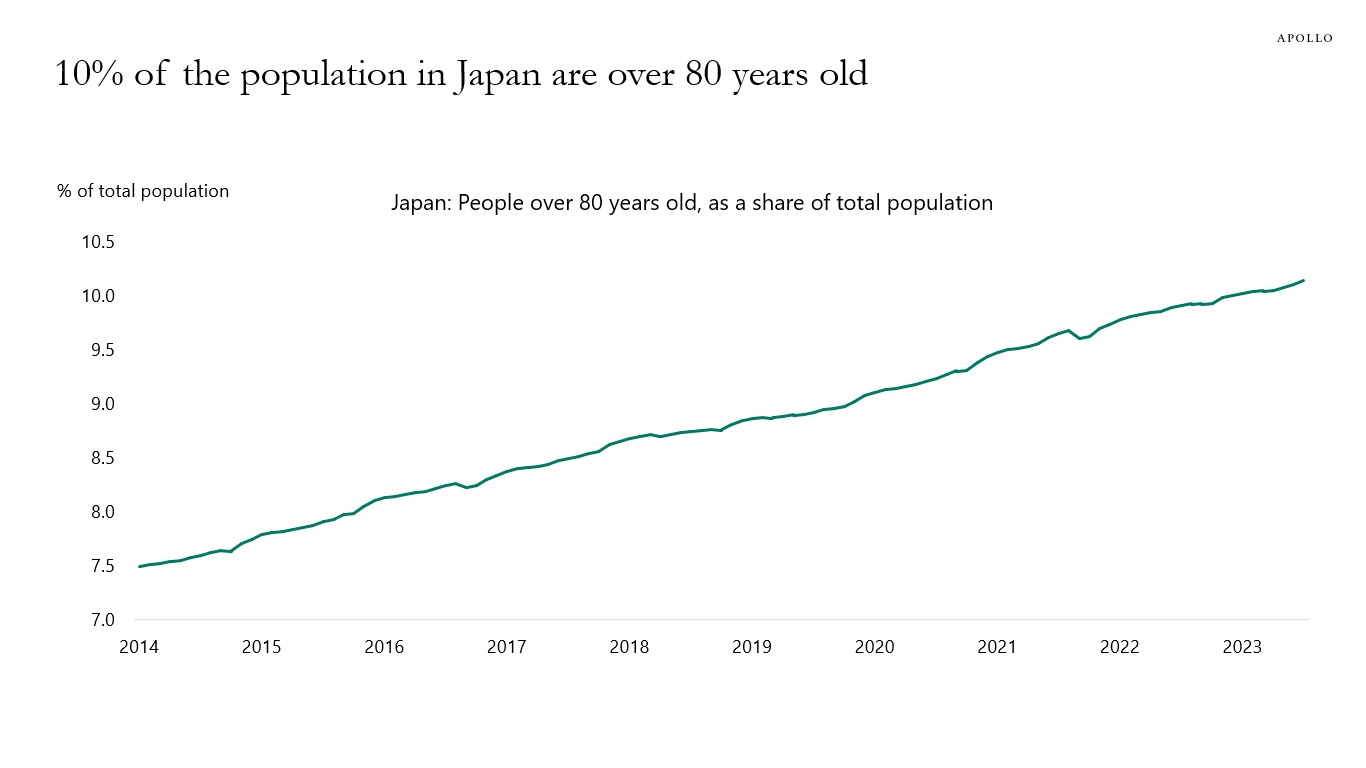
Japan continues to face significant headwinds from demographics, see chart below.

10% of the population in Japan are over 80 years old
Source: Bloomberg, Apollo Chief Economist

Download high-res chart(s)

Recent Posts

  • The Duration Mismatch in the Banking Sector Is a Risk to Financial Stability
  • Default Rates Are Falling
  • Hybrid in Action: Delivering Bespoke Capital Solutions in a New Market Paradigm
  • Top 5 Risks in 2026
  • Swaption Volatility Remains Remarkably Low Despite Ongoing Fed Debate

Recent Comments

No comments to show.

Archives

  • December 2025
  • November 2025
  • October 2025
  • September 2025
  • August 2025
  • July 2025
  • June 2025
  • May 2025
  • April 2025
  • March 2025
  • February 2025
  • January 2025
  • December 2024
  • November 2024
  • October 2024
  • September 2024
  • August 2024
  • July 2024
  • June 2024
  • May 2024
  • April 2024
  • March 2024
  • February 2024
  • January 2024
  • December 2023
  • November 2023
  • October 2023
  • September 2023
  • August 2023
  • July 2023
  • June 2023
  • May 2023
  • April 2023
  • March 2023
  • February 2023
  • January 2023
  • December 2022
  • November 2022
  • October 2022
  • September 2022
  • August 2022
  • July 2022
  • June 2022
  • May 2022
  • April 2022
  • March 2022
  • February 2022
  • January 2022
  • December 2021
  • November 2021

Categories

  • Apollo Answers
  • Course Introductions
  • Economic Intelligence
  • Hide from Wordpress Search
  • Investment Knowledge
  • Perspectives
  • Redirecting
  • The Daily Spark
  • The View from Apollo
  • The Weekly Brief
  • Uncategorized
  • White Papers

Paying for Alpha but Getting Beta?

Benchmark constraints can create unintended concentration in fixed-income portfolios, hindering alpha-generation potential. Relaxing these restrictions may enhance diversification and help unlock potential excess returns. In this paper, we illustrate how integrating less-constrained or unconstrained strategies can help enhance long-term risk-adjusted performance.

DOWNLOAD THE PAPER

Key Takeaways

  • Fixed-income portfolios relying on traditional strategic asset allocation models could be exposed to hidden risks. As most traditional active and passive strategies are benchmarked to the same indices, market participants can end up with significant holdings overlap and suboptimal portfolio allocations. This benchmarking strategy risks degrading performance namely through increased concentration across holdings, higher volatility, lower returns, or worse—a portfolio paying for alpha but only receiving beta.
  • We believe that relaxing these benchmark constraints in fixed-income portfolios can generate true alpha and higher risk-adjusted returns. This can be achieved through allocations to unconstrained strategies that extend the investable universe across sub-asset classes in both public and private markets. We believe it is important to consider managers who approach portfolio construction from a bottom-up perspective, which can translate to differentiated investment portfolios with lower correlation and increased performance over time.
  • Loosening constraints can also provide active managers the flexibility to position portfolios dynamically throughout the market cycle, minimizing default and other risks, and creating new opportunities for potential alpha generation.
  • In this paper, we examine how benchmarking issues can undermine performance in fixed-income portfolios. We also use an illustrative, simplified, non-optimized portfolio based on publicly available data to demonstrate how integrating less-constrained or unconstrained strategies can enhance long-term risk-adjusted returns.
DOWNLOAD THE PAPER

The information herein is provided for educational purposes only and should not be construed as financial or investment advice, nor should any information in this document be relied on when making an investment decision. Opinions and views expressed reflect the current opinions and views of the authors and Apollo Analysts as of the date hereof and are subject to change. Please see the end of this document for important disclosure information.


Important Disclosure Information

This presentation is for educational purposes only and should not be treated as research. This presentation may not be distributed, transmitted or otherwise communicated to others, in whole or in part, without the express written consent of Apollo Global Management, Inc. (together with its subsidiaries, “Apollo”).

The views and opinions expressed in this presentation are the views and opinions of the author(s) of the White Paper. They do not necessarily reflect the views and opinions of Apollo and are subject to change at any time without notice. Further, Apollo and its affiliates may have positions (long or short) or engage in securities transactions that are not consistent with the information and views expressed in this presentation. There can be no assurance that an investment strategy will be successful. Historic market trends are not reliable indicators of actual future market behavior or future performance of any particular investment which may differ materially, and should not be relied upon as such. Target allocations contained herein are subject to change. There is no assurance that the target allocations will be achieved, and actual allocations may be significantly different than that shown here. This presentation does not constitute an offer of any service or product of Apollo. It is not an invitation by or on behalf of Apollo to any person to buy or sell any security or to adopt any investment strategy, and shall not form the basis of, nor may it accompany nor form part of, any right or contract to buy or sell any security or to adopt any investment strategy. Nothing herein should be taken as investment advice or a recommendation to enter into any transaction.

Hyperlinks to third-party websites in this presentation are provided for reader convenience only. There can be no assurance that any trends discussed herein will continue. Unless otherwise noted, information included herein is presented as of the dates indicated. This presentation is not complete and the information contained herein may change at any time without notice. Apollo does not have any responsibility to update the presentation to account for such changes. Apollo has not made any representation or warranty, expressed or implied, with respect to fairness, correctness, accuracy, reasonableness, or completeness of any of the information contained herein, and expressly disclaims any responsibility or liability therefore. The information contained herein is not intended to provide, and should not be relied upon for, accounting, legal or tax advice or investment recommendations. Investors should make an independent investigation of the information contained herein, including consulting their tax, legal, accounting or other advisors about such information. Apollo does not act for you and is not responsible for providing you with the protections afforded to its clients.

Certain information contained herein may be “forward-looking” in nature. Due to various risks and uncertainties, actual events or results may differ materially from those reflected or contemplated in such forward-looking information. As such, undue reliance should not be placed on such information. Forward-looking statements may be identified by the use of terminology including, but not limited to, “may”, “will”, “should”, “expect”, “anticipate”, “target”, “project”, “estimate”, “intend”, “continue” or “believe” or the negatives thereof or other variations thereon or comparable terminology.

The Standard & Poor’s 500 (“S&P 500”) Index is a market-capitalization-weighted index of the 500 largest U.S. publicly traded companies by market value.

Additional information may be available upon request.

Recent Posts

  • The Duration Mismatch in the Banking Sector Is a Risk to Financial Stability
  • Default Rates Are Falling
  • Hybrid in Action: Delivering Bespoke Capital Solutions in a New Market Paradigm
  • Top 5 Risks in 2026
  • Swaption Volatility Remains Remarkably Low Despite Ongoing Fed Debate

Recent Comments

No comments to show.

Archives

  • December 2025
  • November 2025
  • October 2025
  • September 2025
  • August 2025
  • July 2025
  • June 2025
  • May 2025
  • April 2025
  • March 2025
  • February 2025
  • January 2025
  • December 2024
  • November 2024
  • October 2024
  • September 2024
  • August 2024
  • July 2024
  • June 2024
  • May 2024
  • April 2024
  • March 2024
  • February 2024
  • January 2024
  • December 2023
  • November 2023
  • October 2023
  • September 2023
  • August 2023
  • July 2023
  • June 2023
  • May 2023
  • April 2023
  • March 2023
  • February 2023
  • January 2023
  • December 2022
  • November 2022
  • October 2022
  • September 2022
  • August 2022
  • July 2022
  • June 2022
  • May 2022
  • April 2022
  • March 2022
  • February 2022
  • January 2022
  • December 2021
  • November 2021

Categories

  • Apollo Answers
  • Course Introductions
  • Economic Intelligence
  • Hide from Wordpress Search
  • Investment Knowledge
  • Perspectives
  • Redirecting
  • The Daily Spark
  • The View from Apollo
  • The Weekly Brief
  • Uncategorized
  • White Papers

CMBS Delinquency Rates Vary

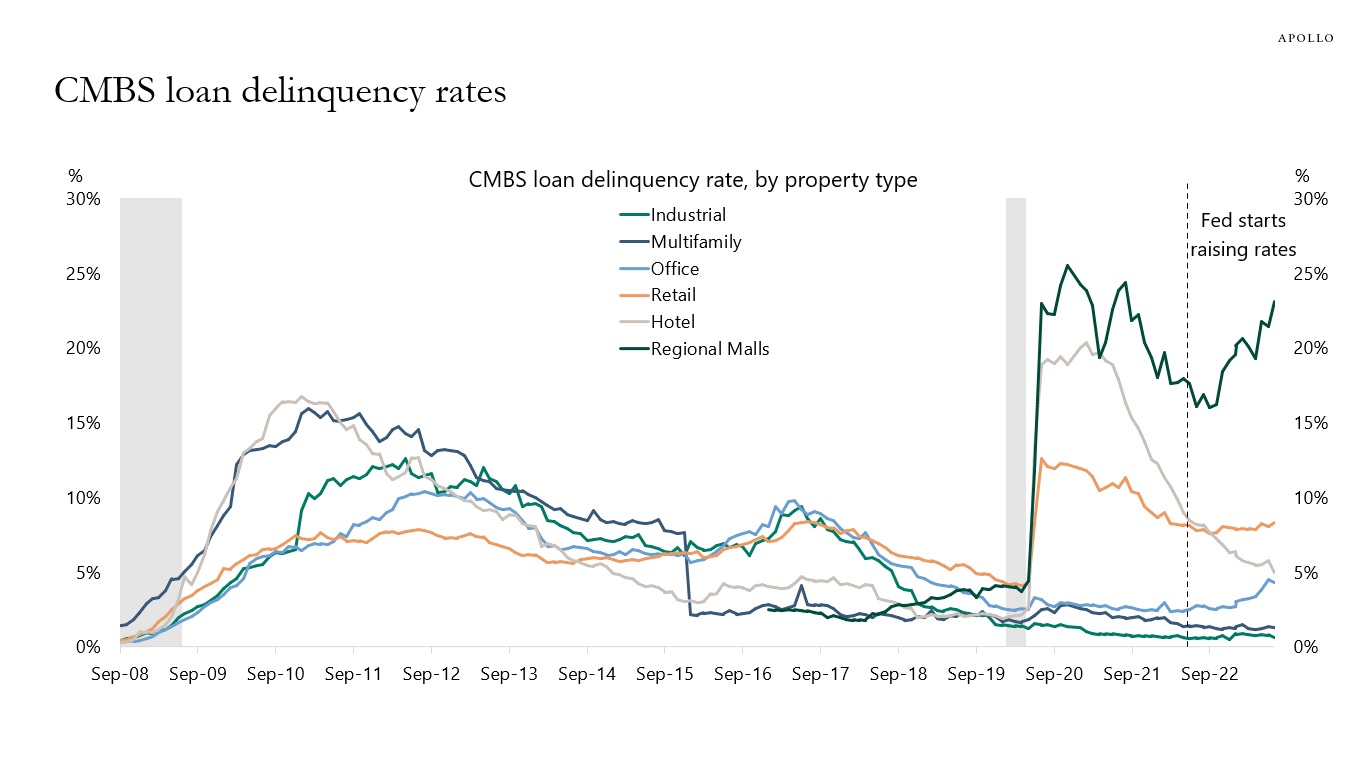
Before the pandemic, the sub-components of CMBS traded as one asset class where delinquency rates would move up and down in sync with the business cycle.

Since the pandemic and after the Fed started raising rates, there has been significant differentiation between different types of commercial real estate, with delinquency rates for office and regional malls rising, delinquency rates for hotels first going up and then down, and the delinquency rate for retail settling at a permanently higher level, see chart below.

The bottom line is that after the pandemic, active credit selection has become key for investors in CMBS and CRE more broadly.

CMBS loan delinquency rates
Source: Moody’s Analytics, Apollo Chief Economist

Download high-res chart(s)

Recent Posts

  • The Duration Mismatch in the Banking Sector Is a Risk to Financial Stability
  • Default Rates Are Falling
  • Hybrid in Action: Delivering Bespoke Capital Solutions in a New Market Paradigm
  • Top 5 Risks in 2026
  • Swaption Volatility Remains Remarkably Low Despite Ongoing Fed Debate

Recent Comments

No comments to show.

Archives

  • December 2025
  • November 2025
  • October 2025
  • September 2025
  • August 2025
  • July 2025
  • June 2025
  • May 2025
  • April 2025
  • March 2025
  • February 2025
  • January 2025
  • December 2024
  • November 2024
  • October 2024
  • September 2024
  • August 2024
  • July 2024
  • June 2024
  • May 2024
  • April 2024
  • March 2024
  • February 2024
  • January 2024
  • December 2023
  • November 2023
  • October 2023
  • September 2023
  • August 2023
  • July 2023
  • June 2023
  • May 2023
  • April 2023
  • March 2023
  • February 2023
  • January 2023
  • December 2022
  • November 2022
  • October 2022
  • September 2022
  • August 2022
  • July 2022
  • June 2022
  • May 2022
  • April 2022
  • March 2022
  • February 2022
  • January 2022
  • December 2021
  • November 2021

Categories

  • Apollo Answers
  • Course Introductions
  • Economic Intelligence
  • Hide from Wordpress Search
  • Investment Knowledge
  • Perspectives
  • Redirecting
  • The Daily Spark
  • The View from Apollo
  • The Weekly Brief
  • Uncategorized
  • White Papers

The Slowdown Continues

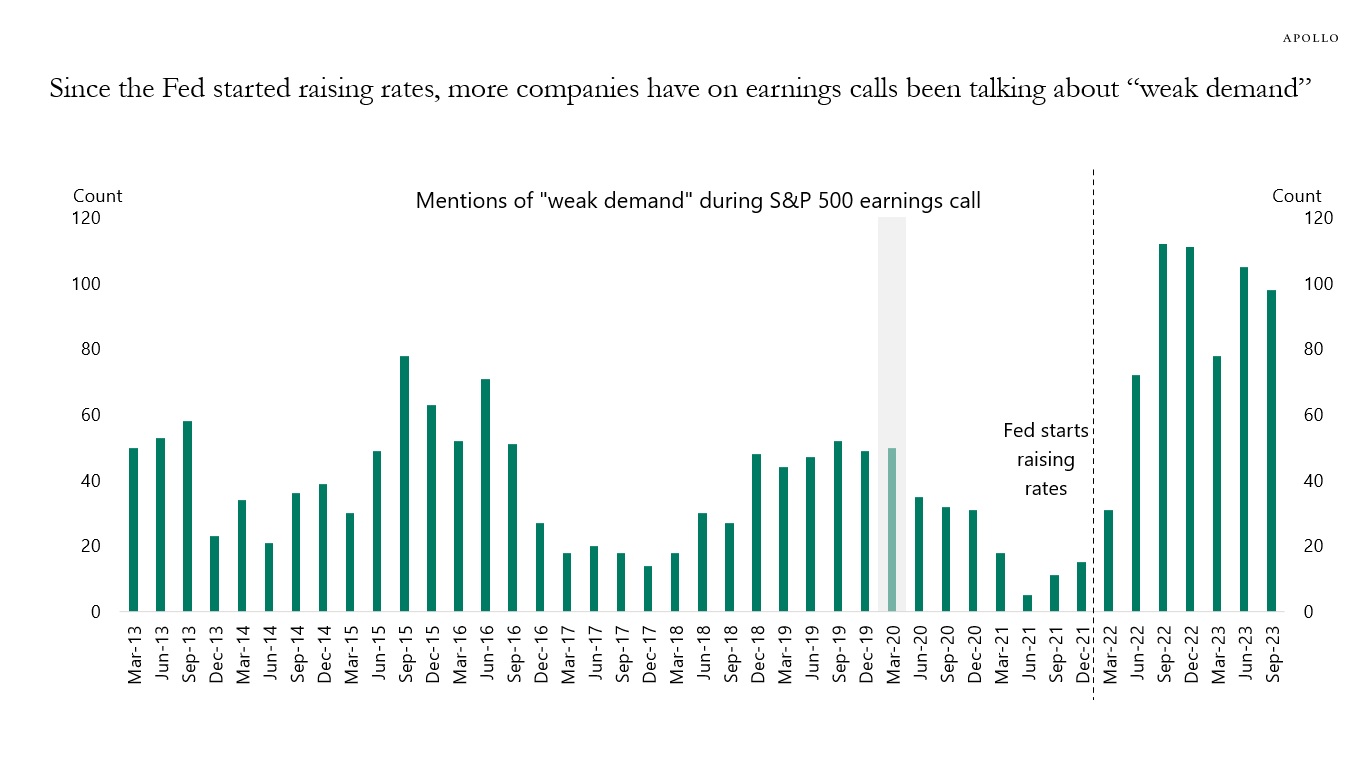
Since the Fed started raising rates in March 2022, S&P500 companies have on earnings calls talked more and more about weak demand, see chart below.

This is what the textbook would have predicted. Higher interest rates increase borrowing costs for consumers and corporates—which slows down demand.

Since the Fed started raising rates, more companies have on earnings calls been talking about “weak demand”
Source: Bloomberg, Apollo Chief Economist. Note: “weak demand” includes consumer demand, consumption demand, deteriorate, decelerate, demand side, end market, erode, market demand, sluggish, soften, softer, softening, weaken, weakening, and worsen.

Download high-res chart(s)

Recent Posts

  • The Duration Mismatch in the Banking Sector Is a Risk to Financial Stability
  • Default Rates Are Falling
  • Hybrid in Action: Delivering Bespoke Capital Solutions in a New Market Paradigm
  • Top 5 Risks in 2026
  • Swaption Volatility Remains Remarkably Low Despite Ongoing Fed Debate

Recent Comments

No comments to show.

Archives

  • December 2025
  • November 2025
  • October 2025
  • September 2025
  • August 2025
  • July 2025
  • June 2025
  • May 2025
  • April 2025
  • March 2025
  • February 2025
  • January 2025
  • December 2024
  • November 2024
  • October 2024
  • September 2024
  • August 2024
  • July 2024
  • June 2024
  • May 2024
  • April 2024
  • March 2024
  • February 2024
  • January 2024
  • December 2023
  • November 2023
  • October 2023
  • September 2023
  • August 2023
  • July 2023
  • June 2023
  • May 2023
  • April 2023
  • March 2023
  • February 2023
  • January 2023
  • December 2022
  • November 2022
  • October 2022
  • September 2022
  • August 2022
  • July 2022
  • June 2022
  • May 2022
  • April 2022
  • March 2022
  • February 2022
  • January 2022
  • December 2021
  • November 2021

Categories

  • Apollo Answers
  • Course Introductions
  • Economic Intelligence
  • Hide from Wordpress Search
  • Investment Knowledge
  • Perspectives
  • Redirecting
  • The Daily Spark
  • The View from Apollo
  • The Weekly Brief
  • Uncategorized
  • White Papers

Posts navigation

←Previous page Page 1 Page 2 Page 3 Page 4 Next page→
  • Privacy Notice
  • Terms of Use
  • Forward-Looking Statements
Apollo
© Apollo Global Management, Inc. All Rights Reserved.

The Apollo Academy is for informational and educational purposes only and nothing contained herein should be taken as investment advice or a recommendation to enter into any transaction. They are not an invitation by or on behalf of Apollo to any person to buy or sell any security or to adopt any investment strategy, and shall not form the basis of, nor may it accompany nor form part of, any right or contract to buy or sell any security or to adopt any investment strategy. There is no guarantee that the views and opinions expressed in this website will come to pass. For additional information, please see the disclaimers included in each piece of content or the legal page of our website here.